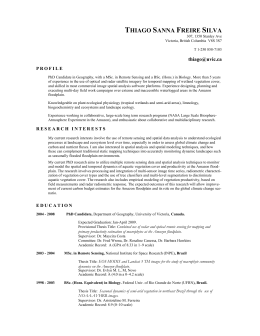
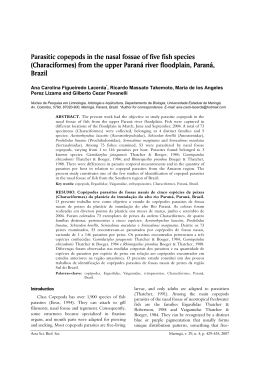
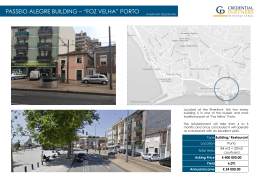
INTEGRATED MODELING OF MAIN CHANNEL AND FLOODPLAIN APPLIED TO AQUIDAUANA RIVER, IN BRAZILIAN PANTANAL Adriano Rolim da Paz, Walter Collischonn, Carlos E. M. Tucci (1) Instituto de Pesquisas Hidráulicas, Universidade Federal do Rio Grande do Sul, Av. Bento Gonçalves, 9500, Caixa Postal 15029, Agronomia, CEP 91501-970, Porto Alegre (RS), Brazil phone: +55 51 3316 7511; fax: +55 51 3316 6270; e-mail: [email protected], {collischonn, tucci}@iph.ufrgs.br ABSTRACT The hydrology and hydrodynamics constitute some of the main governing factors of ecosystem functioning and thus its mathematical representation plays a key role to ecological studies and to water resources planning and management. Several methodologies have been applied to streamflow simulation. However, rivers with large floodplains need a more specific mathematical methodology to represent then, owing to occurrence of huge volumes of water exchanged between main channel and floodplain and appearence of secondary fluxes in the floodplain. Rivers in the Upper Paraguay River Basin, in the Brazilian Pantanal, present such hydrologic pattern. This paper presents a methodology to integrated modeling of main channel and floodplain. The proposed methodology consists of combining a one-dimensional hydrodynamic model applied to the main channel and a raster-based model applied to the floodplain. Such methodology was applied to Aquidauana River, in the river reach between the river gauging stations of Aquidauana and Porto Ciríaco. The time period from december/1999 to may/2000 was simulated and interesting results were achieved, such as the hydrograph falling from upstream to downstream closely to the observed values and the occurrence of a kind of maximum discharge in the hydrograph at Porto Ciriaco river section. Flood extent propagation along the floodplain was simulated by the raster-based model, representing the secondary fluxes independently of the main river flux. Keywords: floodplain, Pantanal, hydrologic modeling 1 INTRODUCTION Hydrodynamics of aquatic systems plays a key role in ecosystem functioning, and influences physical, chemical, biological and ecological processes. In river systems with large floodplains, the hydrodynamic behavior becomes more ecologically valuable. Sediment transport, nutrient cycling, creation of flooded areas propitious to fish reproduction and egg deposition, seed transport and deposition are just some examples that illustrate how exchanges of water volumes between main channel and floodplain may affect the whole ecosystem (Postel and Richter, 2003). Therefore, numerical modeling and simulation of the hydrologic regime of river main channel and its floodplain is essential to understand, represent and predict ecosystem functioning. Several methodologies have been applied to mathematically represent water flow in rivers with floodplain. Depending on the purposes of the study and on the modeled system characteristics, a specific and suitable approach is required to deal with the water volumes exchanged between main channel and floodplain. For example, rivers of the upper Paraguay River basin, at Pantanal Wetlands (South America), are characterized by huge volumes of water exchanged between main channel and floodplain, mainly due to the limited capacity of main channel to convey floodwater (Hamilton et al., 2002; Hamilton, 1999). In the section of Paraguay River between Amolar and São Francisco gauging stations, exchanges of water between main channel and floodplain may reach a flow up to 1 000 m3/s (Bravo et al., in press). The simplest method of river modeling consists of using a one-dimensional (1D) model and considering the floodplain as storage areas or adopting compound cross sections (Cunge et al., 1980). The more complex approach is based on employing two- (2D) or three dimensional (3D) models. While 1D methods are not able to represent the lateral exchanges of water in a desirable way, application of 2D or 3D hydrodynamic models to rivers and floodplains faces with problems related to a complex floodplain topography, shallow water depths, and the wetting and drying process (Gillan et al., 2005; Bates et al., 2005; Werner, 2004; Bates and De Roo, 2000). An alternative approach consists of using a cell-based model, which represents the floodplain areas by interconnected cells constituting a two-dimensional horizontal network (Cunge et al., 1980; Miguez and Mascarenhas, 1999; Villanueva, 1998). The main shortcoming of this methodology is its inability to represent secondary fluxes that take place in the floodplain. Owing to the increasingly development of geoprocessing techniques and Geographical Information Systems (GIS) and availability of remote sensing data, raster-based models have been developed and applied, such as the LISFLOOD-FP (Horrit and Bates, 2001a; Bates and De Roo, 2000) and DELFT-FLS (Stelling and Duijnmeier, 2003) models. These models represent the floodplain by a rectangular grid, and each grid element is interconnected with its neighbors and some of them with the main channel, which is in turn simulated by a 1D model. Besides simulating floodplain secondary fluxes, raster-based models allow a better representation of the spatial variability of floodplain characteristics and produce very useful results such as inundation maps which may be readily integrated to GIS. Benefits of integrated modeling of river and floodplain by combining 1D and 2D models are highlighted by several authors (Stelling and Verwey, 2005; Gillam et al., 2005; Verwey, 2001; Horritt and Bates, 2001b). This paper describes a methodology of combining a 1D hydrodynamic model and a raster-based floodplain model, and its application to a section of the Aquidauana River, in the Brazilian Pantanal Wetlands. The ecological importance of the Pantanal, the role of the flood pulse for the ecosystem and the increasing threat by large development programs are discussed by several authors, such as Junk and Nunes de Cunha (2005), Girard et al. (2003), and Hamilton (1999), for example. Studying and modeling inundation patterns of Pantanal may constitute an important step towards a better management of such vast complex floodplains. 2 METHODOLOGY In this research, a model for simulating flow propagation along the main river channel was combined with a raster-based model applied to the floodplain. The main flow along river channel was simulated with a 1D hydrodynamic model, while a raster-based approach was adopted to model the 2D fluxes over floodplain. A specific module was developed aiming to allow the integrated modeling of the two systems (main channel and floodplain). The following sections describe both models used and the linkage procedure. 2.1 MAIN CHANNEL MODELING Flow propagation along river main channel was simulated with the 1D hydrodynamic model IPH4 developed by Tucci (1978, 1998). This model solves the complete Saint Venant equations (equations 1 and 2) of fluid dynamics using a finite differences method with an implicit scheme. Detailed description of IPH4 model is presented by Tucci (1978, 1998). ∂h 1 ∂Q + =q (1) ∂t b ∂x ∂Q ∂ Q 2 ∂h + gA + gA( S f − S 0 ) = 0 + (2) ∂t ∂t A ∂x where: h is the flow depth; t the time step; Q is the discharge; x the distance along the longitudinal river length; b and A are the width and area of river cross-section, respectively; g the local gravity acceleration; Sf the energy slope; S0 the channel bed slope; q is the sum of lateral discharges along the river reach. 2.2 FLOODPLAIN MODELING A raster-based approach was employed for simulating flow propagation along the floodplain, following the methodology proposed by Bates and De Roo (2000). Such authors presented the LISFLOOD-FP model, which was also employed in several studies (Bates et al., 2006; Bates et al., 2005; Hunter et al., 2005; Horritt and Bates, 2002; Horritt and Bates, 2001a; Horritt and Bates, 2001b). While cell-based models identify specific areas to be represented and modeled individually by large cells (Figure 1-a) (Cunge et al., 1980), rasterbased models divide the entire floodplain in square-grid elements (pixels) (Figure 1-b). These grid elements are interconnected and water volumes are exchanged between neighbouring elements and also between grid elements and the main channel. In this research, the main channel does not occupy any elements in the floodplain, being represented by a single vector line and simulated by the 1D hydrodynamic model described in previous subsection, following the approach adopted by Bates et al. (2005) and Horritt and Bates (2001a). For each floodplain element, a horizontal water level is assumed, and its water volume varies in function of input and output flows (Bates and De Roo, 2000): ∂V = Qup + Qdown + Qleft + Qright + QR − FP , (3) ∂t where: V is the water volume; t is the time; Qup, Qdown, Qleft and Qright are the discharges exchanged with the neighbouring elements located above, bellow, in the left and in the right, respectively, of such element; QR-FP is the discharge exchanged between the floodplain element and the river reach. This water balance may be modified to take into account others’ input and output of water, such as precipitation, evapotranspiration and soil infiltration. In this research, each floodplain element is allowed to exchange water volumes with its four neighbours and with the main river channel if such element lies over the river network (Figure 1-b). A numerical discretization explicit in time and regressive in space was adopted, where the water level in each grid element is located in its centre and the discharges exchanged with its neighbours are related to the correspondent element faces (Figure 1-c): t i −1, j t i , j t i , j −1 t i , j Q x − Qx + Q y − Q y h i, j − t h i, j = (4) ∆t ∆x∆y where: t h i , j is the water depth in the element (i,j) in time t; Q xi , j is the discharge exchanged t + ∆t in x-direction between the element (i,j) and the element (i+1,j); Q yi , j is the discharge exchanged in y-direction between the element (i,j) and the element (i, j+1); ∆t is the time step; ∆x and ∆y are the spatial resolution in x- and y-direction, respectively. The discharge between two grid elements may be calculated through hydraulic equations such as flow resistance equations (Manning, Chèzy) or weir and spill equations. In this research, Manning equation was adopted, using a numerical discretization in time and space as follows: 1/ 2 / 3 t i , j t i +1, j h −h h 5flow t i, j ⋅ ∆y , Qx = ± i, j (5) ∆x n i, j where n is the Manning’s coefficient of resistance of the element (i,j) and t h flow is the water depth available to the flow between the elements (i,j) and (i+1,j) at time t. The water depth h flow is defined as the difference between the highest water level of the two elements and the highest bed elevation (Horritt and Bates, 2001a; Bates and De Roo, 2000). The discharges in y-direction are calculated analogously. t Figure 1 (a) Cell-based floodplain model structure (adapted from Bravo et al., in press); (b) Raster-based floodplain model structure; (c) Location of discharges and water depth related to floodplain grid element (i,j). 2.3 LINKAGE BETWEEN MAIN CHANNEL AND FLOODPLAIN Linkage between river main channel and floodplain is achieved by connecting floodplain elements to river reaches and calculating the discharges exchanged between both modeled systems. Topological linkage between floodplain and main channel is done previously to simulation start, after models initialization, through a GIS-based automatic procedure (Figure 2). Each floodplain element which lies over the river vector network is identified and connected to the correspondent river reach. In this step flow equations and parameters related to discharge between floodplain and main channel are also defined, and may vary within each floodplain element. For example, one may adopt a Manning resistance coefficient spatially variable according with land use derived from satellite images. The main channel is represented in the 1D model by river reaches associated with one upstream and one downstream river cross sections. Due to differences in discretization, several floodplain grid elements are usually connected to the same river reach. A linear approximation was adopted in order to determine water level and bed elevation of the river reach at points located between its upstream and downstream river cross sections, where are located the intermediary floodplain elements. During simulation, river and floodplain models are combined delayed in time. This delay is equal to one time step adopted to simulating river main channel (dtR), which is usually several times greater than the time step used in the raster-based model (dtFP). The 1D model runs for one river time step (dtR) and the floodplain model runs np times until complete 1 dtR (np = dtR/dtFP). Then, discharges are calculated for each existing linkage between floodplain elements and river reaches. These calculated exchange discharges are considered as input or output in river and floodplain models in the next time step. Figure 2 Description of the initialization and simulation procedures developed for combining river and floodplain models. 3 STUDY SITE The methodology was applied to the Aquidauana River, in a 230 km section between the gauging stations of Aquidauana and Porto Ciríaco. Aquidauana River is located in the upper Paraguay River basin, in Brazilian Pantanal Wetlands (Figure 3-a), which is one of the world’s most extensive wetland complexes and was designated by UNESCO as a Biosphere Reserve in the year 2000. Upper Paraguay River and some of its tributaries are characterized by very flat areas and seasonal occurrence of floodplain inundation, mainly due to the limited capacity of the river channels to convey the seasonal floodwater (ANA/GEF/PNUMA/OEA, 2005; Hamilton et al., 2002; Hamilton, 1999). Comparison between the upstream and downstream hydrographs of the study river reach illustrates the huge volumes of water exchanged between main channel and floodplain (Figure 3-b). In the 1D hydrodynamic model, the main channel was discretized in 49 reaches of 4 700 km length each one. Boundary conditions were located in the upstream river section (Aquidauana) and 66 km downstream from the Porto Ciríaco gauging station, to avoid influence over the calculated hydrograph at this location. Daily discharges were available from ANA (2005), and a 145-day period was simulated (from 28 December 1999 to 20 May 2000, period indicated by the dashed rectangle in Figure 3-b). Manning’s coefficient of resistance was adopted with values equal to 0.025 in the main channel and 0.05 in the floodplain, based on literature mean values (Werner, 2004; Chow, 1959). A resolution of 200 m (0.002o) was adopted to the raster-based floodplain model. Elevation data for the floodplain grid elements were obtained by resampling the globally-wide available Digital Elevation Model (DEM) produced by the Shuttle Radar Topography Mission (SRTM), with resolution of three arc second (~90 m) (CGIAR-CSI, 2005). Due to the lack of available data, bed slope of main channel was derived from the DEM, with values ranging from 0.20 m/km to 0.11 m/km (Figure 3-c). A time step of 15 min was adopted to the 1D hydrodynamic model (dtR = 15 min), while a smaller time step was necessary to be used in the floodplain raster model (dtFP = 2 s) in order to avoid numerical instabilities. A different approach would consist of using an adaptive time step to floodplain model as proposed by Hunter et al. (2005). Figure 3 (a) Location of the Aquidauana River, in the section between the gauging stations of Aquidauana and Porto Ciríaco (adapted from http://www.ana.gov.br/gefap); (b) Daily discharges at Aquidauana and Porto Ciríaco stations (the dashed rectangle indicates the simulation period); (c) Stream elevation profile of Aquidauana River represented in the 1D hydrodynamic model. 4 RESULTS AND DISCUSSION Despite no calibration was carried out in both river and floodplain model parameters, in general the results were quite satisfactory. The hydrograph falling from upstream to downstream was reproduced close to observed values (Figure 4). The calculated discharge peak was reduced from 700 m3/s at Aquidauana gauging station to 210 m3/s at Porto Ciriaco, while the actual discharge peak in such station is about 180 m3/s. The difference in the maximum values reached by calculated and observed discharges at Porto Ciríaco resulted in a slight difference in the shape of the correspondent hydrographs. A better agreement between river cross section profile and floodplain elevation data may possibly improve the agreement between calculated and observed hydrographs in terms of the maximum discharge value reached. Figure 4 Observed hydrograph at Aquidauana gauging Station and calculated and observed hydrographs at Porto Ciríaco. Figure 5 shows calculated exchange discharges between main channel and floodplain related to five points along Aquidauana River, which are indicated in Figure 6. Negative values mean that the main channel is loosing water to the floodplain, while a positive discharge value means that water flows from floodplain to the main channel. For example, at point P1, which is located approximately 24 km downstream from Aquidauana gauging station, occurred a maximum flow of 340 m3/s from the main channel to the floodplain. Three distinct situations may occur: (a) predominance of water flowing from main channel to the floodplain (points P1 and P5); (b) main channel receiving water from the floodplain (points P2 and P4); (c) alternating of previous situations (point P3). Hydrographs traced in Figure 5 illustrate the ability of the methodology to deal with the interaction between floodplain and main channel, being able to represent the three mentioned situations. Figure 5 Exchange discharges between floodplain and main channel against time, for five different points (which location is shown in Figure 6). During simulation, the developed modeling system traces the flooded area, as shown in Figure 6. Floodplain grid elements considered wet (water depth > 0) are blue-coloured, with darker colours indicating deeper water. In Figure 6, four simulated flooded areas are traced, related to different instants of time. This kind of model output is useful to identify and understand flow inundation patterns along the floodplain. For example, one can note the occurrence of main fluxes parallel to the river main channel, as indicated by arrows 1 and 2 in the mentioned figure. The arrow indicated by number 3 shows water flowing from floodplain of Aquidauana River and reaching the Negro River. This result is in agreement with inundation pattern observed during extreme flooding events, as reported by DNOS (1974). Although there were not available satellite images to evaluate the simulated flooded areas, the major inundation pattern of Aquidauana River was represented in a coherent way. 5 CONCLUSIONS The ability to represent the water flowing from the main channel to the floodplain at a given river cross section, forming secondary fluxes in the floodplain, and further returning to the main channel in distributed points downstream of the initial cross section is the powerful advantage of the methodology employed. Cell-based models, in turn, allow the storage of water in the floodplain only in delimited areas, and the exchange of volumes of water between floodplain and main channel occurs at few specific linkage points. Further research will focus on extending the study area to entire Pantanal Wetlands. Improvements in the computational code will be necessary in order to minimize computational costs and make such modeling feasible. Despite of good results obtained, priority will be given to acquiring satellite images aiming to better validate model results, mainly the extent of simulated flood inundation. A better characterization of floodplain topography and its agreement with the river cross sections profile will be necessary in order to calibrate model parameters and produce more actual results. Regardless of such difficulties, this research seems promising and may be valuable to management and sustainable development of Pantanal Wetlands. Figure 6 Simulated flooded area of Aquidauana River in four different instants of time. The wet floodplain elements are blue-coloured, with darker colour indicating deeper water. In background is shown a colour composite of a Landsat image. ACKNOWLEDGEMENTS The first author was supported by Conselho Nacional de Desenvolvimento Científico e Tecnológico (CNPq). Digital elevation model data were supplied by The CGIAR Consortium for Spatial Information (CGIAR-CSI) SRTM-90m Database, Landsat images were courtesy of the U. S. Geological Survey, and discharge data were provided by Agência Nacional de Águas (ANA). The authors would also like to thank Paul Bates and Neil Hunter for the valuable discussion about LISFLOOD-FP model. REFERENCES ANA (2005), HidroWeb, Sistema de Informações Hidrológicas, Agência Nacional de Águas, Available at: http://hidroweb.ana.gov.br, accessed on July 2005. ANA/GEF/PNUMA/OEA (2005), Modelo de Simulação Hidrológica do Alto Paraguai. Relatório Final, Subprojeto 5.4 – Modelo Integrado de Gerenciamento Hidrológico da Bacia do Alto Paraguai, Projeto Implementação de Práticas de Gerenciamento Integrado de Bacia Hidrográfica para o Pantanal e Bacia do Alto Paraguai. Agência Nacional de Águas, Fundo para o Meio Ambiente Mundial, Programa das Nações Unidas para o Meio Ambiente, Organização dos Estados Americanos, 554 p. Bates, P.D., De Roo, A.P. (2000), A simple raster-based model for flood inundation simulation, Journal of Hydrology, 236, 54-77. Bates, P.D., Wilson, M.D., Horritt, M.S., Mason, D.C., Holden, N., Currie, A. (2006), Reach scale floodplain inundation dynamics observed using airborne syntethic aperture radar imagery: data analysis and modelling, Journal of Hydrology, 328 (1-2), 306-318. Bates, P.D., Dawson, R.J., Hall, J.W., Horritt, M.S., Nicholls, R.J., Wicks, J., Hassan, M.A. (2005), Simplified two-dimensional numerical modelling of coastal flooding and example applications, Coastal Engineering, 52, 793-810. Bravo, J.M., Allasia, D., Collischonn, B., Collischonn, W., Villanueva, A., Tucci, C. (in press), Metodologia para a estimativa de trocas de água entre a planície e o canal principal em áreas muito planas, Revista Brasileira de Recursos Hídricos, ABRH. CGIAR-CSI (2005), Void-filled seamless SRTM data V1 - 2004, International Centre for Tropical Agriculture (CIAT), The CGIAR Consortium for Spatial Information, Available at http://srtm.csi.cgiar.org, accessed on October 2005. Chow, V.T. (1959), Open Channel Hydraulics, McGraw-Hill, USA, 680 p. Cunge, J.A., Holly, F.M., Verwey, A. (1980), Practical aspects of computational river hydraulics, Pitman Advanced Publishing Program, Boston, 420 p. DNOS (1974), Estudos hidrológicos da bacia do Alto Paraguai, Relatório Técnico, UNESCO/PNUD, Rio de Janeiro, Brazil, 284 p. Gillan, P., Jempson, M., Rogencamp, G. (2005), The importance of combined 2D/1D modelling of complex floodplain – Tatura case study, Fourth Victorian Flood Management Conference, Shepparton, Victoria, Australia. Girard, P., Da Silva, C.J., Abdo, M. (2003), River-groundwater interactions in the Brazilian Pantanal. The case of the Cuiabá River, Journal of Hydrology, 283, 57-66. Hamilton, S.K., Sippel, S.J., Melack, J.M. (2002), Comparison of inundation patterns among major South American floodplains, Journal of Geophysical Research, 107, 0. Hamilton, S.K. (1999), Potential effects of a major navigation project (Paraguay-Paraná Hidrovia) on inundation in the Pantanal Floodplains, Regulated Rivers: Research & Management, 15, 289-299. Horritt, M.S., Bates, P.D. (2002), Evaluation of 1D and 2D numerical models for predicting river flood inundation, Journal of Hydrology, 268, 87-99. Horritt, M.S., Bates, P.D. (2001a), Predicting floodplain inundation: raster-based modelling versus the finite-element approach, Hydrological Processes, 15, 825-842. Horritt, M.S., Bates, P.D. (2001b), Effects on spatial resolution on a raster based model of flood flow, Journal of Hydrology, 253, 239-249. Hunter, N.M., Horritt, M.S., Bates, P.D., Wilson, M.D., Werner, M.G. (2005), An adaptive time step solution for raster-based storage cell modelling of floodplain inundation, Advances in Water Resources, 28, 975-991. Junk, W.J., Nunes de Cunha, C. (2005), Pantanal: a large South American wetland at a crossroads, Ecological Engineering, 24, 391-401. Miguez, M.G., Mascarenhas, F.C.B. (1999), Modelação matemática de cheias urbanas através de um esquema de células de escoamento, Revista Brasileira de Recursos Hídricos, ABRH, v. 4, n.1, 119-140. Postel, S., Richter, B. (2003), Rivers for life: managing water for people and nature, Island Press, Washington, USA, 253 p. Stelling, G.S., Duinmeijer, S.P.A. (2003), A staggered conservative scheme for every Froude number in rapidly varied shallow water flows, International Journal for Numerical Methods in Fluids, 43, 1329-1354. Stelling, G.S., Verwey, A. (2005), Numerical flood simulation, in Encyclopedia of Hydrological Sciences, John Wiley & Sons Ltd. Tucci, C.E.M. (1998), Modelos Hidrológicos, Editora da UFRGS, 2ª edição, Porto Alegre, Brazil. Tucci, C.E.M. (1978), Hydraulic and Water Quality Model for a River Network, PhD Thesis, Colorado State University, USA, 218 p. Verwey, A. (2001), Latest developments in floodplain modeling – 1D/2D integration, in Proceeding of the Conference on Hydraulics in Civil Engineering, The Institution of Engineers, Australia. Villanueva, A.N.O. (1998), Simulação de áreas de inundação dinâmicas: canais compostos e wetlands, PhD Thesis, Instituto de Pesquisas Hidráulicas, Universidade Federal do Rio Grande do Sul, Porto Alegre, Brazil, 125 p. Werner, M.G. (2004), A comparison of flood extent modelling approaches through constraining uncertainties on gauge data, Hydrology and Earth System Sciences, 8(6), 1141-1152.
Baixar