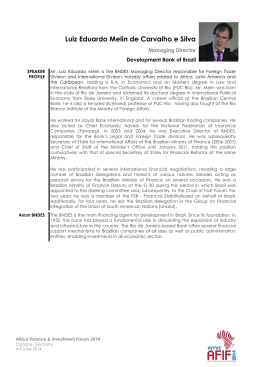
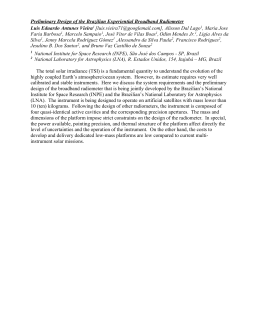
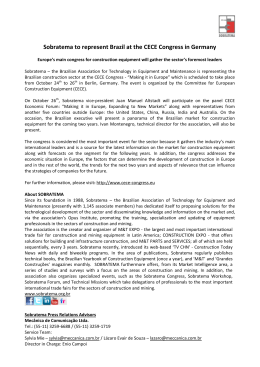
511
Brazilian Journal of Physics, vol. 39, no. 2A, August, 2009
A characterization of the scientific impact of Brazilian institutions
Aristoklis D. Anastasiadis
Electrical and Computer Engineering Department, University of Patras, Rio, Achaia 26500, Greece and
Centro Brasileiro de Pesquisas Fisicas, Rua Xavier Sigaud 150 22290-180 Rio de Janeiro Brazil
Marcelo P. de Albuquerque and Marcio P. de Albuquerque∗
Centro Brasileiro de Pesquisas Fisicas, Rua Xavier Sigaud 150 22290-180 Rio de Janeiro Brazil
(Received on 23 January, 2009)
In this paper we studied the research activity of Brazilian Institutions for all sciences and also their performance in the area of physics between 1945 and December 2008. All the data come from the Web of Science
database for this period. The analysis of the experimental data shows that, within a nonextensive thermostatistical formalism, the Tsallis q-exponential distribution N(c) can constitute a new characterization of the research
impact for Brazilian Institutions. The data examined in the present survey can successfully be fitted by applying
1
a universal curve namely, N(c) ∝ 1/[1 + (q − 1) c/T ] q−1 with q ' 4/3 for all the available citations c, T being
an “effective temperature”. The present analysis ultimately suggests that via the “effective temperature” T , we
can provide a new performance metric for the impact level of the research activity in Brazil, taking into account
the number of the publications and their citations. This new performance metric takes the “quantity” (number of
publications) and the “quality” (number of citations) for different Brazilian Institutions into account. In addition
we analyzed the research performance in Brazil to show how the scientific research activity changes with time,
for instance between 1945 to 1985, then during the period 1986-1990, 1991-1995, and so on until the present.
Finally, this work intends to show a new methodology that can be used to analyze and compare institutions
within a given country.
Keywords: Citation analysis, Nonextensive statistical mechanics, Web of science, Tsallis q-exponential distribution
1.
INTRODUCTION
The analysis of the citations of scientific papers is an important issue that can enable a better understanding of the research activity of the authors and the institutions [1, 2]. The
evaluation of the productivity of individual scientists has traditionally relied on the number of papers they have published.
It is becoming popular to use citation analysis as a bibliometric tool for the evaluation of the scientific and academic performance for individual researchers [1], journals [3, 4], universities [2, 5] even entire countries [6]. Nowadays, with the
easy access to the Internet and to large databases, including
the Web of Science [7], the comparison of the impact of scientific contributions is a much easier and more rapid process.
Research productivity is usually measured by taking two
different variables into account, namely the number of total
publications and their citations. The first measure reflects research quantity and the other reflects research impact. The
degree to which published works are cited by other authors
is generally considered as a reflection of the quality of those
works [8]. Prior citation works have analyzed a wide variety
of factors such as the distribution of citation rates [9, 11, 12].
Prior citation works have analyzed a wide variety of factors
such as the distribution of citation rates [9–12].
A stretched exponential fitting was applied to model citation distributions based on multiplicative processes [13].
Lehmann [11] attempted to fit both a power law and stretched
exponential to the citation distribution of 281 717 papers in
the SPIRES database and showed it is impossible to discriminate between the two models. Redner analyzed the ISI and
Physical Review databases [9]. In Redner’s work the ap-
∗ Corresponding
Author: [email protected]
plied fitting distribution had only partial success while the
same numerical data for large citation count c showed that
it can be fitted quite satisfactorily with a single curve by using nonextensive thermostatistical formalism [12]. Another
fitting distribution that was applied was the lognormal distribution, which was used in order to measure the research activity [14]. A recent characterization of scientific impact has
been conducted using Tsallis q-exponential distribution [6].
In that work the scientific research activity was considered in
terms of the number of publications and number of citations
using data from Thomson ISI Web of Science database [7] for
many different countries in Latin America, Europe and South
Africa. That study showed that the data for all the tested countries can be satisfactorily fitted with a single curve, which naturally emerges within the Tsallis theory [15].
In this work further study has been done for the Brazilian
scientific community. Traditionally, researchers and institutions have been evaluated by peer review, which is the main
mechanism for merit assessment for funding, appointment,
and promotion decisions. Currently, there is also a global
trend towards developing and broadening the use of bibliometric indicators to help making these decisions [16]. The
experimental data shows that each year there is an increase
in Brazilian contribution to international science (this is obtained by the total number of publications). The number of
Brazilian authors and the number of Brazilian publications in
the international scientific literature have grown substantially
during the last decades [7]. Many studies have been done to
analyze the Brazilian scientific activity further and also provide a performance metric for the Brazilian Institutions [16–
18]
This manuscript provides an analysis of the scientific citations of the Brazilians institutions and their impact within
a nonextensive thermostatistical formalism, the Tsallis q1
exponential distribution N(c), N(c) ∝ 1/[1 + (q − 1) c/T ] q−1
512
Aristoklis D. Anastasiadis et al.
with q ' 4/3 for all the available citations c, T being an “effective temperature”. Emphasis is also given on the performance of the Brazilian Institutions of Physics and Physics
departments of Brazil’s universities. The outputs of this
study could be useful for the national Brazilian agencies,
such as CAPES (Coordenadoria de Aperfeioamento de Pessoal de Nivel Superior) and other research support agencies,
which are responsible for creating and assessing programs
and projects. Finally, the “effective temperature” will be a
scientific metric for the Brazilian sciences’ growing performance and will help Brazilian agencies in the evaluation process of the research programs.
2.
NONEXTENSIVE STATISTICAL MECHANICS AND
TSALLIS q-EXPONENTIAL DISTRIBUTION
Nowadays, the idea of nonextensivity has been used in
many applications. Nonextensive statistical mechanics has
been applied successfully in physics (astrophysics, astronomy, cosmology, nonlinear dynamics) [19], biology [20],
economics [21], human and computer sciences [22–24] and
provide interesting insights into a variety of physical systems,
and among others [25]).
Nonextensive statistical mechanics is based on Tsallis entropy. Tsallis statistics [15] is currently considered useful
in describing the thermostatistical properties of nonextensive
systems; it is based on the generalized entropic form [26]:
q
Sq ≡ k
1 − ∑W
i=1 pi
q−1
(q ∈ ℜ),
(1)
where W is the total number of microscopic configurations,
whose probabilities are {pi }, and k is a conventional positive constant. When q = 1 it reproduces the BoltzmannGibbs entropic form SBG = −k ∑W
i=1 pi ln pi . The nonextensive entropy Sq achieves its extreme value at the equiprob1−q
ability pi = 1/W, ∀i, and this value equals Sq = k W 1−q−1
(S1 = SBG = k lnW ) [26, 27]. The Tsallis entropy is nonadditive in such a way that, for statistical independent systems A
and B, the entropy satisfies the following property:
Sq (A + B) Sq (A) Sq (B)
Sq (A) Sq (B)
=
+
+ (1 − q)
.
k
k
k
k
k
(2)
It is subadditive for q > 1, superadditive for q < 1, and, for
q = 1, it recovers the BG entropy, which is additive [27]. The
Boltzmann factor is generalized into a power-law. The mathematical basis for Tsallis statistics includes q-generalized expressions for the logarithm and the exponential functions
which are the q-logarithm and the q-exponential functions.
The q-exponential function, which reduces to exp(x) in the
limit q → 1, is defined as follows
1
exq ≡ [1+(1−q)x] (1−q) =
1
[1 − (q − 1)x]
1
(q−1)
(ex1 = ex ) . (3)
Its inverse is the q-logarithm function and it is equal to
(1−q)
lnq (x) ≡ x (1−q)−1 (x > 0). We shall from now on refer to
these two functions as the q-exponential and the q-logarithm
respectively. We remind that extremizing entropy Sq under
appropriate constraints we obtain a probability distribution,
which is proportional to q-exponential function.
In this work, we focus on the analysis of the distribution
of citations of scientific publications, more precisely those
that have been catalogued by the Institute for Scientific Information (ISI) for the Brazilian Institutions and for the whole
of Brazil. The proposed fitting distributions follow from the
1
nonextensive formalism as N(x) ∝ 1/[1 + (q − 1) c/T ] q−1 . In
this study we adopt the following expression:
− c−2
T
N(c) = N(2) expq
(4)
where N(2) is the number of papers with two citations, and,
as already mentioned, T plays the role of an effective temperature.
3.
THOMSON ISI WEB OF KNOWLEDGE- DATA
ACQUISITION
Traditionally, the most commonly used source of bibliometric data is Thomson ISI Web of Knowledge, in particular
the (Social) Science Citation Index and the Journal Citation
Reports (JCR), which provide the yearly Journal Impact Factors (JIF) [7]. The subject categories and terminology provided by ISI are widely recognized by many researchers and
scientometricians in their studies and are relatively simple
to use [6, 14]. The Institute for Scientific Information has
made an industry of providing citation data to libraries since
the mid-1960s; the products are currently available as part of
Thomson/ISI. Although the ISI database has a few shortcomings, overall it gives a wide coverage of most research fields
[28]. Therefore in our survey we utilize Thomson/ISI Web
of Science database to study the distribution of the citation
within a variety of countries.
To obtain all the necessary data we developed a program
which automatically downloads the ISI bibliographic information. We take all the document types into account, e.g. articles, proceeding papers, meeting abstracts, etc, for all the
available subject areas, for instance neurosciences, mathematics, chemistry etc, to select all the data for the Brazil and
then the same procedure for the Brazilian Institutions and the
departments and institutes of physics that we are interested
in.
The program is written in Delphi 7 and uses the TWebBrowser component. This component provides access to the
Web browser functionality and saves all the “html” pages.
When the page is completely downloaded, an OnDownloadComplet event is generated and we automatically go to the
next “html” page. When all pages are downloaded we process each “html” page to obtain the specific information that
we are interested in using the TPerlRegEx component from
the open source PCRE library [http://www.pcre.org/]. In this
case, we have gathered the number of citations for each publication and the total number of the published papers, for each
Institution. We applied filters to take all these data sorted by
the times they are cited, using the Citation databases namely
Science Citation Index Expanded (SCI − EXPANDED 1945–
present), Social Sciences Citation Index (SSCI 1956–present,
and Arts and humanities Citation Index (AandHCI 1975–
present). All the data were captured in December 2008.
513
Brazilian Journal of Physics, vol. 39, no. 2A, August, 2009
TABLE I: Number of total publications, and the percentage of zero,
and papers cited once for the tested Institutions
Institutions
USP
UNICAMP
UFRJ
UFPE
UFRGS
UFF
UFMG
Brazil
FIG. 1: Process to obtain best q and T (up): q is evaluated in order
to find its optimal value, and then a data fit determines the effective
temperature T .
Probability distribution for citations in Brazil (down)
4.
PRESENTATION OF RESULTS
Firstly, we are going to present the data for captured until December 2008 and then describe the procedure that we
follow to conduct the final citations fitting. All the papers included in the Web of Science and having at least one author
with at least one affiliation address in Brazil have been collected. This means that the work includes all the documents
with at least one Brazilian address with citations till December 2008. Research done by Brazilians abroad, i.e with only
foreign addresses, is disregarded in the considered database.
Note that the data and results are presented on a log-log scale.
Initially we evaluate the values of q in order to find its optimal
value, and then, with this value, we move to the final fitting
in order to determine T . The corresponding angle gives the
optimal value of the effective temperature T (Figure 1). With
these two values (q and T ) we present the fitting in a loglog diagram. In Brazil case, a remarkably good fitting can be
obtained with q = 1.339 and T = 4.0. This temperature provides good evidence on the impact of the published papers,
and enables a ranking. Figure 1 illustrates the entire process.
Next we investigate how the temperature changes during
the years. As the temperature is a characterization of the scientific impact its evolution over the years can offer a deeper
understanding of how the Brazilian research activity evolved.
Figure 2 presents the temperature for each period that we
study, for instance between 1945 to 1985, then during the period 1986-1990, 1991- 1995 and so on. This histogram high-
Total # Papers
∑∞
c=0 N(c)
66 404
24 209
21 656
6 032
5 540
5 318
1 887
285 570
# Zero citations
N(0)
(%)
24 197 (36.4%)
8 215 (33.9%)
7 498 (34.6%)
2 067 (34.3%)
2 868 (51.8%)
1 919 (36.1%)
680 (36.0%)
108 984 (38.2%)
# One citations
N(1)
(%)
7 041 ( 10.6%)
2 771 (11.5%)
2 591 (12.0%)
794 (13.2%)
695 (12.5%)
668 (12.6%)
286 (15.2%)
33 428 (11.7%)
lights how the scientific research activity changes with time.
It is remarkable how effective temperature is as a reliable performance metric for the research activity in Brazil. This part
of the analysis uses the entire available year publication window for all disciplines for papers published between 1945 to
December 2008. Note that for the last periods from 2001 to
2004 and 2005 to 2008 there has not been enough time for the
publications to become widely known to the scientific community so the number of their citations is small. Thus the
overall temperature is smaller as there is this delay. Also Figure 2 (right) illustrates the performance of Brazil in Physics
domain. 39 617 papers (8 688 zero citations, (21.9%)) have
been published in Physics until January 2009 giving T=4.44,
which characterizes the overall research performance of our
tested Brazilian society of Physics.
Note that the results for “Brazil” do not represent the average of the particular Brazilian institutions that we are considering in the Tables but all Brazilian institutions. This happens because these results are taken by placing “Brazil” in
the address field. It should also be clear that when we refer
to “Brazil Physics”, it is the average research performance
for all the Brazilian institutions in the area of physics and not
only the tested Brazilian institutes, i.e in this case we apply
the word “Brazil”, and Physics (“Fis”) in the address field to
obtain these results. Finally, in the tables II and III we study
the institutions with temperature greater or equal to the whole
Brazilian temperature, i.e T ≥ 4.0 .
Table I presents the total number of publications, and
the percentage of zero, and papers cited once for the
tested Brazilian Institutions. University of Sao Paulo (USP)
achieves the highest publication productivity with 66 404
published papers. Then University Estadual Campinas (UNICAMP) and Federal University of Rio de Janeiro (UFRJ)
have published 24 209 and 21 656 research papers respectively. The rest of the tested Brazilian Institutions attain a
significantly lower rate of published papers, i.e Federal University of Pernambuco (UFPE), Federal University of Rio
Grande do Sul (UFRGS), and Federal University of Fluminense (UFF) have published 6 032 , 5 540, and 5 318 papers
respectively. Finally, the Federal University of Minas Gerais
(UFMG) has 1 887 publications.
Next, Table II presents the Brazilian Institutions in the
ranking based on the temperature that we obtain through the
nonextensive distribution fitting. Notice that this ranking differs from the one presented in Table I, where the total amount
of the published papers (quantity ranking) is shown. The effective temperature T characterizes the scientific impact of
the tested Institutions. As we can perceive from Table II, in
514
Aristoklis D. Anastasiadis et al.
FIG. 2: Brazilian evolution of the effective temperature within the tested period (left) and the Probability distribution for citations of Brazil
in Physics (right)
almost all cases the range value of the entropic index q is
around q = 4/3. The linear regression coefficient R2 is also
indicated in each case. As we can see comparing Tables I and
II, the rankings are quite different. Let us check UFRJ, for instance. Although it has a relatively smaller number of papers
compared to UNICAMP, its effective temperature is higher
T = 4.55.
Table III presents the best fitting values of q and the effective temperature T, which characterizes the research impact
of the Brazilian Institutions with emphasis on Physics. In this
analysis UFMG was not included as the available publications in the Web of Science database [7] are few (not enough
to have a good statistical analysis). In this survey the Centro Brasileiro de Pesquisas Fisicas (CBPF) is also included
. It becomes evident from Table III that CBPF, USP and
UNICAMP achieved the highest temperature in research activity in Physics by applying the new metric (T ). It is also
worth mentioning that the Institutes/Departments of Physics
of the Universities have the responsibility of both undergraduate/graduate students and are administratively located at the
Ministry of Education, whereas CBPF has the responsibility
of only graduate students and is administratively located at
the Ministry of Science and Technology. This is possibly one
of the reasons that can help this institute to achieve a higher
temperature. Moreover it is important to mention at this point
the performance of the UFPE and UFRJ. While the UFPE significantly increases its Temperature on the domain of Physics
the UFRJ has lower T = 4.10 compared to the overall re-
search impact value (T = 4.55) in all sciences.
Figures 3 and 4 illustrate the fitting of different Brazilian
Institutions using the nonextensive distribution N(c). Figure 3 left side shows publications of all sciences and right
side demonstrates the research activity in physics domain.
As we can observe the general tendency for physics science
has a higher research impact than the overall university activity. Finally, Figure 4 presents the CBPF and UFPE fitting
curves by applying the new characterization of citations impact. CBPF achieves the highest performance with T=5.32
and q=1.336. UFPE physics domain attains T=4.76 while the
whole UFPE’s university citations impact metric is 4.08.
From all the above experimental results, we obtain a value
of q close to 4/3.
5.
CONCLUSIONS
Nowadays the number of citations is among the most
widely used measures of academic performance. Extended
study of citation distributions helps to better understand the
mechanics behind citations and can objectively establish a
comparative measure for scientific performance. Citations of
scientific papers constitute in fact a connection network consisting of authors (nodes) and directed links (citations) among
them. Recently, connection networks have been described,
studied, characterized and represented by parameters using
typical concepts in the area of Complex Systems.
515
Brazilian Journal of Physics, vol. 39, no. 2A, August, 2009
FIG. 3: Probability distribution for citations of Brazilian Institutions and their Physics departments
The entropic index q in Tsallis entropy is usually interpreted as a quantity characterizing the degree of nonextensivity of a system. An appropriate choice of the entropic index
q to nonextensive physical systems still remains an open field
of study. In some cases, the physical meaning of the index
q is unknown; it provides nevertheless new possibilities of
comparison between theoretical approaches and experimental data. Other cases are better understood, and then q has a
clear physical meaning, either at a microscopic or at a mesoscopic level, or both.
In this paper we characterize the citations impact of the
Brazilian institutions using the Tsallis q-exponential distribution. We also show how the scientific research activity
changes with time, between six periods from 1945 to 2008.
The present study provides a new performance metric based
on Nonextensive Statistical Mechanics for ranking and evaluating institutions’ research production. The proposed Tsallis
q-exponential distribution satisfactorily describes Institute of
Scientific Information citations for Brazilian institutions and
Brazilian physics departments between 1945 and December
2008.
Our study provides evidence that the citation distribution
for all tested cases within this period could be the Tsallis qexponential distribution. Our findings in this work gives an
evidence for the effectiveness of T , and the ranking that we
proposed based on the Temperature. Figure 5 illustrates the
q-logarithmic number of publications lnq [N(c)/N(1)] versus
the (c − 1) number of citations for three different Brazilian
universities (UFF, UNICAMP, USP). USP has the highest citation impact, the UNICAMP an intermediate T and UFF a
516
Aristoklis D. Anastasiadis et al.
TABLE II: Best fitting values of q and effective temperatureT. Note that tested Institutions are ranked according to T
Entropic index
Linear regression
Temperature
Institutions
q
coefficient R2
T
USP
1.339
0.99
4.75
UFRJ
1.300
0.99
4.55
UNICAMP
1.330
0.99
4.35
UFPE
1.336
0.99
4.08
UFF
1.335
0.99
4.00
Brazil
1.339
0.99
4.00
TABLE III: Best fitting values of q and effective temperatureT. Note that tested Institutions are ranked according to T
Total # Papers
# Zero citations
Entropic index
Linear regression
Temperature
N(0) (%)
q
coefficient R2
T
Physics
∑∞
c=0 N(c)
CBPF
3 680
658 (17.9%)
1.336
0.99
5.32
USP
8 781
1 776 (20.2%)
1.320
0.99
5.13
UNICAMP
3 992
809 (20.3%)
1.330
0.99
5.0
UFPE
1 685
311 (18.5%)
1.336
0.99
4.76
UFRJ
5 089
1 646 (32.3%)
1.336
0.99
4.10
UFF
1 512
309 (20.4%)
1.332
0.99
4.08
Brazil Physics
39 617
8 688 (21.9%)
1.332
0.99
4.44
temperature lower than the average. It is important to notice
that (−1/T ) corresponds to the average slope associated with
each university. It also gives an explanation for the meaning of T , and the ranking that we proposed based on the new
performance metric T .
It is remarkable how the proposed nonextensive distribution satisfactorily fits all cited papers for all the institutions.
This part of the analysis uses the entire available-year publication window for all disciplines for papers published between 1945 to December 2008. The present article also focuses on the performance of the Brazilian Institutions and
their activities in physics science. In the present study we
used a single database for the extraction of the articles, and
their number of citations. The ISI/Web of Science was chosen
because it is one of the main databases providing information
on citations. Although our strategy might have left publications out of the analysis, we believe that the sample of articles
was representative of the core international scientific production of the Brazilian Institutions. The new performance metric of citations impact is a balanced combination of “quantity”
(number of publications) and “quality” (number of citations).
These are the main factors of this performance metric. Keeping in mind that citation rate reflects the use and impact of
scientific information, not necessarily expressing quality.
This work intends to show how the new methodology can
be used to analyze and compare institutions within a given
country. A case study of certain Brazilian institutions and
their physics departments is used to investigate the effectiveness of the new characterization of citations’ impact. Future work can address other scientific fields in these important Brazilian universities or universities of other countries
and how they evolved observing the same analyzed period of
time. It is also important to study cases of universities, countries or other scientific institutions with extremely high number of zero or one citations and observe the impact of their
research activity. The extent to which this number of citations affects the proposed performance metric will be a field
of further study.
[1] J.E. Hirsch, An index to quantify an individuals scientific research output, Proc. Nat. Acad. Science, 102, 165–169 (2005).
[2] TIMES higher education World University Rankings 2008:
http://www.timeshighereducation.co.uk/
[3] P. Katerattanakul, P. Han and B. Hong, Objective quality ranking of computing journals, Communications of the ACM, 46 no
10, 111-114 (2003).
[4] A. Solari, M. Magri, A new approach to the SCI Journal Citations Reports, a system for evaluating scientific journals. Scientometrics, 47 no. 3, 605-625 (2002).
[5] D.R. Vogel, J.C. Wetherbe, MIS research: a profile of leading
journals and universities. The Database for Advances in Information Systems, 16 no. 1, 3-14 (1984).
[6] A.D. Anastasiadis, M.P de Albuquerque, M.P de Albuquerque
and D.B. Mussi, Tsallis q-exponential describes the distribution of scientific citations - A new characterization of the impact, Scientometrics (2009), DOI 10.1007/s11192-009-0023-0
[7] ISI Web of Knowledge, http://portal.isiknowledge.com
[8] T.J. Phelan, A compendium of issues for citation analysis., Scientometrics, 45 no. 1, 117-136 (1999).
Acknowledgements The authors thank Professor C.Tsallis
for helpful discussions, D. B. Mussi for the program development, the support from the National Council for Scientific and
Technological Development (CNPq) of the Brazilian Ministry
of Science and Technology, the State of Rio de Janeiro Research Foundation (FAPERJ) and the Brazilian Coordination
Office for the Improvement of Staff with Higher Education
(CAPES).
517
Brazilian Journal of Physics, vol. 39, no. 2A, August, 2009
FIG. 4: Probability distribution for citations of CBPF (left) and UFPE (right) up to January 2009
[13]
[14]
[15]
[16]
FIG. 5: lnq [N(c)/N(1)] versus (c − 1) for 3 Brazilian Universities
(UFF, UNICAMP, USP). The figure is a zoom with an upper limit of
100 citations.
[17]
[18]
[9] S. Redner, How popular is your paper? An empirical study of
the citation distribution, Eur. Phys. J. B, bf 4, 131–134 (1998).
[10] S. Picoli Jr., R. S. Mendes, L. C. Malacarne and E. K. Lenzi,
Scaling behavior in the dynamics of citations to scientific journals, Europhysics Letters, 75, 673 (2006)
[11] S. Lehmann, B. Lautrup and A. D. Jackson, Citation networks
in high energy physics. Physical Review E (Statistical, Nonlinear, and Soft Matter Physics) 68 (2) (2003).
[12] C. Tsallis and M.P. de Albuquerque, Are citations of scientific
[19]
[20]
papers a case of nonextensivity?, Eur. Phys. J. B, 13, 777–780
(2000).
J. Laherrere and D. Sornette, Stretched exponential distributions in nature and economy: “fat tails” with characteristic
scales. The European Physical Journal B - Condensed Matter,
2(4), pp. 525-539 (1998).
F. Radicchi, S. Fortunato and C. Castellano, Universality of citation distributions: towards an objective measure of scientific
impact, Proc. Natl. Acad. Sci. USA 105, 17268–17272 (2008)
C. Tsallis, Nonextensive Statistics: Theoretical, Experimental and Computational Evidences and Connections, Brazilian
Journal of Physics, 29 (1) (1999)
M.P. da Luz, C.M. Portella, M. Mendlowicz, S. Gleiser, E.S.F
Coutinho and I. Figueira, Institutional h-index: The performance of a new metric in the evaluation of Brazilian Psychiatric Post-graduation Programs, Scientometrics, 77 (2), 361–
368 (2008).
R. Meneghini, Abel L. Packer, L.N. Calo, Articles by Latin
American Authors in Prestigious Journals Have Fewer Citations, Plos one (2008)
R. Mugnaini, A.L. Packer and R. Meneghini, Comparison of
scientists of the Brazilian Academy of Sciences and of the National Academy of Sciences of the USA on the basis of the
h-index, Brazilian Journal of Medical and Biological Research
41, 258–262 (2008)
H. Shibata, Statistics of phase turbulence II, Physica A: Statistical Mechanics and its Applications, 317 (3–4), 391–400
(2003).
A. Upadhyaya, J. Rieu, J.A. Glazier and Y. Sawada, Anomalous diffusion and non-Gaussian velocity distribution of Hydra
cells in cellular aggregates, Physica A: Statistical Mechanics
518
and its Applications, 293, (3–4), 549-558 (2001)
[21] C. Tsallis, C. Anteneodo, L. Borland, and R. Osorio, Nonextensive statistical mechanics and economics, Physica A: Statistical
Mechanics and its Applications, 324 (1–2), 89–100 (2003).
[22] A.D. Anastasiadis and G.D. Magoulas, Nonextensive statistical mechanics for hybrid learning of neural networks, Physica
A: Statistical Mechanics and its Applications, 344, 372–382
(2004).
[23] A.D. Anastasiadis and G.D. Magoulas, Evolving stochastic
learning algorithm based on Tsallis entropic index, The European Physical Journal B, 50, 277-283 (2006).
[24] A.C. Tsallis, C. Tsallis, A.C.N. Magalhaes and F.A. Tamarit,
Aristoklis D. Anastasiadis et al.
[25]
[26]
[27]
[28]
Human and Computer Learning: An Experimental Study,
Complexus, 1, 181 (2003).
An
updated
Bibliography
is
available
at
http://tsallis.cat.cbpf.br/biblio.htm, (2008).
C. Tsallis, Possible Generalization of Boltzmann-Gibbs Statistics. J. Stat. Phys., 52, pp. 479–487 (1988).
M. Gell-Mann and C. Tsallis, eds., Nonextensive Entropy–
Interdisciplinary Applications, Oxford University Press, New
York, 2004.
R.M. May, The scientific wealth of nations. Science, 275, 793–
795 (1997).
Download