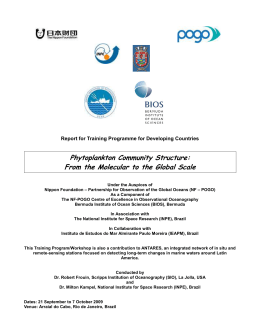
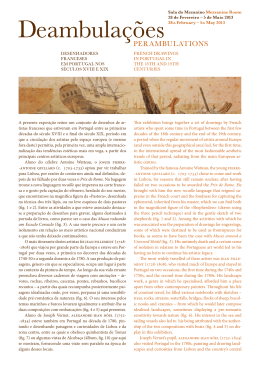
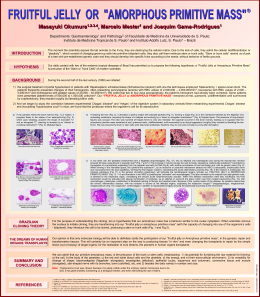
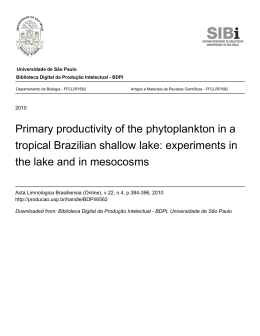
Journal of Marine Systems 59 (2006) 173 – 188
www.elsevier.com/locate/jmarsys
Factors controlling the summer Emiliania huxleyi bloom
in the Black Sea: A modeling study
Temel Oguz a,*, Agostino Merico b
a
Institute of Marine Sciences, Middle East Technical University, PO Box 28, Erdemli 33731, Turkey
b
School of Ocean and Earth Science, Southampton Oceanography Center, Southampton, UK
Received 21 February 2005; accepted 9 August 2005
Available online 20 December 2005
Abstract
A one-dimensional coupled physical–ecosystem model identifies factors causing blooms of the coccolithophore Emilania
huxleyi in the Black Sea, regularly observed during the early summer periods. The model specifically applies for a more idealized
ecosystem of the interior basin, away from the coastal zone. It is represented in the form of four groups of phytoplankton (diatoms,
dinoflagellates, E. huxleyi, a small phytoplankton group), and two groups of zooplankton further accompanied by simplified
nitrogen and phosphorus cycles. The simulations show that the internal trophodynamic conditions in the Black Sea support E.
huxleyi bloom development during May–July period as a part of the seasonal phytoplankton succession. They start flourishing after
the diatom and dinoflagellate blooms under nitrogen depleted and moderate light conditions. They make use of regenerated
nutrients available in the surface mixed layer and grow concomitantly with picophytoplankton community in the subsurface levels.
D 2005 Elsevier B.V. All rights reserved.
Keywords: Black Sea; Ecosystem; Emiliania huxleyi blooms; Modeling; Phytoplankton
1. Introduction
The classical seasonal phytoplankton dynamics in
the Black Sea consists of a strong diatom and dinoflagellate-dominated spring production, followed by a
weaker mixed assemblage of community development
below the seasonal thermocline during summer months
and a surface-intensified autumn production (Moncheva and Krastev, 1997; Mikaelyan, 1997; Eker et
al., 1999; Eker-Develi and Kideys, 2003; Sorokin,
2002; Soydemir et al., 2003). This annual phytoplankton community structure is further accompanied with E.
huxleyi population during the late spring and summer
* Corresponding author.
E-mail address: [email protected] (T. Oguz).
0924-7963/$ - see front matter D 2005 Elsevier B.V. All rights reserved.
doi:10.1016/j.jmarsys.2005.08.002
months within the shallow surface mixed layer, as
documented by the in situ and sediment trap measurements (Benli, 1987; Hay and Honjo, 1989; Mankovsky
et al., 1996; Uysal et al., 1998; Eker et al., 1999, EkerDeveli and Kideys, 2003), as well as remote-sensing
observations (Sur et al., 1994; Cokacar et al., 2001,
2004; Cokacar, 2005).
The percent areal coccolith coverages deduced
from the weekly SeaWiFS normalized water-leaving
radiance data for the 1997–2002 period (Cokacar et
al., 2004) indicate that coccoliths emerge typically
during mid-May, reach the strongest phase with almost basinwide coverage throughout June, and finally
disappear by mid-July (Fig. 1). Even though the
Black Sea early summer coccolithophore blooms are
weaker than their counterparts in other regions of the
world oceans, nevertheless they are one of the most
174
T. Oguz, A. Merico / Journal of Marine Systems 59 (2006) 173–188
Fig. 1. Time series of areal coccolith coverage as a percentage of the total area of the basin obtained by the sum of pixels satisfying coccolithophore
bloom conditions (after Cokacar et al., 2004). The gray-shaded zones represent the May–July period in which coccolithophore blooms occur in the
Black Sea. This plot is based on the analysis of the weekly (8-day) and monthly, 9 km resolution normalized water leaving radiance SeaWiFS Level
3 data provided by the NASA-Distributed Active Archive Center (DAAC).
persistent and robust feature of the annual phytoplankton structure of the Black Sea ecosystem. The
SeaWiFS observations shown in Fig. 1 suggest their
almost basinwide coverage in 5 years out of a total of
6 years of data comprising the 1997–2002 period. An
indication of similar persistent structure of the earlysummer coccolithophore blooms has also been provided by the analysis of the 20 year-long (1983–
2002) AVHRR time series data (Cokacar, 2005). An
indirect evidence of the Black Sea E. huxleyi bloom
developments has been given by enhanced methanesulfonic acid (MSA) concentrations measured at two
coastal stations located along the Mediterranean coast
of Turkey and the island Crete (Kubilay et al., 2002).
Timing of these local high MSA concentrations apparently coincided with the summer Black Sea E.
huxleyi blooms, known to be major dimethyl sulfide
(DMS) releaser to the atmosphere, and its transport
towards the Aegean–Eastern Mediterranean Sea region by persistent low level northerly winds.
In spite of their global scale impacts due to release
of high rate of DMS and contribution to pCO2 increase through production of CaCO3 coccoliths,
bloom dynamics of coccolithophores in general and
of E. huxleyi in particular have received limited attention in biological models. Aknes et al. (1994)
provided a simple, process-oriented model designed
to interpret a set of mesocosm experiments. Tyrrell
and Taylor (1996) explored factors leading to meridional variations of E. huxleyi population in the northeast Atlantic. Merico et al. (2004) investigated the
causes of E. huxleyi blooms recently observed in
the Bering Sea shelf. Iglesias-Redriguez et al. (2002)
inferred spatio-temporal characteristics of coccolithophore blooms in the world oceans diagnostically using
SeaWiFS data.
None of the ecosystem models of differing complexity developed so far for the Black Sea (Lebedeva
and Shushkina, 1994; Oguz et al., 1996, 1999, 2001;
Gregoire et al., 1998, 2004; Lancelot et al., 2002)
has included coccolithophores as an independent
group in spite of their fairly complex food web
representations. The present work extends an existing
intermediate-complexity ecosystem model (Oguz et
al., 1999) to include coccolithophores as a part of
the Black Sea phytoplankton community structure.
The first objective of this study is thus to provide
quantitative support for E. huxleyi blooms in the
Black Sea as a part of the seasonal phytoplankton
species succession in response to the basin’s internal
trophodynamic conditions. The second objective is to
examine sensitivity of these blooms to various environmental factors and to identify major processes
controlling their development. The present model
also provides a general framework for the implementation of coccolithophore dynamics in ocean carbon
cycle models, whose more systematic treatment is
timely and demanding.
2. Model description
2.1. General model structure
The model involves simultaneous solutions of a set
of one-dimensional equations for the physical and
ecosystem modules representing the areal-averaged
conditions of the interior deep part (N 1500 m
depth) of the Black Sea, away from the shelf and
topographic slope zone around the basin. The vertical
domain of the model extends from the surface down
to 150 m, which roughly corresponds to the lower
boundary of the permanent pycnocline separating the
less saline and biologically active upper layer from
more dense and biologically inert, anoxic layer. The
vertical structure is resolved by 50 vertical levels,
which provide a grid spacing of ~3 m to accommo-
T. Oguz, A. Merico / Journal of Marine Systems 59 (2006) 173–188
date strong vertical gradients of the physical and
biogeochemical structures.
The physical model, described previously by Oguz
et al. (1996, 1999), computes the yearly evolution of
the flow and stratification characteristics under given
climatological monthly-mean wind stress, heat and
fresh water fluxes prescribed at the surface by solving
two components of the horizontal momentum and temperature, salinity equations. This knowledge of the flow
system is then used to compute the vertical turbulent
mixing coefficient by means of the 2.5 level Mellor–
Yamada turbulent closure scheme. Thus, the vertical
structures of temperature and vertical diffusion coefficient used are provided to the ecosystem model prognostically at each time step by the physical model. For
their model simulated annual structures, we refer to Fig.
6a, b in Oguz et al. (1999).
The ecosystem model is an extended version of
the seven compartment (two phytoplankton, two zooplankton, detritus, ammonium and nitrate) model of
Oguz et al. (1999). The new model includes members
of the three most dominant phytoplankton taxonomic
groups observed in the Black Sea comprising Bacillariophyta (diatoms, P d), Dinophyta (dinoflagellate,
P f) and Chrysophyta (coccolithophore E. huxleyi,
P e). Phytoflagellates and picophytoplankton constitute
the smallest members of the observed community
structure. They are included as the fourth phytoplankton compartment into the model as the small size (b5
Am) phytoplankton group ( P s ), hereinafter also referred to as the picophytoplankton group. The zoo-
175
plankton community is simply represented by
microzooplankton Z s (b 50 Am), and mesozooplankton Z l (N 50 Am) groups. They consume different
phytoplankton groups with different preferences, as
specified in grazing terms.
All plankton biomass are expressed in nitrogen
units; nitrogen is considered to be the most important
limiting nutrient for the interior Black Sea ecosystem
with respect to silicate and phosphate. The data collected from field measurements in various parts of the
interior Black Sea during the 1990s indicate N : P
ratio typically less than 8 (Fig. 2a). This implies preferential growth of E. huxleyi in the Black Sea under
nitrogen limited conditions, as in the case of the Bering
Sea (Tyrrell and Merico, 2004). The model, however,
includes a simplified phosphorus cycle in order to
explore competitiveness of E. huxleyi blooms under
phosphorus limitation as suggested by Reigman et al.
(1992), Egge and Heimdal (1994), Tyrrell and Taylor
(1996). The data shown in Fig. 2b suggest relative
silicate abundance with respect to nitrogen. The Si : N
ratio reveals values greater than 5, which are considerably higher than the Si : N values of 1-to-3 reported in
the literature for various silicate-limited ecosystems.
Thus, silicate does not limit diatom growth in the
Black Sea.
The simplified nitrogen and phosphorus cycles involve labile pelagic detrital nitrogen (D n) and detrital
phosphorus (D p), as well as dissolved inorganic nitrate
(N n), ammonium (N a), and phosphate (N p). Attached
and detached coccolith concentrations constitute two
Fig. 2. Vertical profiles of (a) dissolved inorganic nitrate to phosphate (DIN/PO4), and (b) silicate to nitrate (Si/DIN) at four stations representative
of the interior basin characteristics of the Black Sea. Triangles show measurements at 42815V N, 29815V E during 18 March 1995 (western gyre);
squares at 41858V N, 29856V E during 28 May 2001 (western gyre); solid circles at 42845V N, 36845V E during 03 October 1999 (central basin); stars
at 42830V N, 37845V E during 22 April 1998 (eastern gyre). The profiles shown here are chosen from the R.V Bilim measurements archived at the
Middle East Technical University, Institute of Marine Sciences data base (after Oguz, 2005).
176
T. Oguz, A. Merico / Journal of Marine Systems 59 (2006) 173–188
additional prognostic variables. The ecosystem model
thus comprises a total of 13 state variables.
Oxygen cycling and redox processes across the
suboxic–anoxic interface, incorporated previously by
Oguz et al. (2000), are excluded here in order to
reduce the model complexity as they are not the
primary concern of the E. Huxleyi bloom dynamics.
Similarly, gelatinous carnivores and microbial loop
have not been included in the present model since
E. huxleyi are not tightly coupled with them in terms
of prey–predator interactions. These features of the
Black Sea ecosystem have been studied in some
details by Oguz et al. (2001). The model, which is
specifically applied here for the Black Sea food web
configuration, should be fairly representative for other
temperate basin ecosystems with some modifications.
The governing equations of the model are provided in
Appendix A.
2.2. Boundary conditions
Due to the presence of the suboxic and anoxic
layers below the oxygenated and biologically productive surface layer, the Black Sea vertical biogeochemical structure differs from that of other oxygenated
seas. The distinction comes from diminishing oxygen
and nitrate concentrations immediately below the biologically active surface layer of about 50 m. The
suboxic layer is characterized by low oxygen concentration of less than 10 AM and rapid decrease of
nitrate concentrations from the peak values of 6–
8 AM at its upper boundary at around 75 m to zero
at the suboxic–anoxic boundary, which is typically
located at depths around 100–125 m for the cyclonic
interior basin where the present model is applied. The
rapid depletion of oxygen and nitrate in this transitional layer occurs due to consumption of first oxygen
and then nitrate during oxidation of detrital material
before they are lost to the deep anoxic pool (Murray et
al., 1995; Kuypers et al., 2003). The anoxic layer
further below, therefore, does not contain any dissolved inorganic nitrate.
Sediment trap observations (e.g. Lebedeva and Vostokov, 1984; Karl and Knauer, 1991) suggest intense
remineralization of organic material before reaching the
anoxic layer. It has been shown that about 90% of
detrital material is remineralized within approximately
the upper 100 m. The remainder is lost to the deep. In
reality, this loss is compensated from coastal sites.
However, prescription of lateral fluxes is not a straightforward issue in one dimensional vertical models. In
the present model, this difficulty is avoided by allow-
ing complete remineralization of the settling particles
within the upper layer water column by the choice of
relatively low detrital settling speed of 6.0 m d 1 and
fast remineralization rate of 0.1 d 1. Because
the
P
ecological model is fully conservative (i.e.
Rð F Þ ¼
0 in our model; see Appendix), the complete remineralization avoids dealing with specification of any nitrate-based input flux to compensate export flux of
detrital material at the bottom boundary. As a result,
diatom, detrital nitrogen and phosphorus equations are
complemented by the absence of sinking fluxes at both
the surface and bottom boundaries. Moreover, all turbulent diffusive fluxes are also set to zero at these
boundaries.
2.3. Initial conditions, numerical procedure and
parameters setting
The ecosystem model is initialized by an idealized
vertically uniform nitrate and phosphate profiles. Nitrate and phosphate concentration are set to 4 mmol N
m 3 and 0.25 mmol P m 3 within the upper 100 m
layer, respectively. Further below down to the lower
boundary of the model, values of zero and 0.5 mmol P
m 3 are chosen, respectively. Other state variables are
initialized with small constant values to allow positive
growth and utilization. Once the model equations are
integrated ahead in time, the internal dynamics (i.e.
plankton productivity, nitrogen cycling, and vertical
mixing) gradually establish realistic structures of all
state variables, after a few years of transient adjustment.
The final, equilibrium solution then develops merely on
the basis of internal trophodynamic structure of the
model.
The second order Leapfrog time difference and centered space difference are used to discretize the set of
equations governing the physical and ecosystem models. The vertical differencing is implicit to avoid computational instabilities generated by the use of small
grid spacing of 3 m. The separation of solutions associated with the Leapfrog time differencing is avoided
by applying a time filter to the solutions at each time
step. A time step of 10 min is used in the numerical
integration of the system of equations. First, the physical model is integrated independently for five years to
achieve a yearly cycle of the upper layer physical
structure. Using the results of the fifth year cycle of
the physical model, the ecosystem model is then integrated for another five years. The transient adjustment
of the ecosystem model is completed by the end of the
second year, and all solutions attain their steady-state
forms within the fourth year of integration. The analysis
T. Oguz, A. Merico / Journal of Marine Systems 59 (2006) 173–188
177
Table 1
Definition of parameters and their values used for phytoplankton groups
Definition
Diatom
Dinoflag.
E. huxleyi
Small Phyto.
Initial slope of the PI curve (m2 W 1)
Maximum phytoplankton growth rate (d 1)
Q 10 parameter for temperature limitation
Phytoplankton Mortality rate (d 1)
Half saturation constant for nitrate uptake (mmol N m 3)
Half saturation constant for ammonium uptake (mmol N m 3)
Half saturation constant for phosphate uptake (mmol P m 3)
Food preference coefficient of mesozooplankton
Food preference coefficient of microzooplankton
a d = 0.01
g d = 2.9
Q d = 1.5
k d = 0.06
K nd = 0.5
K ad = 0.2
K pd = 0.05
b ld = 0.6
b sd = 0.2
a f = 0.01
g f = 1.3
Q f = 1.5
k f = 0.06
K nf = 0.23
K af = 0.2
K pf = 0.05
b lf = 0.3
b sf = 0.0
a e = 0.005
g e = 2.2
Q e = 1.5
k e = 0.06
K ne = 0.38
K ae = 0.1
K pe = 0.005
b le = 0.05
b se = 0.6
a p = 0.01
g s = 1.65
Q s = 1.5
k s = 0.06
K ns = 0.3
K as = 0.2
K ps = 0.05
b ls = 0.15
b ss = 0.2
of the results presented in the subsequent sections is
based on the fifth year of integration of the ecosystem
model.
The parameter values are chosen from the published Black Sea literature, mostly from our previous
models (Oguz et al., 1996, 1999, 2001), and are given
in Tables 1–3. Those for coccolithophores, which were
not available locally, are taken from model studies for
other seas with similar pelagic ecosystem characteristics (e.g., Aknes et al., 1994; Tyrrell and Taylor, 1996;
Merico et al., 2004). As suggested by Hulburt (1990),
growth rate of E. huxleyi is greater than other small
phytoplankton groups (such as flagellates), and comparable to diatoms. Thus, following the previous studies, the model specifies a maximum growth rate of 2.2
d 1 for E. huxleyi, which is in between that of 2.9
d 1 for diatoms and 1.65 d 1 for small phytoplankton
group. Dinoflagellates attain the smallest maximum
growth rate of 1.3 d 1. We note that these maximum
growth rates are subject to further reduction by Q 10
factor at temperatures lower than 20 8C. Half-saturation constants for nitrate uptake are taken proportional
to the growth rates of phytoplankton groups as in
Aknes et al. (1994). This specification provides a
competitive advantage to E. huxleyi population with
respect to small phytoplankton group. Similar competitive advantage is also assigned for ammonium and
phosphorus uptakes by choosing its half saturation
constants as 0.1 mmol N m 3 and 0.005 mmol P
Table 2
Definition of parameters and their values used for zooplankton groups
Definition
1
Maximum zooplankton grazing rate (d )
Zooplankton mortality rate (d 1)
Zooplankton excretion rate (d 1)
Assimilation efficiencies
Half saturation constant for
zooplankton grazing (mmol N m 3)
Q 10 parameter for temperature limitation
Mesozoo
Microzoo
g l = 1.2
k 1 = 0.04
l l = 0.07
d l = 0.75
K l = 0.7
g s = 2.0
k s = 0.04
l s = 0.07
d s = 0.75
K s = 0.7
Q d = 2.0
Q d = 2.0
m 3, respectively; the corresponding values for the
other groups are 0.2 mmol N m 3 and 0.05 mmol P
m 3. Another distinguishing feature of E. huxleyi
population is their relative disadvantage of growth at
low light levels, and advantage at high light levels as
compared to all other phytoplankton groups. This
characteristic feature of E. huxleyi is specified in the
model by assigning a relatively lower value (0.005 m2
W 1) for the initial slope of the PI curve with respect
to the other groups (0.01 m2 W 1).
Table 3
Definition of some parameters and their values
Definition
Light exctinction coefficient for PAR in
pure water (m 1)
Self-shading coefficient due to phytoplankton
(m 1 mmol N m 3)
Self-shading coefficient due to
detritus, coccoliths (m 1 mmol N m 3)
Ammonium inhibition parameter for nitrate
uptake (mmol N m 3) 1
Nitrification rate (d 1)
Remineralization rate for particulate
nitrogen (d 1)
Remineralization rate for particulate phosphate
(d 1)
Phosphorus to nitrogen ratio
Diatom sinking rate (m d 1)
Detritus sinking rate (m d 1)
Food preference coef. of mesozooplankton
on microzooplankton
Food preference coefficient of mesozooplankton
on detritus
Food preference coefficient of microzooplankton
on detritus
Maximum calcification rate (d 1)
Carbon to Nitrogen ratio (mg C/mmol N)
Dissolution rate of calcite of detached
coccoliths (d 1)
Minimum detachment rate of coccoliths (d 1)
Maximum detachment rate of coccoliths (d 1)
Maximum number of excess coccoliths
(mg calcite C/mg org. C)
k w = 0.07
k p = 0.05
k c = 0.05
u = 3.0
X a = 0.1
e n = 0.1
e p = 0.1
r PN = 1 / 10
W p = 1.0
W d = 6.0
b ls = 0.2
b ldet = 0.5
b sdet = 1.0
C max = 2.0
r CN = 12 * 6.625
h = 0.05
C d,min = 0.1
C d = 10.0
P max = 0.75
178
T. Oguz, A. Merico / Journal of Marine Systems 59 (2006) 173–188
3. Results and discussion
The strategy adopted here to study the Black Sea E.
huxleyi bloom dynamics is to first describe in detail a
typical observed situation, the so-called the bControl
RunQ simulation, which reproduces major observed
features of the annual plankton and nutrient cycles
using the optimum parameters list provided in Tables
1–3. The next step is to examine most critical processes
in the development of summer coccolithophore blooms
by assigning different values for some parameters.
3.1. Annual plankton cycles and community structure:
the bControl RunQ
The annual distributions of nutrients (phosphate,
nitrate, and ammonium) in the water column (Fig. 3)
show an intrusion into the euphotic layer in winter
months due to strong wind and a buoyancy (cooling)induced convective overturning (see Oguz et al., 1999
for details of the winter mixing process). Nutrients, in
fact, start building up in gradually deepening mixed
layer by the beginning of the cold season in November.
By mid-February, phosphate and nitrate concentrations
within approximately 50 m deep winter surface mixed
layer reach 0.25 and 2.5 AM, respectively. Ammonium
concentration, on the other hand, remains at its background level of about 0.05 AM, implying that biological production and subsequent remineralization–
nitrification cycle are not yet effective in the ecosystem
during this biologically inactive phase of the annual
cycle due to strong temperature and light limitations.
By the beginning of March cooling stops gradually, and
the mixed layer becomes warmer and shallower. The
sharp changes in temperature and vertical mixing during this period have already been shown in Fig. 6 of
Oguz et al. (1999). Penetration of more photosynthetically available radiation into the deeper levels of the
water column during this period is evident by the light
limitation function (Fig. 4).
Fig. 3. The model derived annual distributions of (a) phosphate, (b) nitrate and (c) ammonium concentrations (in AM) in the upper part of water
column during the perpetual year of the Control Run. The contour interval is 0.02 AM for phosphate, 0.4 AM for nitrate and 0.05 AM for ammonium.
T. Oguz, A. Merico / Journal of Marine Systems 59 (2006) 173–188
179
Fig. 4. Annual distribution of the light limitation function computed by Eq. (6) using the value of 0.1 for slope of the PI curve.
Both phosphate and nitrate concentrations undergo
sharp reductions within the upper 20 m layer in the
subsequent ~10 days. This period corresponds to the
classical strong new production-based diatom bloom
(Fig. 5a), which is preferentially confined to the
upper 20 m layer reflecting strong light limitation fur-
Fig. 5. The model derived annual distributions of (a) diatom, (b) dinoflagellate, (c) small phytoplankton, and (d) E. huxleyi biomass (mg C m 3)
during the perpetual year of the control run. The contour interval is 10 mg C m 3 for all plots.
180
T. Oguz, A. Merico / Journal of Marine Systems 59 (2006) 173–188
ther below (Fig. 4). The bloom however extends partially up to the base of the euphotic zone, around 50 m
at the initial phase of the bloom when the deep convective overturning mechanism is still active. The diatom biomass within the surface mixed layer reaches 100
mg C m 3 (assuming 1 mmol N equals to 12 * 6.625
mg C) while the biomass in subsurface levels is around
30 mg C m 3.
The maximum phytoplankton growth rates provided
in Table 1 apply for temperature at 20 8C and higher.
They are therefore expected to reduce to a certain extent
during the colder autumn and spring months in the
surface mixed layer as well as within the cold intermediate layer (the remnant of the convectively formed
winter mixed layer with T b 8 8C) in summer months.
According to the Q 10 formulation used, the maximum
diatom growth rate of 2.9 d 1 was reduced by about
40% to 1.7 d 1 during the early March at colder water
temperatures. As one of the fastest growing phytoplankton groups in the model with the temperaturecontrolled maximum growth rate of about 0.9 d 1,
picophytoplankton group also contributes to the
March bloom event with the maximum biomass of 60
mg C m 3 (Fig. 5c). Picophytoplankton group outcompetes coccolithophores since the latter group has
more strongly limited by solar radiation during this
particular period of the year.
The majority of nutrients residing below the layer of
surface-intensified diatom bloom were generally unused due to lack of sufficient photosynthetically available radiation during the early spring period (Fig. 4).
Those used are recycled back following the biological
pump as indicated by gradual increase of subsurface
ammonium and nitrate concentrations up to ~0.3 and
~1.8 AM, respectively, during March–April (Fig. 3c).
On the other hand, both phosphate and nitrate concentrations recycled within the surface mixed layer following the completion of diatom bloom are immediately
consumed by the dinoflagellate community. Being diatoms and small phytoplankton community subject to
zooplankton grazing and coccolithophore growth still
subject to strong light limitation, dinoflagellates with
temperature-controlled maximum growth rate of about
0.6 day 1 attain maximum biomass of 90 mg C m 3
within the mixed layer during the first half of April
(Fig. 5b). In May, the core of the dinoflagellate bloom
shifts below the seasonal thermocline, where more
nutrients are available and light conditions are now
more tolerant for their growth as compared to the
previous month (Fig. 4). By the end of May, the subsurface dinoflagellate bloom is replaced by gradually
increasing picophytoplankton production. Their bio-
mass reaches ~40 mg C m 3 below the thermocline
at depths of 20–30 m in August and September (Fig.
5c). Further below, the strong light limitation prevents
any phytoplankton activity. The small phytoplankton
group also dominates the autumn community within the
surface mixed layer in November, which then declines
in December when the light limitation imposes, once
again, a strong constraint on their growth.
The E. huxleyi population starts growing immediately after depletion of the dinoflagellate bloom in the
surface mixed layer (Fig. 5d) by using the ammonium
resources made available after the dinoflagellate
bloom. Confined within the upper 20 m layer of
most favorable light and temperature conditions for
their growth, it reaches its highest intensity in the
second half of May–early June (50 mg C m 3),
then declines gradually in July and August. Because
E. huxleyi bloom occurs at water temperatures greater
than 20 8C, temperature limitation of its maximum
growth rate is insignificant during the blooms (Fig. 4).
The phosphorus limitation function is greater than 0.9
as compared to the nitrogen limitation function of
around 0.2 during E. huxleyi growth in May–August
(not shown). The nitrogen limitation thus imposes
more severe constraint for the growth of E. huxleyi
population in the Black Sea.
3.2. Comparison with observations
A partial support for the species succession predicted by the model is provided by six set of observations performed during March 1998, April 1995,
May–June 2001, July 1996, September 1998, October
1995 within interior waters of the southern Black Sea
(Eker-Develi and Kideys, 2003) as well as May–July
1992 measurements performed within the northern
sector of the Black Sea (Mankovsky et al., 1996).
Diatoms were found to contribute to 97% of total
phytoplankton biomass during March 1998 observations, whereas dinoflagellates constituted its 83% during April 1995. The May–July 1992 sampling
indicated dense coccolithophore blooms up to 6 million cells per liter during the late-May and early-June
with decreasing cell counts towards July. The lack of
coccolithophore bloom inferred by the satellite data
during May–June 2001 (Cokacar, 2005) was also
supported by in situ measurements suggesting dinoflagellate-dominated system. A similar sequence of phytoplankton species succession during the spring and
summer months has been reported for the western
coastal waters (Moncheva and Krastev, 1997). Contrary to the domination of small phytoplankton in the
T. Oguz, A. Merico / Journal of Marine Systems 59 (2006) 173–188
model simulations, the observed phytoplankton species composition during the summer and autumn
months is mainly formed by the combination of dinoflagellates and diatoms with some additional contributions from E. huxleyi and flagellates.
Assuming the C : Chl ratio of 50, and C : N ratio of
12 * 6.625 mg C/mmol N, the sum of diatom, dinoflagellate and picophytoplankton annual biomass distribution (expressed in terms of chlorophyll concentration)
in Fig. 6a resembles very closely the observed monthly
composite chlorophyll distribution shown in Fig. 6b
from Vedernikov and Demidov (1997). Concentrations
of more than 2 mg m 3 distributed uniformly over
40–50 m thick euphotic zone during the late winter–
early spring period, ~1.0 mg m 3 within the surface
mixed layer of 25–30 m during autumn months, and
181
0.3–1.0 mg m 3 below the seasonal thermocline during
summer months are reproduced satisfactorily by the
model.
Fig. 6a also includes E. huxleyi biomass distribution
(in chlorophyll units as well), where the timing of most
dense biomass agrees well with the observations (see
Fig. 1) obtained by the analysis of six year-long (1997–
2002) satellite data. Because of low chlorophyll content
of E. huxleyi cells, contrary to the case of diatoms and
dinoflagellates, the summer E. huxleyi bloom signature
can not however be traced in Fig. 6b. An indirect
support for the E. huxleyi biomass distribution may
be provided by comparing the computed and observed
coccolith concentrations. The model estimate of 150
mg C m 3 total (the sum of attached and detached)
coccolith concentrations (Fig. 7) lies within 100-to-200
Fig. 6. (a) The annual distributions of (a) the sum of model computed diatom, dinoflagellate and small phytoplankton (continuous lines) and of E.
huxleyi (broken lines) expressed in terms of chlorophyll concentration (mg Chl m 3) with the contour interval is 0.2, and (b) monthly variations of
observed chlorophyll concentration distribution (mg m 3) within the upper 100 m of the water column for the interior basin of the Black Sea. It is
reproduced from Fig. 5 of Vedernikov and Demidov (1997), and based on the monthly averaged data from 16 cruises performed during the 1978–
1992 period.
182
T. Oguz, A. Merico / Journal of Marine Systems 59 (2006) 173–188
Fig. 7. Annual distributions of the total (the sum of attached and
detached) coccolith concentrations (mg C m 3). The contour interval
is 20 mg C m 3.
mg C m 3 range estimated by the satellite data in our
companion paper by Cokacar et al. (2004). The maximum E. huxleyi biomass values of about 50–60 mg C
m 3 computed in our simulations therefore seem to be
reasonable.
3.3. Critical processes controlling E. huxleyi growth
Numerous field studies, especially in different parts
of the North Atlantic Ocean, showed bloom occurrence
of E. huxleyi in highly stratified and nutrient depleted
waters within shallow mixed layer of ~30 m or less in
the early summer following the decline of the spring
bloom event (e.g., Head et al., 1998; Iglesias-Rodriguez
et al., 2002). This is also the case observed in the Black
Sea, and our model simulations presented in the previous section support all these observational findings. In
addition to the stratification, some other factors such as
photoinhibition, zooplankton selective grazing, N : P
ratio, extra light shading due to coccoliths were suggested as potentially important processes governing E.
huxleyi bloom formation and intensity (Paasche, 2002;
Merico et al., 2004).
In general, photoinhibition of other phytoplankton
groups at irradiance values greater than ~200 W m 2
was generally found to promote E. huxleyi bloom development in surface waters. The higher light saturation
level of E. huxleyi with respect to diatoms and dinoflagellates make them more competitive at higher light
intensities when the others are photoinhibited. E. huxleyi bloom development in the Black Sea takes place at
radiance values of about 150 W m 2, and thus photoinhibition of other algae groups is not a particularly
effective process. On the other hand, the way in which
irradiance increases during the E. huxleyi growth period
appears to be critical for the bloom characteristics. In
the bControl RunQ, the slope of the PI curve for E.
huxleyi group was specified as the half of the value
assigned for other groups (i.e. a e = 0.005 m2 W 1),
implying the half saturation light level of 100 W
m 2. This value is a typical choice suggested by
observations (Nanninga and Tyrrell, 1996; Paasche,
2002), and indicates higher light requirement for E.
huxleyi growth with respect to other algae groups. It
is actually one of the primary reasons why E. huxleyi
blooms take place sometime after the spring bloom
formation of other algae groups. It also explains why
the picophytoplankton group having more or less similar maximum growth rate value but with higher initial
slope of the PI curve is able to grow synchronously
with E. huxleyi at deeper levels with lower light intensities. A further implication is possibility of earlier E.
huxleyi bloom development under warmer and clear
sky conditions in spring months. This is confirmed by
repeating the bControl RunQ with the slope of the PI
curve to be identical for all phytoplankton groups at the
value of 0.01 m2 W 1 (i.e., the half saturation light
value of ~50 W m 2). The resulting annual phytoplankton structure in the water column (Fig. 8a) possesses
earlier initiation of the E. huxleyi growth in mid-April,
and attaining slightly higher maximum biomass value
in May.
The shading effect of coccoliths, generated as a byproduct of E. huxleyi blooms, to the light penetration in
the water column is incorporated into the model (see
Eq. (7) in Appendix). As shown in Fig. 5c, coccoliths
limit production of small phytoplankton group to the
upper 20 m during the most intense period of E. huxleyi
bloom event by reducing light penetration. Picophytoplankton group can start growing at deeper part of the
euphotic zone only during the declining phase of E.
huxleyi bloom. In addition, as for the limitation introduced by the slope of the PI curve, the presence of
dense coccolith concentration hinders deeper penetration of E. huxleyi community development during later
stage of the bloom.
In the Control Run, nitrate half saturation constants
of phytoplankton groups were specified proportional
to their maximum growth rates with the highest value
for diatoms (0.5 AM) and lowest for dinoflagellates
(0.23 AM). The choice of the value of 0.38 AM for E.
huxleyi provides a slight competitive advantage
against picophytoplankton having the value of 0.3
AM. Additional simulations using two extreme values
of the E. huxleyi nitrate half saturation constants of
K ne = 0.2 and 0.5 AM yield very similar biomass distributions of E. huxleyi compared to that given by the
bControl RunQ (Fig. 8b). The choice of nitrate half
saturation constant therefore appears to be not so
critical for the E. huxleyi growth in the Black Sea,
as long as it is not exceptionally greater than those of
the other groups. Whatever is the choice of K ne, it will
T. Oguz, A. Merico / Journal of Marine Systems 59 (2006) 173–188
promote a bloom structure during the early summer,
because the other groups have already flourished and
have been subject to the mortality and stronger zoo-
183
plankton grazing pressure; thus, they will no longer be
able to compete with E. huxleyi.
Zooplankton grazing rates and food preferences are
generally most sensitive parameters in marine ecosystem models, especially in highly productive regions and
seasons. The food preference rates are often poorly
known. Their specifications involve great deal of uncertainty, and are subject to some tuning for obtaining
realistic model simulations compatible with observations. The bControl RunQ simulation considers the
most dominant microzooplankton grazing on E. huxleyi
by choosing the food preference coefficient b se = 0.6 as
compared to b ss = 0.2 for the picophytoplankton group.
Changing the original food preference coefficient of
b se = 0.6 to a higher value of 0.8 reduces the E. huxleyi
biomass only slightly. Reducing the food preference
coefficient to 0.4, on the other hand, weakens their
grazing, and therefore gives rise to slightly stronger
growth of E. huxleyi population during the entire summer period (Fig. 8c).
Changing the food preference value of microzooplankton on picophytoplankton group can also alter E.
huxleyi biomass indirectly. For example, increasing it
from b ss = 0.2 to 0.4 doubles the grazing pressure and
leads to depletion of picophytoplankton stocks, and a
compensatory increase in E. huxleyi biomass (Fig. 8d).
The impact of mesozooplankton grazing on E.
huxleyi is more severe since their growth occurs during the period of high mesozooplankton biomass right
after the intense spring bloom phase. The bControl
RunQ considers weak mesozooplankton grazing of E.
huxleyi specified by b le = 0.05. In the case of stronger
grazing, represented by b le = 0.15, availability of high
mesozooplankton biomass in the system during the
early summer period introduces an appreciable impact
on grazing which ultimately results in considerable
reduction in E. huxleyi biomass (Fig. 8e). Its further
increase to b le = 0.25 causes complete depletion of E.
huxleyi in the ecosystem, suggesting consumption of
the entire E. huxleyi stock by mesozooplankton. This
process is accompanied with more effective growth of
picophytoplankton community in the surface mixed
layer.
Fig. 8. The annual distribution of E. huxleyi biomass (mg C m 3)
computed by changing the value of (a) the slope of the PI curve from
0.005 to 0.01m2 W 1, (b) the nitrate half saturation constant from 0.2 to
0.5 AM, (c) the microzooplankton food preference coefficient on E.
huxleyi from 0.6 to 0.4, (d) the microzooplankton food preference
coefficient on small phytoplankton group from 0.2 to 0.4, (e) the
mesozooplankton food preference coefficient on E. huxleyi from 0.05
to 0.15, (f) the mesozooplankton food preference coefficient on microzooplankton from 0.2 to 0.4. The contour interval is 10 mg C m 3.
184
T. Oguz, A. Merico / Journal of Marine Systems 59 (2006) 173–188
The impact of zooplankton grazing on the food web is
in fact quite nonlinear. For example, increasing the
mesozooplankton food preference on microzooplankton
from 0.2 to 0.4, leads to an appreciable reduction on
microzooplankton biomass during the spring–early
summer period, which indirectly releases some of the
grazing pressure of microzooplankton on E. huxleyi and
give rise to their higher biomass during the summer–
autumn (Fig. 8f).
The last group of sensitivity experiments explores
whether or not phosphate limitation can be effective for
controlling E. huxleyi growth in the Black Sea. To this
end, the phosphorus to nitrogen ratio of 1 / 10 specified
in the Control Run is replaced by 1 / 22, and the total
phosphorus concentration in the water column is reduced by one half as well. Even under this setting,
which is prone to a strong phosphorus limitation, nitrogen limitation was found to still effectively control
E. huxleyi growth with a similar biomass distribution
depicted in Fig. 5d.
4. Conclusions
A process-oriented model provided a quantitative
support for the satellite-based interpretation of the
early summer E. huxleyi blooms in the Black Sea,
and explored its growth characteristic and variability
in terms of intensity, duration and timing. In accord
with the observations, the simulations showed flourishing of the E. huxleyi population right after dense
populations of diatoms in March and dinoflagellates in
April. In May, both E. huxleyi and picophytoplankton
population started increasing within the mixed layer
by using regenerated nutrients available within the
near-surface waters under moderate light conditions.
Picophytoplankton population later dominated within
the subsurface layer whereas E. huxleyi community
remained to confine within the surface mixed layer.
Hence, the Black Sea ecosystem is able to regularly
maintain a moderate level E. huxleyi bloom development as a part of its seasonal phytoplankton succession. The bloom intensity is however approximately 5fold smaller than those measured in the North Atlantic
(Tyrrell and Taylor, 1996) and the Bering Sea shelf
(Merico et al., 2004), because of relatively more oligotrophic character of the Black Sea interior basin.
The observed sequence of diatom–dinoflagellate–E.
huxleyi–picophytoplankton bloom events taking place
during the spring–early summer period arises as a
response to their different maximal growth rates with
highest for diatoms and lowest for dinoflagellates. E.
huxleyi and picophytoplankton have comparable inter-
mediate rates with a growth advantage of the latter
group at lower light levels. The diatom and picophytoplankton groups, having two highest net growth rate
characteristics, flourish first in March. Once their
bloom tends to decline mainly because of their grazing
by zooplankton, dinoflagellates start flourishing intensively in April. The light intensity still limits E.
huxleyi growth during this period, but diatoms continue to contribute to the overall phytoplankton population. Towards the end of April, the surface mixed
layer experiences simultaneous growth of E. huxleyi
and picophytoplankton, the latter of which later confine preferentially into the subsurface layer of the
euphotic zone. Because of their strong light requirement, the growth of E. huxleyi population is limited to
approximately upper 20 m layer. The presence of the
Cold Intermediate Layer with T b 8 8C below the
surface mixed layer is also a factor that limits their
subsurface growth. In general, their success in blooming against small phytoplankton group is not much
affected by some small changes in the growth parameters suggesting that they can grow in fairly wide
range of environmental conditions. Though implemented specifically to the Black Sea in the present application, the model serves a basic tool to investigate the
fate of CO2 in the water column when integrated with
the carbonate chemistry. This is one of the limitations
of the present global ocean carbon cycle models (e.g.
Moore et al., 2002).
Acknowledgements
The authors gratefully acknowledge the British
Council travel support between IMS (Turkey) and
SOC (UK). We are thankful to Toby Tyrrell, Kai
Wirtz and two other anonymous referees for their helpful comments on the paper.
Appendix A. Governing equations
The local temporal variation of any state variable F
is expressed by an equation of the form
BF
Bð wb F Þ
B
BF
þ
¼
K
þ Rð F Þ
Bt
Bz
Bz
Bz
ð1Þ
where t is time, z is the vertical coordinate, B denotes
partial differentiation, K is the vertical turbulent diffusion coefficient. w b represents the sinking velocity for
diatoms and detrital material, and is set to zero for the
other compartments. Rð F Þ denotes source and sink
terms whose explicit forms are given below.
T. Oguz, A. Merico / Journal of Marine Systems 59 (2006) 173–188
A.1. Phytoplankton module
The source-sink terms for all phytoplankton groups
are expressed by
RðPk Þ ¼ Uk Pk ½Gs ðPk ÞZs þ Gl ðPk ÞZl kk Pk
ð2Þ
where the subscript k denotes either d for diatoms, f for
dinoflagellates, e for E. huxleyi and s for small phytoplankton. Accordingly, temporal changes in phytoplankton standing stocks are controlled by primary
production (the first term), zooplankton grazing losses
(the terms within the square brackets) and physiological
mortality (the last term). The growth rate U k that limits
the primary production is defined by
Uk ¼ gk ak ð I Þfk ðT Þdmintbt;k ðNn ; Na Þ; bp;k Np b
ð3Þ
where g k , denotes maximum specific growth rate at
20 8C, a k (I)k , the limitation function due to light,
f k (T) the limitation function due to temperature. The
last term represents the nutrient uptake expressed as the
minimum of total nitrogen (sum of nitrate and ammonium) limitation b t,k (N n, N a) and phosphorus limitation
b p,k (N p). Following Liebig’s law of the minimum, the
nutrient uptake rate is thus limited by either inorganic
nitrogen or phosphorus. The total nitrogen limitation
function is specified by the sum of nitrate and ammonium limitations expressed, respectively, according to
the Monod kinetics in the forms
bn;k ðNn Þ ¼ Nn = Kn;k þ Nn expð uNa Þ
ð4aÞ
ba;k ðNa Þ ¼ Na = Ka;k þ N
ð4bÞ
where K n,k and K a,k represent half saturation constants
for nitrate and ammonium limitations respectively. Similarly, the phosphorus limitation function is given by
ð5Þ
bp;k Np ¼ Np = Kp;k þ Np
Light limitation for all phytoplankton groups is
represented by the tangent hyperbolic function
ak ð I Þ ¼ tanh½ ak I ð z; t Þ
ð6Þ
where the constant parameter a k quantifies the slope of
P–I curve. The photosynthetically available solar radiation I(z, t) decays exponentially with depth from its
surface value I s according to the extinction parameter k
defined by
Z z
k ¼ kw þ kp
ðPd þ Pf þ Pe þ Ps Þdz
0
Z z
4
Ca þ Cf4 þ Dn Þdz
ð7Þ
þ kc
0
185
where k w denotes the clear water contribution, and k p,
k c represent the self-shading coefficients due to turbid
water contributions of living and non-living constituents, respectively In Eq. (7), C*a and C*f denote concentrations of attached and free coccoliths which are
converted from carbon to nitrogen unit in order to be
compatible with the detritus concentration D n expressed
in nitrogen units within the second integral of Eq. (7).
The temperature limitation function is given by
ðT 20Þ=10
fk ðT Þ ¼ Q10;k
ð8Þ
where Q 10 value for all phytoplankton groups is taken
as 1.5. The temperature T is provided at each time step
by the physical model. A similar expression is also used
for zooplankton with a Q 10 value of 2.0.
A.2. Zooplankton module
The microzooplankton and mesozooplankton biomass are controlled by ingestion (which is assimilated
part of the grazing), predation as well as mortality and
excretion. They are expressed by
RðZs Þ ¼ cs
X
Gs ðPk Þ þ Gl ðDn Þ Zs
k
Gl ðZs ÞZl ls Zs ks Zs
RðZl Þ ¼ cl
X
ð9Þ
Gl ðPk Þ þ Gl ðDn Þ þ Gl ðZs Þ
k
Zl ll Zl kl Zl :
ð10Þ
In Eqs. (9) and (10), the first terms within the first
square brackets describe ingestion of phytoplankton
by microzooplankton and mesozooplankton, respectively. The second terms signify detritus consumption
by the zooplankton groups. The last term within the
square bracket of Eq. (10) represents ingestion of
microzooplankton by mesozooplankton with a similar
term of the opposite sign in Eq. (9). The last two
terms describe excretion and mortality, respectively,
which are both expressed in the linear form. As
shown by Oguz et al. (1999), the choice of linear
mortality, when compared to its quadratic form, does
not introduce oscillations resulting from prey–predator
interactions.
Grazing/predation terms for microzooplankton and
mesozooplankton in Eqs. (9), (10) are represented in the
Michaelis–Menten functional form in terms of the max-
186
T. Oguz, A. Merico / Journal of Marine Systems 59 (2006) 173–188
imum rate g k , the temperature limitation function f k (T),
and food capture efficiency coefficients b k,i by
bk;i dPi
P
Gk ðPi Þ ¼ gk fk ðT Þ
ð11Þ
Kk þ
bk;i dPi
i
where the subscript k denote either s for the microzooplankton group or l for the mesozooplankton
group. The subscript i runs over the four phytoplankton groups. b k,i denotes the constant coefficient of
food preference for kth predator on ith prey. Each of
these coefficients vary between zero (no preference)
and one (maximum preference).
A.3. Formulation of nitrogen and phosphorus cycles
The source-sink terms for the detrital organic nitrogen and phosphorus are expressed, respectively, by
RðDn Þ ¼ ½DETR en Dn
R Dp ¼ rPN ½DETR ep Dp
ð12a;bÞ
where r PN denotes a constant phosphorus to nitrogen
ratio, e n and e p are the remineralization rates for detrital
nitrogen and phosphorus, respectively. A separate equation for D p is introduced in Eq. (12b) in order to be able
to specify a different remineralization rate for detrital
phosphorus as compared to that of detrital nitrogen.
DETR is given by
X
DETR ¼ ð1 cl Þ
Gl ðPk Þ þ Gl ðZs Þ Zl
k
þ ð 1 cs Þ
þ
X
X
Gs ðPk Þ Zs
kk Pk þ ks Zs þ kl Zl
k
cl Gl ðDn ÞZl þ cs Gs ðDn ÞZs
ð13Þ
which represents the group of terms describing unassimilated (i.e. egested) parts of the food grazed by
zooplankton (the first and second square brackets),
phytoplankton and zooplankton mortalities (the third
square bracket), and consumption of detritus by zooplankton groups (the last square bracket).
The change in ammonium concentration is governed by
the losses due to its uptake in the primary production and
nitrification, and the sources due to excretion by zooplankton and remineralization. They are expressed by
X ba;k RðNa Þ ¼ Uk Pk Xa Na þ en Dn
bt;k
k
þ ls Zs þ ll Zl
Similarly, the source-sink terms for dissolved inorganic phosphate are
X
Uk Pk þ ep Dp þ rPN ½ls Zs þ ll Zl R Np ¼ rPN
k
ð16Þ
A.4. Formulation for the attachment end detachment of
coccoliths
Following Tyrrell and Taylor (1996) attached and
detached coccolith concentrations (in mg calcite C
m 3) generated as byproducts of E. huxleyi blooms
are computed by
RðCa Þ ¼ Cmax ak ð I Þfk ðT ÞrCN Pe
½Gs ðCa ÞZs þ Gl ðCa ÞZl ke Ca C
ð14Þ
ð17Þ
RðCd Þ ¼ C þ ke Ca ½Gs ðCd ÞZs þ Gl ðCd ÞZl HCd
ð18Þ
where the detachment rate C is represented by
C ¼ max½Cd ðCa Pmax rCN Pe Þ; Cdmin Ca k
The change in nitrate stocks is controlled by the
difference between nitrate uptake and nitrification, as
expressed by
!
X bn;k
Uk Pk þ Xa Na
ð15Þ
RðNn Þ ¼ bt;k
k
ð19Þ
The first term in Eq. (17) denotes the calcification
rate of whole E. huxleyi cells in which the maximum
rate C maxr CNP e is limited by the light and temperature
dependence. r CN is the carbon to nitrogen ratio to
convert P e from nitrogen to carbon unit and taken as
12 * 6.625 mg organic C/mmol N. The terms within the
square brackets represent the losses of attached coccoliths during the grazing of E. huxleyi cells by zooplankton community. Similarly, the third term is the loss due
to mortality of cells, and the last term is the detachment
rate. In Eq. (18), the loss due to mortality of cells and
detachment rate enter as the source terms to the temporal rate of change of detached coccolith concentrations. Detached coccoliths are lost during the
consumption of E. huxleyi by zooplankton community,
and dissolution of calcite of detached coccoliths. Eq.
(19) suggests that the detachment rate is computed by
the excess of attached coccolith concentration over the
maximum coccolith concentration allowed per E. huxleyi cell (i.e. the first term in the square bracket). If
there is no excess coccolith concentration, then detach-
T. Oguz, A. Merico / Journal of Marine Systems 59 (2006) 173–188
ment occurs at a negligible rate given by the second
term in the square bracket of Eq. (19).
References
Aknes, D.L., Egge, J.H., Rosland, R., Heimdal, B., 1994. Representation of Emiliania huxleyi in phytoplankton simulation models. A
first approach. Sarsia 79, 291 – 300.
Benli, H.A., 1987. Investigation of phytoplankton distribution in the
southern Black Sea and its effect on particle flux. In: Degens, E.T.,
Izdar, E. (Eds.), Particle Flux in the Ocean, Mitteilungen des
Geologisch-Palaontologischen Institutes, vol. 62. Universitat
Hamburg, pp. 77 – 87.
Cokacar, T., 2005. Atmospheric correction of ocean color for the
mineral dust aerosol over the Mediterranean Sea and remotely
sensed characterization of coccolithophore blooms in the Black
Sea. Ph.D Thesis, Middle East Technical University, Institute of
Marine Sciences. 139 pp.
Cokacar, T., Kubilay, N., Oguz, T., 2001. Structure of Emiliania
huxleyi blooms in the Black Sea surface waters as detected by
SeaWIFS imagery. Geophys. Res. Lett. 28 (24), 4607 – 4610.
Cokacar, T., Oguz, T., Kubilay, N., 2004. Interannual variability of
the early summer coccolithophore blooms in the Black Sea:
impacts of anthropogenic and climatic factors. Deep-Sea Res. I
51, 1017 – 1031.
Egge, J.K., Heimdal, B.R., 1994. Blooms of phytoplankton including
Emiliania huxleyi (Haptophyta). Effects of nutrient supply in
different N : P ratios. Sarsia 79, 333 – 348.
Eker, E., Georgieva, L., Senichkina, L., Kideys, A.E., 1999. Phytoplankton distribution in the western and eastern Black Sea in spring
and autumn 1995. ICES J. Mar. Sci. 56, 15 – 22 (Supplement).
Eker-Develi, E., Kideys, A.E., 2003. Distribution of phytoplankton in
the southern Black Sea in summer 1996, spring and autumn 1998.
J. Mar. Syst. 39, 203 – 211.
Gregoire, M., Beckers, J.M., Nihoul, J.C.J., Stanev, E., 1998. Reconnaissance of the control Black Sea’s ecohydrodynamics by means
of a 3D interdisciplinary model. J. Mar. Syst. 16, 85 – 106.
Gregoire, M., Soetaert, K., Nezlin, N., Kostianoy, A., 2004. Modelling the nitrogen cycling and plankton productivity in the Black
Sea using three dimensional interdisciplinary model. J. Geophys.
Res. 109, C05007. doi:10.1029/1001JC001014.
Hay, B.J., Honjo, S., 1989. Particle sources in the present and
Holocene Black Sea. Oceanography 2, 26 – 31.
Head, R.N., et al., 1998. The hydrography and biology of a bloom of
the coccolithophorid Emiliania huxleyi in the northern North Sea.
J. Sea Res. 39, 255 – 266.
Hulburt, E.M., 1990. Description of phytoplankton and nutrient in
spring in the western North Atlantic Ocean. J. Plankton Res. 12,
1 – 28.
Iglesias-Rodriguez, M.D., et al., 2002. Representing key phytoplankton functional groups in ocean carbon cycle models: coccolithophorids. Global Biogeochem. Cycles 16, 1100. doi:10.1029/
2001GB001454.
Karl, D.M., Knauer, G.A., 1991. Microbial production and particle
flux in the upper 350 m of the Black Sea. Deep-Sea Res. 38
(Supp. 2A), S655 – S661.
Kubilay, N., Kocak, M., Cokacar, T., Oguz, T., Kouvarakis, G.,
Mihalopoulos, N., 2002. The influence of Black Sea and local
biogenic activity on the seasonal variation of aerosol sulfur species in the Eastern Mediterranean atmosphere. Global Biogeochem. Cycles 16, 1079. doi:10.1029/2002GB001880.
187
Kuypers, M.M.M., et al., 2003. Anaerobic ammonium oxidation by
anammox bacteria in the Black Sea. Nature 422, 608 – 611.
Lancelot, C., Staneva, J., Van Eeckhout, D., Beckers, J.M., Stanev, E.,
2002. Modeling the impact of the human forcing on the ecological
functioning of the northwestern Black Sea. Estuarine, Coastal
Shelf Sci. 54, 473 – 500.
Lebedeva, L.P., Shushkina, E.A., 1994. Modelling the effect of Mnemiopsis on the Black Sea plankton community. Oceanology
(Engl. Transl.) 34, 72 – 80.
Lebedeva, L.P., Vostokov, S.V., 1984. Studies of detritus formation
processes in the Black Sea. Oceanology (Engl. Transl.) 24 (2),
258 – 263.
Mankovsky, V.I., et al., 1996. Long-term variability of the Black Sea
water transparency and factors determining its strong decrease in
the late 1980s and early 1990s. Technical Report. Marine Hydrophysical Institute, Sevastopol, Ukraine. 32 pp.
Merico, A., et al., 2004. Modelling phytoplankton succession on the
Bering Sea shelf: role of climate influencers and trophic interactions in generating Emiliania huxleyi blooms 1997–2000. DeepSea Res. I 51, 1803 – 1826.
Mikaelyan, A.S., 1997. Long-term variability of phytoplankton
communities in open Black Sea in relation to environmental
changes. In: Ozsoy, E., Mikaelyan, A. (Eds.), Sensitivity to
Change: Black Sea, Baltic Sea and North Sea, NATO Sci,
Partnership Sub-series 2, vol. 27. Kluwer Acad, Norwell,
Mass. pp. 105 – 116.
Moore, J.K., Doney, S.C., Kleypas, J.A., Glover, D.M., Fung, I.Y.,
2002. An intermediate complexity marine ecosystem model for
the global control. Deep-Sea Res. II 49, 403 – 462.
Moncheva, S., Krastev, A., 1997. Some aspects of phytoplankton
long-term alterations off Bulgarian Black Sea Shelf. In: Ozsoy,
E., Mikaelyan, A. (Eds.), Sensitivity to change: Black Sea, Baltic
Sea and North Sea, NATO Sci, Partnership Sub-series 2, vol. 27.
Kluwer Acad, Norwell, Mass. pp. 79 – 94.
Murray, J.W., Codispoti, L.A., Friederich, G.E., 1995. Oxidation–
reduction environments: the suboxic zone in the Black Sea. In:
Huang, C.P., O’Melia, C.R., Morgan, J.J. (Eds.), Aquatic Chemistry: Interfacial and Interspecies Precosses, ACS Advances in
Chemistry Series, vol. 224, pp. 157 – 176.
Nanninga, H., Tyrrell, T., 1996. Importance of light for the formation
of algal blooms by Emiliania huxleyi. Mar. Ecol., Prog. Ser. 136,
195 – 203.
Oguz, T., 2005. Long-term impacts of anthropogenic forcing on the
Black Sea ecosystem. Oceanography 18 (2), 112 – 121.
Oguz, T., Ducklow, H.W., Malanotte-Rizzoli, P., Tugrul, S., Nezlin,
N., Unluata, U., 1996. Simulation of annual plankton productivity
cycle in the Black Sea by a one-dimensional physical–biological
model. J. Geophys. Res. 101, 16585 – 16599.
Oguz, T., Ducklow, H.W., Malanotte-Rizzoli, P., Murray, J.W., Vedernikov, V.I., Unluata, U., 1999. A physical–biochemical model of
plankton productivity and nitrogen cycling in the Black Sea.
Deep-Sea Res. I. 46, 597 – 636.
Oguz, T., Ducklow, H.W., Malanotte-Rizzoli, P., 2000. Modeling
distinct vertical biogeochemical structure of the Black Sea: dynamical coupling of the oxic, suboxic and anoxic layers. Global
Biogeochem. Cycles 14, 1331 – 1352.
Oguz, T., Ducklow, H.W., Purcell, J.E., Malanotte-Rizzoli, P., 2001.
Modeling the response of top–down control exerted by gelatinous
carnivores on the Black Sea pelagic food web. J. Geophys. Res.
106, 4543 – 4564.
Paasche, E., 2002. A review of the coccolithophorid Emilinia huxleyi
(Prymnesiophyceae) with particular reference to growth, coccolith
188
T. Oguz, A. Merico / Journal of Marine Systems 59 (2006) 173–188
formation, and calcification–photosynthesis interactions. Phycologia 40, 503 – 529.
Reigman, R., Noordeloos, A.A.M., Cadee, G.C., 1992. Phaeocystis
blooms and eutrophication of the continental coastal zones of the
North Sea. Mar. Biol. 112, 479 – 484.
Sorokin, Y.I., 2002. The Black Sea Ecology and Oceanography.
Backhuys Publishers, Leiden. 32 pp.
Soydemir, N., Kideys, A.E., Ekingen, G., 2003. Phytoplankton composition of the western Black Sea during the R.V Knorr cruise
in May–June 2001. Second International Conference on
bOceanography of the Eastern Mediterranean and Black Sea:
Similarities and Differences of Two Interconnected BasinsQ
14–18 October 2002, Ankara, Turkey.
Sur, H.I., Ozsoy, E., Unluata, U., 1994. Boundary current instabilities,
upwelling, shelf mixing and eutrophication processes in the Black
Sea. Prog. Oceanogr. 33, 249 – 302.
Tyrrell, T., Merico, A., 2004. Emiliania huxleyi: bloom observations
and the conditions that induce them. In: Thierstein, H.R., Youngs,
J.R. (Eds.), Coccolithophores—From Molecular Processes to
Global Impact. Springer, pp. 75 – 97.
Tyrrell, T., Taylor, A.H., 1996. A modeling study of Emiliania huxleyi
in the NE Atlantic. J. Mar. Syst. 9, 83 – 112.
Uysal, Z., et al., 1998. Phytoplankton patches formed along the
southern Black Sea coast in spring and summer 1996. In:
Ivanov, L.I., Oguz, T. (Eds.), Ecosystem Modeling as a Management Tool for the Black Sea, vol 1, NATO Science Series,
Environmental Security, V. 47. Kluwer Academic Publishers,
Netherlands, pp. 151 – 162.
Vedernikov, V.I., Demidov, A.B., 1997. Vertical distributions of
primary production and chlorophyll during different seasons in
deep part of the Black Sea. Oceanology (Engl. Transl.) 37,
376 – 384.
Baixar