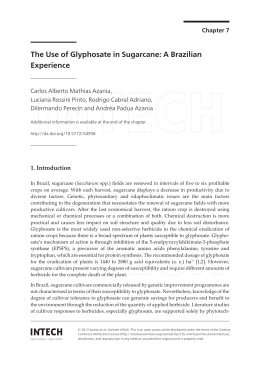
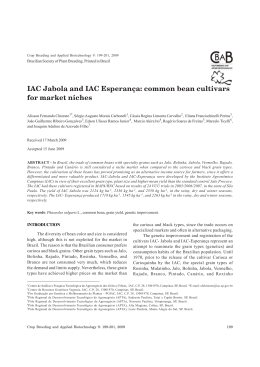
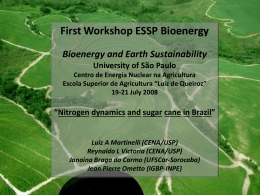
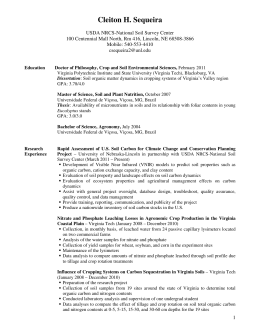
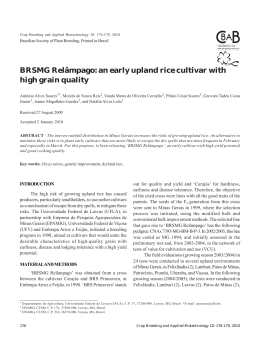
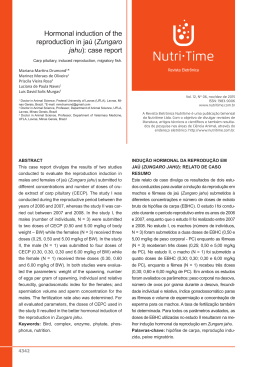
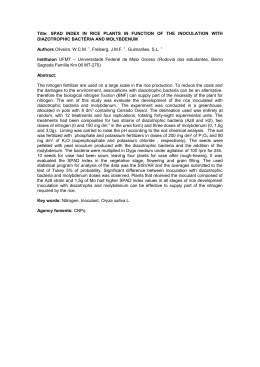
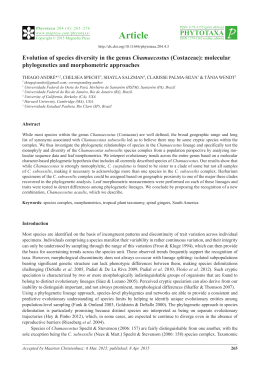
Journal of Agricultural Science; Vol. 5, No. 1; 2013
ISSN 1916-9752 E-ISSN 1916-9760
Published by Canadian Center of Science and Education
Response of Eucalyptus (Eucalyptus urograndis) Plants at Different
Doses of Glyphosate
Fernanda Campos Mastrotti Pereira1, Mariluce Pascoalina Nepomuceno1, Rodrigo Neto Pires1, Mariana Casari
Parreira1 & Pedro Luis da Costa Aguiar Alves1
1
Universidade Estadual Paulista "Julio de Mesquita Filho", Faculdade de CIências Agrárias e Veterinárias Campus de Jaboticabal, Brazil
Correspondence: Fernanda Campos Mastrotti Pereira, Universidade Estadual Paulista "Julio de Mesquita Filho",
Faculdade de CIências Agrárias e Veterinárias-Campus de Jaboticabal, Brazil.
E-mail:
[email protected]
Received: September 11, 2012
doi:10.5539/jas.v5n1p66
Accepted: October 9, 2012
Online Published: December 13, 2012
URL: http://dx.doi.org/10.5539/jas.v5n1p66
Abstract
The aim of this study was to evaluate the response of eucalyptus plants submitted to the application of glyphosate
increasing rates. The doses 0.0, 3.6, 7.2, 18, 36, 72 and 180 g ha-1 of acid equivalent (ae) of glyphosate were
applied on plants. At 7, 15, 22, 29, 36 and 42 days after application (DAA) was determined leaves relative
chlorophyll content and quantum efficiency of photosystem II. At 22 and 42 DAA plant height and stem diameter
were measured. At 42 DAA were determined the leaves dry mass, stem dry mass and foliar area. The height,
diameter, leaves and stem dry masses and foliar area were converted to percentages, whereas the controls as 100%.
These variables were fitted to the model described by Gauss equation. The data chlorophyll content and quantum
efficiency of photosystem II were submitted to mean comparison, and when they differed, we performed the
Tukey test at 5% probability. All the features presented here showed some hormetic effect promoted by reduced
rates of glyphosate and the increments observed in these characteristics (when compared to control) ranged
between 5.92 and 33.18% at 42 DAA. From average curve with height, diameter, leaves dry mass, stem dry mass
and foliar area can be concluded that the increase averaged 12% on application of 16 g a.e. of glyphosate ha-1. For
leaves chlorophyll content significant differences were observed only at 29 DAA, while for quantum efficiency of
photosystem II significant differences were found only at 7 DAA.
Keywords: chlorophyll, hormesis, photosystem II quantum efficiency, subdoses
1. Introduction
In Brazil, eucalyptus crop is rapidly expanding and each year the weighted average yield has increased, emerging
as the main species for wood and cellulose production, also in the international market (ABRAF, 2011). Also
according to this association were grown in 2010 about 4.7 million hectares, which produce 14.1 million tons of
cellulose and 5.8 million tons of charcoal.
However, the interference exerted by weeds is one of the factors that can reduce the growth of this culture,
compromising their productivity. Glyphosate is an herbicide widely used to weed control in eucalyptus, applied in
full area for desiccation before planting, to control regrowth and to control weeds between plant rows. This
herbicide acts on the enzyme 5-enolpyruvyl-shikimate-3-phosphate-synthase (EPSPs), blocking the aromatic
amino acids synthesis and secondary amino acids (Jaworski, 1972). Inhibition of EPSPs also leads to the
accumulation of shikimate in plant tissues, allowing the use of glyphosate as a sensitivity indicator.
However, the use of this herbicide in inadequate conditions can lead to drift, compromising weed control, leading
to increase doses and, consequently, increasing spending and still can cause damage to non-target species and
environment (Hemphill & Montgomery, 1981).
“Hormesis” (word derived from “hormaein”, which in Greek means “to excite”) was originally defined as a
behavior in which a biological trait is stimulated by low doses of a compound and inhibited by high doses of the
same compound (Bukowski & Lewis, 2000; Calabrese & Baldwin, 2001; Calabrese & Baldwin, 2002). This effect
has been observed in bacteria, fungi, higher plants and animals (Calabrese, 2005).
66
www.ccsenet.org/jas
Journal of Agricultural Science
Vol. 5, No. 1; 2013
Increments resulting from the effect of low doses of glyphosate have been observed in corn (Wagner, Kogan, &
Parada, 2003), soybean (Godoy, 2007), coffee, pinus, citrus and Commelina benghalensis (Velini, Guerrini,
Castro, Meschede, Trindade, Mori, Godoy, & Cataneo, 2006). These authors concluded that was positive effect on
growth, increased biomass, shoot growth and root system of plants studied, as well as increases in absorption and
accumulation of phosphorus in the leaves.
Moreover, according to the results observed by Maciel, Velini, Santos and Viana (2007) in Ananas erectifolius, the
application of reduced rates of glyphosate did not cause stimulation or increase in vegetative growth of plants.
The aim of this study was to evaluate the response of eucalyptus plants submitted to the application of glyphosate
rates.
2. Material and Methods
This work was conducted under semi-controlled conditions (no restriction of water and light) in 2011, from July to
October. Pre-selected seedlings from a hybrid of Eucalyptus grandis W. Hill ex. Maiden com E. urophylla S.T.
Blake (E. urograndis) were transplanted in plastic pots (19 x 25 x 14) cm, of height and diameters. This
commercial material was chosen because it is widely grown in the state of São Paulo - Brazil, has a fast growth,
tolerance to drought periods and good wood quality.
The pots were filled with soil from the surface of a clayey red Latosol with pH 6.8. To mineral nutrition of the
seedlings were performed fortnightly covering fertilization using 300 kg ha-1 of the formula 4-14-8 (NPK
formulation).
The doses 0.0; 3.6; 7.2; 18; 36; 72 e 180 g ha-1 of acid equivalent (a.e.) of glyphosate were applied on the plants one
month after planting, seeking simulate the effect of a possible drift in the field during the applications of
glyphosate for weed control.
Upon application the plants were, on average, height of 35 cm and diameter stem of 4.5 cm. The herbicide used
was Scout® (720 g a.e. kg-1 of glyphosate), applied by a CO2 constant pressure backpack sprayer provided with
spray nozzles model XR 11002 calibrated of 3 bar pressure. The spray volume applied was 200 L ha-1.
The experimental design was a randomized block with four replications. Each experimental unit consisted of one
plant per pot.
At 7, 15, 22, 29, 36 and 42 days after application (DAA) was determined the relative chlorophyll content in the
leaves, using a portable chlorophyll SPAD-502 (Minolta Camera Co. Ltd.). The procedure was performed between
8 and 10 AM, in the fifth leaf fully developed, performing four readings and considering the value obtained from
their averages. On the same dates the quantum efficiency of photosystem II (PS II) was evaluated (the ratio
between variable fluorescence and maximum fluorescence of chlorophyll a), using a fluorometer Handy PEA
Chlorophyll Fluorometer (Hansatech Instruments Ltd.). The leaves were pre-adapted to the darkness, with use of
forceps for 30 minutes before determination.
At 22 and 42 DAA plant height (measured from soil level to last leaf enter) and stem diameter (measured at 10 cm
of soil) were measured. Even at 42 DAA were determined the foliar area (Li Cor, modelo LI 3000A), the dry mass
of leaves and stem, then dried at about 70ºC during 7 days.
The height, diameter and plant dry masses were transformed to percentage, considering the control (plants
exempted from the glyphosate application) to 100%. These variables were fitted to the model described by Gauss
equation:
y = y0+(A/W*sqrt (PI/2))*exp(-2*((x-xc)/w)^ 2)
The chlorophyll content and the quantum efficiency of photosystem II were submitted to means comparison, and
when it differed, was performed the Tukey test at 5% of probability.
3. Results and Discussion
Although not evaluated the phytotoxicity promoted by simulated glyphosate drift, visual symptoms were observed
in plants, which were characterized by yellowing of the tip leaves from the dose of 36 g a.e. ha-1 of glyphosate. The
symptoms are intensified as the applied dose increased to 72 and 180 g a.e. ha-1 of glyphosate. The yellowing of
leaves was followed by the death of the tip and loss of apical dominance to the dose 180 g a.e. ha-1 of glyphosate.
The yellowing of leaf tissue on the application of this herbicide was also certified by Salgado, Alves, Kuva,
Takahashi, Dias and Lemes (2011) in E. urograndisfor doses from 158.6 g a.e. ha-1 of glyphosate; Tuffi Santos,
Ferreira, Ferreira, Duarte, Tiburcio, and Sanyos (2006) in E. grandis, E. urophylla, E. saligna, E. pellita e E.
resinifera after application of doses higher than 86.4 g a.e. ha-1 of glyphosate; Yamashitaand Guimarães (2005) in
67
www.ccsenet.org/jas
Journal of Agricultural Science
Vol. 5, No. 1; 2013
cotton, after application of 270 g a.e. ha-1 of glyphosate and Magalhães et al. (2001a), in maize and sorghum, for
doses about 172 g a.e. ha-1 of glyphosate. According to Campbell, Evans and Reed (1976), this fact may be related
with the chloroplasts degradation, very common phenomenon in plants treated with glyphosate.
Tuffi Santos et al. (2006) also showed the losses of glyphosate drift on the eucalyptus growth, reporting reductions
in height stem diameter and plant dry mass at 45 days after herbicide application. The authors also warned of the
need for care and use of technology for the application of herbicides in eucalyptus.
For plant height (Figure 1) was observed that the fit by Gauss model was significant, indicating that doses up to
123 and 94 g a.e. ha-1 of glyphosate provided higher values than the controls (considered 100%) at 22 and 42 days
after application (DAA).
114
22 DAA: y = 99,73 + (939,11/93,68*sqrt (PI/2))*exp(-2*((x-5,02)/93,68)^2
112
R²=0,6453
42 DAA: y = 95,85 + (1466,58/75,84*sqrt (PI/2))*exp(-2*((x-33,29)/75,84)^2
110
Height (% of control)
R²=0,8484
108
106
104
102
100
98
96
22 DAA
42 DAA
94
92
-20
0
20
40
60
80
100
120
140
160
180
200
Doses of glyphosate (g e.a. ha-1)
Figure 1. Height of eucalyptus plants subjected to glyphosate rates, expressed as a percentage, assessed at 22 and
42 days after application(straight line represent height at 22 DAA and dashed line represent height at 42 DAA)
At 22 DAA, this increase was up to 7.70% when compared to control. Already at 42 DAA, even for doses of 3.6
and 93.7 g a.e. ha-1 of glyphosate, the increases in plant height reached up to 11%. Since doses from 130 and 100 g
a.e. ha-1 of glyphosate was responsible for the plants intoxication (Figure 1) at 22 and 42 DAA.
The stimulatory effect of low doses of many herbicides, including glyphosate, was observed and related
(Cedergreen, Streibig, Kudsk, Mathiassen, & Duke, 2007; Velini et al., 2008; Wagner, Kogan, & Parada, 2003).
Research studying this phenomenon caused by herbicides on crops and aquatic plants indicated that may pass
increments up to 100% in the evaluated parameters. However, the observed average stimulus varies between 20
and 30% compared to the control (Cedergreen, Ritz and Streibig, 2005). Duke, Cedergreen, Velini and Belz (2006)
related that, in general, the hormesis response was more pronounced in woody genera, as in Eucalyptus spp.
The coefficient of determination (R²) ranged between 0.8484 and 0.9851, respectively, demonstrating good fit for
height, diameter, leaf dry mass, stem dry mass and foliar area to the chosen model. There were exceptions to the
height of the plants at 22 DAA, which showed R² of 0.6453, which reflects the closeness of height values observed
for doses up to 20 g a.e. ha-1 of glyphosate.
At 22 DAA were observed increases in stem diameter of the plants (Figure 2) varying between 1.15% and 4.20%
for doses 3.6 and 18 g a.e. ha-1 of glyphosate, respectively. In this evaluation, the maximum increment in stem
diameter was 3.93%, found with application of 27.73 g a.e. ha-1 of glyphosate. Even at 22 DAA, doses from 62.50
g a.e. ha-1 of glyphosate decreased stem diameter, which was up 3.92% lower than observed in control with the
application of 180 g a.e. ha-1 of glyphosate.
68
www.ccsenet.org/jas
Journal of Agricultural Science
Vol. 5, No. 1; 2013
At 22 DAA, doses up to 41.95 g a.e. ha-1 of glyphosate led to increases in the diameter of eucalyptus plants, which
exceeded the control by up to 5.92% with the application of 18 g a.e. ha-1 of glyphosate (Figure 2). The dose of
21.40 g a.e. ha-1 of glyphosate was responsible for the maximum diameter increase at 42 DAA. Doses of 41.95 g
a.e. ha-1 of glyphosate restrict diameter plants, which was about 2% smaller than control.
110
22 DAA: y= 96,22 + (571,37/(58,86*sqrt(PI/2))*exp(-2*((x-26,86/58,86)^2))
R²=0,94752
108
Stem diameter (% of control)
42 DAA: y= 98,64 + (217,99/(23,06*sqrt(PI/2))*exp(-2*((x-19,88/23,06)^2))
106
R²=0,84883
104
102
100
98
96
22 DAA
42 DAA
94
92
-20
0
20
40
60
80
100
120
140
160
180
200
-1
Doses of glyphosate (g e.a. ha )
Figure 2. Stem diameter of eucalyptus plants subjected to glyphosate rates, expressed as a percentage, measured at
22 and 42 days after application (straight line represent stem diameter at 22 DAA and dashed line represent stem
diameter at 42 DAA)
For stem dry mass, at 42 DAA, relatives values greater than control were observed using doses between 4 and 39 g
a.e. ha-1 of glyphosate (figure 3). In this evaluation, the largest increase was 22.8% compared to control, with
application of 19.8 g a.e. ha-1 of glyphosate. The accumulation of stem dry mass is restricted by the application of
doses higher than 39 g a.e. ha-1 of glyphosate. For doses above 70 g a.e. ha-1 of glyphosate, the restriction was
26.52% compared to control.
Even at 42 DAA, doses up to 50 g a.e. ha-1 of glyphosate increased the leaves dry mass (Figure 3), and the
maximum accumulation was 9%, observed to dose 15.60 g a.e. ha-1 of glyphosate. Doses up to 50 g a.e. ha-1 of
glyphosate restrict the leaves dry mass, and the highest dose administered (180 g a.e. ha-1 of glyphosate) caused
reduction of 40% in leaves dry mass. According Salgado et al. (2011), doses of 158.6 and 195.1 g a.e. ha-1 of
glyphosate were sufficient to reduce 50% of stems and leaves dry mass accumulation.
For foliar area the highest value was observed in the application of 18.77 g a.e. ha-1 of glyphosate, which exceeded
the control in 33.18% (Figure 3). However, doses up to 55 g a.e. ha-1 of glyphosate caused an increase in foliar area.
Doses up to 56 g a.e. ha-1 of glyphosate caused decreases in foliar area, and the maximum reduction in this variable
was approximately 37%, observed in the application of 120g a.e. ha-1 of glyphosate.
The average equation still allowed to infer that doses above 110 g a.e. ha-1 of glyphosate reduced about 20% of the
values of height, diameter, leaves dry mass, stem dry mass and foliar area.
From height, diameter, stem and leaves dry mass and foliar area (only at 42 DAA evaluation) data was made an
average equation (Figure 4), which indicated that doses close to 16 g a.e. ha-1 of glyphosate led to gains of up to 12%
in the characteristics mentioned above, evaluated at 42 DAA. Doses above 58 g a.e. ha-1 of glyphosate caused
reductions in these characteristics, which showed lower relative values in comparison with control. The average
equation still allowed inferring that doses above 110 g a.e. ha-1 of glyphosate reduced about 2% of height, diameter,
stem and leaves dry mass and leaf area values.
69
www.ccsenet.org/jas
Journal of Agricultural Science
Vol. 5, No. 1; 2013
folhas y= 58,22 + (8115,77/(127,80*sqrt(PI/2))*exp(-2*((x-11,27/127,80)^2))
R²=0,9851
140
︶
l
o
r
t
n
o
c
f
o
%
︵
R²=0,8663
área foliar: y= 63,18 + (5252,79/(70,99*sqrt(PI/2))*exp(-2*((x-21,58/70,99)^2))
120
R²=0,9159
110
100
90
80
m
a
e
t
s
f
o
s
s
a
m
y
r
d
70
s
e
v
a
e
l
f
o
s
s
a
m
y
r
d
a
e
r
a
r
a
i
l
o
f
a
e
r
a
r
a
i
l
o
f
d
n
a
s
s
a
m
y
r
D
caule: y= 75,26 + (2027,33/(33,80*sqrt(PI/2))*exp(-2*((x-19,28/33,80)^2))
130
60
50
20
40
60
80
100
140
160
180
200
1
︵
120
a
h
.
a
.
e
g
0
e
t
a
s
o
h
p
y
l
g
f
o
s
e
s
o
D
-20
︶
Figure 3. Leaves dry mass, stem dry mass and foliar area of eucalyptus plants subjected to glyphosate rates,
expressed as a percentage, measured at 42 days after application (straight line represent foliar area, dashed line
represent dry mass of steam and dashed dot line represent dry mass of leaves)
︵ ︶
%
a
e
r
a
r
a
i
l
o
f
e
s
s
a
m
y
r
d
,
r
e
t
e
m
a
i
d
,
t
h
g
i
e
H
140
y = 77,36 + (3435,79/79,49*sqrt (PI/2))*exp(-2*((x-20,72)/79,49)^ 2))
130
R² = 0,88172
120
110
100
90
80
70
60
50
0
20
40
60
80
100
e
t
a
s
o
h
p
y
l
g
f
o
s
e
s
o
D
︵
120
140
1
a
h
.
a
.
e
g
-20
160
180
200
︶
Figure 4. Average equation constructed from height, diameter, leaves dry mass, stem dry mass and foliar area data,
measured at 42 DAA
The results of this study corroborate with those obtained by Velini et al. (2008) and Cedergreen (2008), who found
hormesis to glyphosate rates below 36 g a.e. ha-1 of glyphosate.
Velini et al. (2008) noted that when glyphosate was applied at doses between 1.8 and 36.0 g a.e. ha-1 were stimuli
from 50 to 100% increase in leaves, stem and root for Commelina benghalensis, E. grandis e Pinnus caribea. The
authors also found hormetic effects on corn and soybeans. In this cases, the ground dry mass increases of 27.81%
and 25.46% for doses of 14.2 and 22.6 g e.a. ha-1 of glyphosate, respectively.
70
www.ccsenet.org/jas
Journal of Agricultural Science
Vol. 5, No. 1; 2013
Cedergreen, Streibig, Kudsk, Mathiassen, and Duke (2007), observed 687 dose-response curves for organisms to
herbicide sublethal (separated in three species of plants or algae and 10 types of herbicides) concluded that the
treatment were between 25 and 76% higher than controls, depending on species.
Cedergreen (2008), evaluating the effect of glyphosate and seven others herbicides applied through the solution
growth and spray in barley plants grown in hydroponics, concluded that glyphosate induced a real stimulation in
dry mass accumulation on the application corresponding to doses of 5 and 10% of the recommended for field
application. Also according to the author, the growth stimuli were relatively small (increase of 25% in plants dry
mass) and very dependent on plant growth variations.The hormetic effect is related to the glyphosate’s sites action,
since this effect was not observed in plants resistant to this herbicide (Velini et al., 2008).
For leaves chlorophyll content (Table 1), significant differences were observed only at 29 DAA. The chlorophyll
content was statistically lower than the levels observed in treatments 0, 3.6, 7.2 and 36 g a.e. ha-1 of glyphosate, and
superior to the others before the application of 180 g a.e. ha-1 de glyphosate.
Possibly, the glyphosate affected the chlorophyll, since this molecule is part of same sites of action. In chloroplasts,
glyphosate joins to the EPSP-S3P enzyme complex, inhibiting the essential amino acidssynthesis (Vidal, 1997).
The glyphosate may also affect the secondary metabolites synthesis, due to blockage of shikimic acid pathway
(Lydon & Duke, 1988).
The differences only at 29 DAA can be justified by some stress suffered by the plant, including considering the
manifestation of a stress presented one month after glyphosate application. However, further studies need to
confirm this result, as well as because of its occurrence.
Table 1.Total chlorophyll content in eucalyptus leaves in function of glyphosate rates applied
Evaluation time (days after application)
Glyphosate doses
7
15
22
29
36
42
0
49,1A
40,4A
44,7A
42,1B
46,6A
42,0A
3,6
46,8A
42,3A
43,0A
38,9B
40,8A
39,5A
7,2
47,4A
43,1A
44,2A
41,9B
41,3A
40,4A
18
49,1A
42,8A
45,7A
44,3AB
42,2A
42,2A
36
47,7A
40,5A
44,5A
42,1B
42,1A
40,0A
72
54,6A
41,2A
48,4A
43,7AB
45,2A
44,8A
180
46,1A
45,3A
50,8A
55,4A
49,2A
46,0A
F
0,685ns
0,185ns
0,260ns
0,017*
0,221ns
0,346ns
VC (%)
7,34
5,80
9,35
11,55
10,71
10,08
(g a.e. ha-1)
SMD
10,05
6,00
11,29
12,41
11,55
10,63
Means followed by same letter in column do not differ significantly by Tukey test at 5% probability. * Significant
at 5% probability. ** Significant at 1% probability. ns- nosignificant.
SMD-significant mean difference.
Evaluating the quantum efficiency of photosystem II, significant differences were found only at 7 DAA (Table 2).
On this occasion, the lowest value (0.725) was observed at 18 g a.e. ha-1 of glyphosate, and the highest value (0.806)
at 180 g a.e. ha-1 of glyphosate.
However, the observed values in all evaluations, regardless of glyphosate rate applied, ranging between 0.725 and
0.801. Such values are not indicative of stress, according to Maxwell and Johnson (2000). According to these
authors, the value of quantum efficiency of photosystem II can vary, for most species and stress-free conditions,
between 0.750 and 0.850. Only values below 0,750 indicate stress, resulting in a reduction in quantum efficiency
of photosystem II, and consequently, in the photosynthetic plant potential.
The quantum efficiency of photosystem II indicates the efficiency of excitation energy capture by open reaction
centers or may also indicate the existence of photo inhibitoryeffects (Correia & Alves, 2010).
71
www.ccsenet.org/jas
Journal of Agricultural Science
Vol. 5, No. 1; 2013
Table 2. Quantum efficiency of photosystem II as a function of glyphosate rates applied
Evaluation time (days after application)
Glyphosate doses
7
15
22
29
36
42
0
0,75A-D
0,758A
0,759 A
0,797A
0,755A
0,809A
3,6
0,780A-C
0,749A
0,797 A
0,768A
0,725A
0,801A
7,2
0,727CD
0,749A
0,778 A
0,758A
0,774A
0,781A
18
0,725D
0,763A
0,796 A
0,722A
0,704A
0,770A
36
0,745B-D
0,785A
0,791 A
0,754A
0,733A
0,791A
72
0,782AB
0,804A
0,772 A
0,775A
0,694A
0,796A
180
0,806A
0,645A
0,814 A
0,714A
0,766A
0,806A
F
0,000**
0,000**
0,279ns
0,731ns
0,688ns
0,294ns
VC (%)
2,96
3,67
3,59
9,09
10,66
2,94
SMD
0,06
0,09
0,06
0,16
0,19
0,05
(g a.e. ha-1)
Means followed by same letter in column do not differ significantly by Tukey test at 5% probability. * Significant
at 5% probability. ** Significant at 1% probability. ns- no significant.
SMD - significant mean difference
For a long time, the hormetic effect has been observed in studies designed to investigate other problems, such as
herbicides high doses effect (Streibig, 1980). Hormesis still confront major controversy within agronomy areas,
environmental protection and medical toxicology (Calabrese, 2005; Thayer, Melnick, Burns, Davis, & Huff,
2005).
However, Calabrese and Baldwin (2001) stated that hormesis is the rule and not the exception, and that this
phenomenon represents an evolutionary response to perturbations induced by the environment. Many herbicides
were originally developed as plant growth regulators, thus proving the existence of hormesis. Glyphosate, for
example, is the predecessor of a compound used as a growth regulator.
Currently, research have been conducted in order to study the hormetic effect in plants; however, few studies have
investigated the mechanisms of growth stimulation, and when investigated, the results were inconclusive (Morre,
2000; Appleby, 2001), indicating the relevance of studies in the area.
Low doses of glyphosate are not recommended to stimulate the crops growth, since the hormetic effects depends
on many factors, such as climate, variety and stage of plant development as well as the formulation of glyphosate
applied (Velini, Trindade, Barberis, & Duke, 2010).
4. Conclusion
The plants intoxication visual symptoms were observed and characterized by yellowing leaves from the dose of 36
g ha-1 glyphosate. The symptoms are intensified as the applied dose increased to 72 and 180 g ha-1 glyphosate. All
the features presented here showed some hermetic effect promoted by reduced rates of glyphosate and the
increments observed in these characteristics (when compared to control ranged between 5.92 and 33.18% at 42
DAA. From average curve with height, diameter, leaves dry mass, stem dry mass and foliar area can be concluded
that the increase averaged 12% on application of 16 g a.e. of glyphosate ha-1. For leaves chlorophyll content
significant differences were observed only at 29 DAA, while for quantum efficiency of photosystem II significant
differences were found only at 7 DAA.
References
Abraf-Associação Brasileira Dos Produtores De Florestas Plantas. Anuário estatístico da ABRAF: ano base (2011
& 2012). Disponível em www.abraflor.org.br/estatisticas.asp. Acessoem: 12 ago. 2012.
Appleby, A. P. (2001). The practical implications of hormetic effects of herbicides on plants. Belle Newsletter, 1-3,
http://dx.doi.org/doi: 10.1177/096032719801700511
72
www.ccsenet.org/jas
Journal of Agricultural Science
Vol. 5, No. 1; 2013
Bukowski, J. A., & Lewis, R. J. (2000). Hormesis and health: A little of what you fancy may be good for you.
Southern Medical Journal, 93, 371-374. http://dx.doi.org/doi: 10.1080/15401420490426927
Calabrese, E. J. (2005). Paradigm lost, paradigm found: The reemergence of hormesis as a fundamental dose
response model in the toxicological sciences. Geneva, Environ. Pollution, 138, 378-411.
http://dx.doi.org/10.1016/j.envpol.2004.10.001
Calabrese, E. J., & Baldwin, L. A. (2001). Hormesis: U-shaped dose responses and their centrality in toxicology.
Trends in Pharmacological Science, 22, 285-291, 2001. http://dx.doi.org/10.1016/S0165-6147(00)01719-3
Calabrese, E. J., & Baldwin, L. A. (2002). Applications of hormesis in toxicology, risk assessment and
chemotherapeutics. Trends Pharmacology, 7, 323-331. http://dx.doi.org/10.1016/S0165-6147(02)02034-5
Campbell, W. F., Evans, J. O., & Reed, F. C. (1976). Effect of glyphosate on chloroplast ultrastructure of quack
grass mesophyll cell. Weed Science, 24, 22-25.
Cedergreen, N. (2008). Herbicides can stimulate plant growth. Weed Research, 48(5), 429-438.
http://dx.doi.org/10.1111/j.1365-3180.2008.00646.x
Cedergreen, N., Streibig, J. C., Kudsk, P. Mathiassen, S. K., & Duke, S. O. (2007). The occurrence of hormesis in
plants and algae. Dose-Response, 5(2), 150-162. http://dx.doi.org/10.2203/dose-response.06-008
Cedergreen, N., Ritz, C., & Streibig, J. C. (2005). Improved empirical models describing hormesis.
Environmental Toxicology and Chemistry, 24, 3166-72. http:// dx.doi.org/10.1897/05-014R.1
Correa, M. J. P., & Alves, P. L. C. A. (2010). Efeitos da aplicação de herbicidas sobre a eficiência fotoquímica em
plantas de soja convencional e geneticamente modificada. Ciência Agrotécnica, 34(5), 1136-1145.
http://dx.doi.org/10.1590/S1413-70542010000500009
Duke, E. O., Cedergreen, N., Velini, E. D., Belz, R. G. (2006). Hormesis: is it an important factor in herbicide use
and allelopathy? Outlooks on Pest Management, 17(1), 29-33. http:// dx.doi.org/10.1564/16feb10
Godoy, M. C. (2007). Efeitos do glyphosate sobre o crescimento e absorção de fósforo pela soja. 53 f. Dissertação
(Mestrado)-Curso de Agronomia, Universidade Estadual Paulista (UNESP)-Faculdade de Ciências Agrárias
(FCA), Botucatu.
Hemphill Jr., D. D., & Montgomery, M. L. (1981). Response of vegetable crops to sub lethal application of 2,4-D.
Weed Science, 29(6), 632-635.
Jaworski, E. G. (1972). Mode of action of N-phosphonomethylglycine: inhibition of aromatic amino acid
biosynthesis.
Journal
of
Agricultural
and
Food
Chemistry,
20,
1195-1198.
http://dx.doi.org/10.1021/jf60184a057
Lydon, J., & Duke, S. O. (1988). Glyphosate induction of elevated levels of hydroxybenzoic acids in higher plants.
Journal of Agricultural and Food Chemistry, 36, 813-818. http://dx.doi.org/10.1021/jf00082a036
Maciel, C. D. G. M., Velini, E. D., Santos, R. F., & Viana, A. G. P. (2007). Crescimento de carauá branco sob
efeito de subdoses de glyphosate. In Simpósio Internacional Sobre Glyphosate, Botucatu. Anais... Botucatu:
FEPAF, 71-75.
Magalhães, P. C., Silva, J. B., Durães, F. O. M., Karam, D., & Ribeiro, L. S. (2001a). Efeito de doses reduzidas de
glyphosate e paraquat simulando deriva na cultura do milho. Planta Daninha, 19(2), 247-253.
http://dx.doi.org/10.1590/S0100-83582001000200013
Magalhães, P. C., Silva, J. B., Durães, F. O. M., Karam, D., & Ribeiro, L. S. (2001b). Efeito de doses reduzidas de
glyphosate e paraquat simulando deriva na cultura do sorgo. Planta Daninha, 19(2), 255-262.
http://dx.doi.org/10.1590/S0100-83582001000200014
Maxwell, K., & Johnson, G. N. (2000). Chlorophyll fluorescence: a practical guide. Journal of Experimental
Botany, 51, 659-668. http://doi:10.1093/jexbot/51.345.659
Morre, D. J. (2000). Chemical hormesis in cell growth: a molecular target at the cell surface. Journal of Applied
Toxicology, 20, 157-163. http://10.1002/(SICI)1099-1263
Salgado, T. P., Alves, P. L. C. A., Kuva, M. A., Takahashi, E. N., Dias, T. C. S., & Lemes, L. N. (2011). Sintomas
da intoxicação inicial de Eucalyptus proporcionados por subdoses de glyphosate aplicadas no caule e nas
folhas. Planta Daninha, 29(4), 913-922. http://dx.doi.org/10.1590/S0100-83582011000400022
Streibig, J. C. (1980). Models for curve-fitting herbicide dose response data. Acta Agriculturæ Scandinavia, 30,
59-64.
73
www.ccsenet.org/jas
Journal of Agricultural Science
Vol. 5, No. 1; 2013
Thayer, K. A., Melnick, R., Burns, K., Davis, D., & Huff, J. (2005). Fundamental flaws of hormesis for public
health decisions. Environmental Health Perspective, 113, 1271-1276. http://10.1289/ehp.7811
Tuffi Santos, L. D., Ferreira, F. A., Ferreira, L. R., Duarte, W. M., Tiburcio, R. A. S., & Santos, M. V. (2006).
Intoxicação de espécies de eucalipto submetidas à deriva do glyphosate. Planta Daninha, 24(2), 359-364.
http://dx.doi.org/10.1590/S0100-83582006000200020
Velini, E. D., Guerrini, I. A., Castro, R. M., Meschede, D. K., Trindade, M. L. B., Mori, E., ... Cataneo, A. C.
(2006). Genes de Eucalypto que respondem ao transportador de fosfato e glyphosate em membranas. In XXV
Congresso Brasileiro da Ciência das Plantas Daninhas (pp. 314-316), Anais, Brasília.
Velini, E. D., Alves, E., Godoy, M. C., Meschede, D. K., Souza, R. T., & Duke, S. O. (2008). Glyphosate applied
at low doses can stimulate plant growth. Pest Management Science, 64(2), 489-496.
http://dx.doi.org/10.1002/ps.1562
Velini, E. D., Trindade, M. L. B., Barberis, L. R. M., & Duke, S. O. (2010). Growth regulation and other
secondary effects of herbicides. Weed Science, 58(3), 351-354. http://dx.doi.org/10.1614/WS-D-09-00028.1
Vidal, R. A. (1997). Herbicidas: Mecanismos de ação e resistência de plantas. Porto Alegre, RS, 165.
Wagner, R., Kogan, M., & Parada, A. M. (2003). Phytotoxic activity of root absorbedglyphosate in corn seedlings
(Zea mays L.). Weed Biology and Management, 3(4), 228-232. http://10.1046/j.1444-6162.2003.00110.x
Yamashita, O. M., & Guimarães, S. C. (2005). Resposta de cultivares de algodoeiro a subdoses de glyphosate.
Planta Daninha, 23(4), 627-633. http://dx.doi.org/10.1590/S0100-83582005000400010
74
Baixar