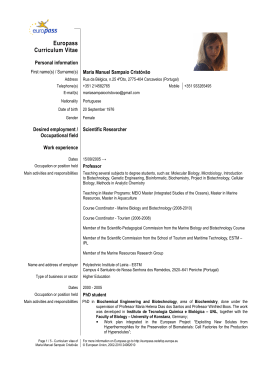
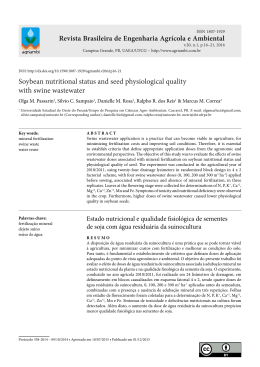
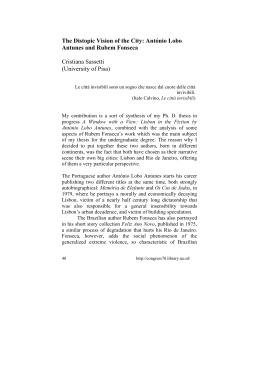
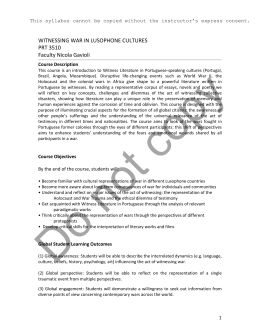
Use of epilithic diatoms as bioindicators from lotic
systems in southern Brazil, with special emphasis on
eutrophication.
LOBO 1 , E.A.; CALLEGARO 2 , V.L.M.; HERMANY 3 , G.; BES 4 , D.; WETZEL 5 , C.A.; OLIVEIRA 6 , M.A.
1
Laboratory of Limnology. University of Santa Cruz do Sul (UNISC), RS, Brazil. ([email protected])
2
Natural Sciences Museum, Zoobotanical Foundation of Rio Grande do Sul (FZB), RS, Brazil. ([email protected])
3
Graduate Course on Ecology. Federal University of Rio Grande do Sul (UFRGS), RS, Brazil.
([email protected])
4
Laboratory of Limnology (UNISC). Undergraduate PIBIC/CNPq fellowship.
5
Undergaduate BIC/FAPERGS fellowship.
6
Laboratory of Limnology (UNISC). Post Doctor/CNPq fellowship.
ABSTRACT: Use of epilithic diatoms as bioindicators from lotic systems in southern brazil, with special
emphasis on eutrophication. E p i l i t h i c d i a t o m b i o c e n o s e s h a v e b e e n r e c o m m e n d e d b y
researchers from several countries as particularly suitable for water quality evaluation.
However, saprobic systems using diatoms have been developed to assess water organic
pollution, not taking into account the effects of eutrophication on the biological composition
of the communities. Thus, the main aim of this study was to determine the tolerance of
diatom species to eutrophication in three streams (Sampaio, Grande and Bonito) of the
Mato Leitão countryside area, RS, Brazil, using multivariate analyses techniques. Results
of physical, chemical and biological analyses obtained in studies carried on in the area
between the years of 1993 to 1998 were used to develop the present study. Multivariate
analyses of species composition data were applied in two different approaches. Firstly,
species and sampling units were grouped using TWINSPAN (Two-way Indicator Species
Analysis). Secondly, Canonical Correspondence Analysis (CCA) was applied in order to
uncover the main gradients of changes in species composition, relating these changes
to the eutrophication process. From the levels of tolerance to eutrophication determined
for each diatom species, they were given an indicative value from 1 to 5, which
corresponded, respectively, to very low, low, medium, high and very high tolerance levels,
thus allowing the calculation of the Biological Water Quality Index (BWQI). These results are
complementary to the saprobic system already proposed for use in Southern Brazilian rivers.
Key-words: d i a t o m s , b i o i n d i c a t o r s , w a t e r q u a l i t y a s s e s s m e n t , o r g a n i c p o l l u t i o n ,
eutrophication.
RESUMO: Utilização de algas diatomáceas epilíticas como organismos bioindicadores de sistemas
lóticos sul brasileiros, com especial enfoque à eutrofização. Biocenoses de diatomáceas epilíticas
têm sido recomendadas por pesquisadores em muitos países como particularmente adequadas para avaliar a qualidade da água. Contudo, os sistemas de sapróbios que utilizam
diatomáceas têm sido desenvolvidos para avaliar a poluição orgânica da água,
desconsiderando os efeitos da eutrofização na composição biológica das biocenoses.
Assim, o objetivo principal deste trabalho foi determinar a tolerância de espécies de
diatomáceas à eutrofização nos arroios Sampaio, Grande e Bonito, Município de Mato
Leitão, RS, Brasil, utilizando análises multivariadas. Para a execução deste trabalho, foram utilizados os resultados físicos, químicos e biológicos obtidos em estudos desenvolvidos nestes arroios, entre os anos de 1993 a 1998. Análises multivariadas dos dados da
composição de espécies foram aplicadas em duas formas distintas. Primeiro, as espécies
e as estações de amostragem foram agrupados utilizando TWINSPAN (Análise de Espécies
Indicadoras de Dupla Entrada). Segundo, Análise de Correspondência Canônica (CCA)
foi a p l i c a d a p a r a r e v e l a r o s p r i n c i p a i s g r a d i e n t e s d a s m u d a n ç a s n a c o m p o s i ç ã o d e
e s p é c i e s, relacionando esta mudança com o processo de eutrofização. A partir da det e rm i n aç ã o dos distintos graus de tolerância à eutrofização das espécies de diatomáceas,
Acta Limnol. Bras., 16(1):25-40, 2004
25
foram-lhes atribuídos valores indicativos de 1 a 5, correspondentes a níveis de tolerância
muito baixa, baixa, média, alta e muito alta, respectivamente, possibilitando desta forma
o cálculo do Índice Biológico de Qualidade da Água (IBQA). Estes resultados vêm complementar o sistema de sapróbios proposto para rios sul brasileiros.
Palavras-chaves: diatomáceas, bioindicadores, avaliação qualidade da água, poluição orgânica, eutrofização.
Introduction
Pollution of surface freshwaters is one of the greatest environmental issues in the
world. Along these lines, the approaches to water quality evaluation can be basically
divided into two categories. The first utilizes physical and chemical methods, and the
second considers biological methods of evaluation (Lobo & Callegaro, 2000).
Regarding the first approach, physical and chemical methods allow only instantaneous
measurements, therefore restraining the knowledge of water conditions to the moment
when the measurements were taken. These limitations become more serious when the
object of study is a lotic system (running waters, such as rivers and streams) where
current promotes the continuous renewal of the water at each site. However, periodical
measurements over a long period of time significantly enhance the information value of
physical and chemical methods, since the discrete aspect of the data is reduced.
Considering the second approach, when biological methods are used to monitor
water quality, long-term environmental effects can be detected, since these methods
have the capacity of reflecting conditions which are not anymore present at the time of
sampling and analysis, but were originated from the process of community development.
Therefore, physical and chemical methods are complementary to biological methods.
Together they constitute the basis to a correct assessment of the quality of running
waters (Lobo & Callegaro, 2000).
Among the distinct aquatic communities used for the evaluation of freshwater quality,
epilithic diatoms seem to be particularly suitable for this purpose (Kelly, 2002; Round,
1993; Schoeman & Haworth, 1986). In Brazil, however, the use of this group of organisms
for water quality assessment has received little attention, and most of the investigations
have been concentrated on the use of biotic indices. Hence, some studies related to
t h i s q u e s t i o n h a v e b e e n p u b l i s h e d , e s p e c i a l l y i n S o u t h e r n B r a z i l (Lobo & Bender, 1998;
Lobo & Ben da Costa, 1997; O l i v e i r a e t a l . , 2 0 0 1 ; R o d r i g u e s & L o b o , 2 0 0 0 ; Lobo et al.,
1995, 1 9 9 6 , 1 9 9 9 ) .
Lobo et al. (2002) published the first Brazilian saprobic system, characterizing 3
differential diatom groups: Group A (highly pollution-tolerant species), Group B (pollutiontolerant species) and Group C (less pollution-tolerant species). This new classification,
including saprobic values characterizing each differential group, can be utilized to calculate
biotic water quality indices. According to several authors (Lobo et al., 1995, 1996, 1999,
2002; Oliveira et al., 2001) the use of the Saprobic Index (SI) proposed by Pantle & Buck
(1955) is desirable.
Although sampling size has been significantly increased between the original system
proposed by Lobo et al. (1996) and the system of Lobo et al. (2002) – from 79 to 183
samples – the characterization of differential group C was flawed due to the low relative
abundances of the observed species.
This fact can be explained considering that the saprobic systems which utilize
diatoms was developed to assess water organic pollution, not considering the effects of
eutrophication on the biological composition of the communities. Environmental monitoring
in lotic systems of the region have indicated the presence of eutrophication processes
(Lobo & Ben da Costa, 1997; Lobo & Bender, 1998; Lobo et al. 1996, 1999).
26
LOBO, E.A. et al.
Use of epilithic diatoms as bioindicators from lotic ...
Biotic indices which consider the influence of eutrophication on the composition of
epilithic diatoms biocenoses, usually referred to as Trophic Diatom Indices (TDI), have
been developed mostly in Europe (Kelly & Whitton, 1995; Schiefele & Kohmann, 1993;
Kwandrans et al. 1998; Eloranta & Soininen, 2002; Wu & Kow, 2002). Gomez & Licursi
(2001) have developed the Pampean Diatom Index (PDI) for water quality evaluation in
lotic systems of the Argentinean Pampa. Unlike the previous indices mentioned, which
considered the epilithic community, the PDI, which integrates effects of organic enrichment
and eutrophication, is based on the sensitivity of the epipelic diatom community.
In this context, thus, the main aim of this work was to determine the tolerance to
eutrophication of diatom species in three streams (Sampaio, Grande and Bonito) of the
Mato Leitão countryside area, RS, Brazil, in order to complement the saprobic system
proposed by Lobo et al. (2002).
Material and methods
Physical, chemical and biological analyses data were obtained in the project “Water
quality study on Sampaio, Grande and Bonito Streams, Mato Leitão, RS, Brazil” (Lobo &
Kirst, 1994, 1999), carried out between 1993 and 1998 were utilized. To obtain these data,
seasonal scientific trips were done to 12 sampling sites located along Sampaio, Grande
and Bonito Streams, between co-ordinates 29°21’12”-29°36’37” S and 51°19’36”-51°58’53” W
(Tab.I) (Fig. 1). Physical, chemical and biological variables were utilized as parameters for
assessment of organic pollution and eutrophication. The following physical and chemical
variables were used: water temperature (ºC), pH, conductivity (Cond), turbidity (Turb),
dissolved oxygen (DO), biochemical oxygen demand (BOD 5 ), dissolved inorganic nitrogen
(DIN), phosphates (PO 4 ), and total solids (TS) (Tab. II). Water temperature and oxygen were
measured in situ, using a field multi-measurer YSI model 6.000. Samples for determination
of the remaining variables were collected from the sub-surface in glass bottles (300 or
1000 ml). They were packed in ice and analysed one day after sampling. Sampling Protocols
for physical and chemical analyses followed those described in American Public Health
Association (1999).
Epilithic algal samples for the identification and counts of the diatom
(Bacillariophyceae) community were taken every three months, representing the four
seasons of the year. For qualitative and quantitative analyses, samples of epilithic diatoms
were scrubbed off the upper surfaces of submerged stones of 10-15 cm in diameter using
a toothbrush. Sam p l e s w e r e f i x e d w i t h f o r m a l i n , f o l l o w i n g t h e m e t h o d o f K o b a y a s i a n d
Mayama (1982). Diatom samples were cleaned with sulphuric and hydrochloric acid and
mounted in Pleurax. All specimens found in a number of transects across the slides were
identified and counted up to a minimum of 600 valves scored (Schoeman, 1979; Kobayasi
and Mayama, 1982). For species identification, the following taxonomical sources were
used: Krammer (1997, 2000, 2002, 2003), Krammer & Lange-Bertalot (1986, 1988, 1991a, b),
Lange-Bertalot (1993, 1995, 1996a, b, 2001), Lange-Bertalot & Metzeltin (1996), Lange-Bertalot
& Moser (1994), Lange-Bertalot et al. (2003), Metzeltin & Lange-Bertalot (1998, 2002), Rumrich
(2000), and Simonsen (1987). Abundant species were indicated according to the criterion
o f L o b o a n d L e i g h t o n ( 1 9 8 6 ) . Voucher samples are stored in the Herbarium DIAT-UNISC,
from University of Santa Cruz do Sul, RS.
For an integrated analysis of physical, chemical and biological data, multivariate
analysis techniques were applied. The software used was PC-ORD version 4.0 for Windows
(McCune & Mefford, 1999), with abiotic data transformation performed by the software
FITOPAC (Shepherd, 1996).
Firstly, species and samples were grouped using TWINSPAN - Two-way Indicator
Species Analysis (Hill, 1979). At this stage, data were not yet transformed. Percentages of
occurrence of abundant species were used to build the matrix of Biological data, calculated
according to Lobo & Leighton (1986). Program defaults were followed applied
Acta Limnol. Bras., 16(1):25-40, 2004
27
S an
-28
-57
4º
-78º
g
Ar
4º
-42º
ta C
a ta r
a
t in
en
-28
ina
-51
Sampaio, Grande and Bonito
Streams Hydrographical Basin
BRAZIL
-28º
-78º
RS
At
lan
ti c
Oc
ea
n
-51.6
Uru
-28º
-42º
ti c
lan
At
gu a
y
e
Oc
an
Graphic Scale
0
250
500
750 km
-33
-33
GRAPHIC SCALE
-51
-57
0.00
0
0.25
0.50
30
60 km
GAUSS-KRUGER TRANSVERSE SECANT PROJECTION
51°19’36’’W
29°21’12’’S
GRAPHIC SCALE
0
5km
29°36’37’’S
51°58’53’’W
Geoprocessing Laboratory - UNISC
Alexandre Rauber - [email protected]
Figure 1: M a p o f t h e s t u d y a r e a s h o w i n g t h e l o c a t i o n o f S a m p a i o , G r a n d e a n d B o n i t o s t r e a m s , M a t o
Leitão, RS, Brazil, including sampling stations (1 to 12).
(Pseudospecies dichotomy levels: 0, 2, 5, 10 and 20; minimum group size for division: 5;
maximum number of indicators per division: 5; highest number of species in the final
table: 200; highest number of divisions: 6).
Canonical Correspondence Analysis (CCA), a direct multivariate gradient analysis,
developed by Ter Braak (1986) was then applied in order to evaluate the relationship
between the abiotic variables and diatom species composition patterns, within the groups
defined by TWINSPAN, using the covariance matrices. A log transformation [log (x + 1)]
28
LOBO, E.A. et al.
Use of epilithic diatoms as bioindicators from lotic ...
Table I. L o c a t i o n , y e a r a n d s e a s o n o f 6 1 s a m p l e s c o l l e c t e d f r o m S a m p a i o , G r a n d e a n d B o n i t o S t r e a m s ,
countryside area of Mato Leitão, RS, Brazil, from 1993 to 1998.
SAMPLE
SAMPLING SITE
STREAM
SEASON
YEAR
E1
E2
E3
E4
E5
E6
E7
E8
E9
E10
E11
E12
E13
E14
E15
E16
E17
E18
E19
E20
E21
E22
E23
E24
E25
E26
E27
E28
E29
E30
E31
E32
E33
E34
E35
E36
E37
E38
E39
E40
E41
E42
E43
E44
E45
E46
E47
E48
E49
E50
E51
E52
E53
E54
E55
E56
E57
E58
E59
E60
E61
ML1
ML2
ML3
ML4
ML5
ML6
ML7
ML8
ML9
ML10
ML1
ML2
ML3
ML4
ML5
ML6
ML7
ML8
ML9
ML10
ML11
ML1
ML2
ML3
ML4
ML5
ML6
ML7
ML 8
ML 9
ML 10
ML11
ML 12
ML1
ML2
ML3
ML4
ML5
ML6
ML7
ML8
ML9
ML10
ML11
ML12
ML1
ML4
ML1
ML4
ML1
ML1
ML4
ML4
ML4
ML1
ML1
ML4
ML1
ML4
ML1
ML4
Sampaio
Sampaio
Sampaio
Sampaio
Sampaio
Sampaio
Sampaio
Bonito
Bonito
Bonito
Sampaio
Sampaio
Sampaio
Sampaio
Sampaio
Sampaio
Sampaio
Bonito
Bonito
Bonito
Grande
Sampaio
Sampaio
Sampaio
Sampaio
Sampaio
Sampaio
Sampaio
Bonito
Bonito
Bonito
Grande
Grande
Sampaio
Sampaio
Sampaio
Sampaio
Sampaio
Sampaio
Sampaio
Bonito
Bonito
Bonito
Grande
Grande
Sampaio
Sampaio
Sampaio
Sampaio
Sampaio
Sampaio
Sampaio
Sampaio
Sampaio
Sampaio
Sampaio
Sampaio
Sampaio
Sampaio
Sampaio
Sampaio
Winter
Winter
Winter
Winter
Winter
Winter
Winter
Winter
Winter
Winter
Spring
Spring
Spring
Spring
Spring
Spring
Spring
Spring
Spring
Spring
Spring
Summer
Summer
Summer
Summer
Summer
Summer
Summer
Summer
Summer
Summer
Summer
Summer
Autumn
Autumn
Autumn
Autumn
Autumn
Autumn
Autumn
Autumn
Autumn
Autumn
Autumn
Autumn
Winter
Winter
Summer
Summer
Winter
Spring
Spring
Summer
Summer
Autumn
Summer
Summer
Autumn
Autumn
Winter
Winter
1993
1993
1993
1993
1993
1993
1993
1993
1993
1993
1993
1993
1993
1993
1993
1993
1993
1993
1993
1993
1993
1994
1994
1994
1994
1994
1994
1994
1994
1994
1994
1994
1994
1994
1994
1994
1994
1994
1994
1994
1994
1994
1994
1994
1994
1994
1994
1995
1995
1995
1995
1995
1996
1997
1997
1998
1998
1998
1998
1998
1998
Acta Limnol. Bras., 16(1):25-40, 2004
29
was applied to the abiotic data. Biotic data were transformed by rank adjustment, according
to recommendation by McCune & Mefford (1999), due t o a g r e a t n u m b e r of zeroes found in
the species data. Altogether, nine environmental variables were used - water temperature,
pH, conductivity, turbidity, dissolved oxygen, biochemical oxygen demand, dissolved inorganic
nitrogen, phosphates, and total solids - (Tab. II). Thirty five biological variables were analyzed,
corresponding to the abundant species identified. A Monte Carlo test was applied in order to
verify the probability of the eigenvalues of the ordination axes having been randomly attributed
(999 iterations; p < 0,05) (McCune & Mefford, 1999).
Groups of sampling units based on species composition, given by the TWINSPAN
analysis were determined from the sum of relative abundances within each group, divided
by the number of sampling units in each group. Taxa were then associated with the
group with where the resulting highest numeric value.
Results and discussion
Classification analysis using TWINSPAN (Tab. III; Fig. 2) resulted in 5 groups from 61
samples. Indicator species G o m p h o n e m a c f . c l e v e i a n d C y c l o t e l l a m e n e g h i n i a n a were
differential for group A, Navicula rostellata for groups B and C, and Encyonema silesiacum
a n d G o m p h o n e m a a n g u s t u m were differential for groups D and E (Fig. 2). Groups A, D
and E were established on the second dichotomy level of the pseudospecies, whereas,
groups B and C on the third level, because, in the first dichotomy (separating group A,
with 14 samples, from the other group, with 21 samples) it was not possible to f i n d a
significant correlation. A new cut was therefore needed, separating groups B and C.
Canonical correspondence analysis (CCA) revealed low explicability (21.4%) of the
total variability of the data on the first 3 axes (Tab. IV), which should be expected with
ordination analyses of a large set of environmental data, according to Ter Braak & Prentice
(1988), co n f i r m i n g t h e c o m p l e x i t y o f t h e f a c t o r s d e t e r m i n i n g c o m m u n i t y c o m p o s i t i o n .
H o w e v e r , t h e s p e c i e s - e n v i r o n m e n t c o r r e l a t i o n s f o r a x i s a x e s 1 ( r = 0 . 7 8 9 ) , 2 (r = 0.748)
and 3 (r = 0.740) indicated a strong relationship between the species distribution and the
environmental variables used for the ordination. Monte Carlo’s permutation test revealed
that the ordination on axes 1, 2 and 3 was statistically significant (p<0.05),
With regards to axis 1 (10.9 % of variation), the canonical coefficient showed that
water temperature and total phosphate were the most important environmental variables
most important to the ordination. These variables, which were, respectively, strongly
correlated with the positive and negative ends of axis 1 (Fig. 3). Intra-set correlations
a d d e d B O D 5 , dissolved inorganic nitrogen and conductivity as significantly contributing
variables, correlated with the positive end of axis 1 (Tab. V). In addition, intra-set correlations
also showed phosphate as the most significant variable (r = -0.635), confirming its
importance to the ordination of sampling units along axis 1, and characterising a specific
eutrophication gradient.
On the second axis (6.7% variability explained) the canonical coefficient showed
a high correlation of its positive end with the variables conductivity and turbidity.
The negative end of axis 2 was mostly correlated with BOD 5 (r = -0.636) (Fig. 3).
Intra-set correlations confirmed BOD 5 as the most significant variable (r = -0.659), and
also included pH and water temperature, which had high correlations with the negative
and positive ends of axis 2, respectively (Tab. V).
Water quality studies in the same streams carried out in 1997 and 1998 (Lobo et al.,
1999), found that in all sampling sites, and seasons of the year, the phosphate
concentrations in the water, were considered high, supporting this environmental
characterisation. This, indeed, indicates that eutrophication processes are taking place.
BOD 5 was characterised by high correlation coefficients with both axes, reflecting
the influence of organic pollution to the ordination of samples along the gradients
detected, since this variable is directly related with to this kind of pollution (Hamm, 1969).
These results, therefore, validate the hypothesis that the response of the diatom community
in lotic systems in Southern Brazil is the result of the interaction of variables characterising
processes of organic contamination as well as eutrophication.
30
LOBO, E.A. et al.
Use of epilithic diatoms as bioindicators from lotic ...
61
35
14
26
21
A
10
11
B
C
10
16
D
E
Figure 2: Indicator species of the main divisions from TWINSPAN classification, for 61 sampling sites.
The numbers following the species names indicate the categories of relative abundance
(1, 0-2%; 2, 2-4%; 3, 4-10%; 4, 10-20%; 5, >20%). Numbers of sampling sites, are given inside the
squares.
Table II: M e a n , s t a n d a r d d e v i a t i o n ( s ) , c o e f f i c i e n t o f v a r i a t i o n ( C . V . ) , a n d r a n g e s ( l o w e s t a n d h i g h e s t
value) of environmental variables.
Mean
Temperature (ºC)
s (±)
C. V. (%)
Lowest
Highest
18.9
4.0
21.2
2.8
pH
7.3
0.3
4.0
6.7
8.1
Cond. (mS/cm)
0.1
0.1
65.4
0.0
0.5
26.1
25.1
96.2
4.0
139.0
8.9
1.1
12.3
5.2
10.5
14.8
15.2
102.6
0.8
54.8
Turb. (NTU)
DO (mg/L)
BOD-5 (mg/L)
25.4
DIN (mg/L)
2.4
2.7
115.3
0.2
21.1
PO4 (mg/L)
0.115
0.127
110.459
0.018
0.600
TS
304.3
396.6
130.3
45.0
3135.0
In this context, for each diatom species from the 5 TWINSPAN groups distributed
along the eutrophication gradient detected, was given and operational indicative values
from 1 to 5, based on the tolerances to eutrophication, corresponding, respectively, to
very low, low, medium, high and very high tolerance levels (Tab. VI). Using the indicative
values for each species, the Biological Water Quality Index (BWQI) can be calculated,
according to the equation in Wegl (1983), modified by the authors:
BWQI =
∑ (s × h × vi)
∑ (h × vi)
w h e r e s is the species saprobic value, according to the classification of Lobo et al.
(2002); h is the percentage of occurrence (abundance) of each species in the sample and
Acta Limnol. Bras., 16(1):25-40, 2004
31
Table III: S p e c i e s v e r s u s s a m p l e s , o r d i n a t e d b y T W I N S P A N . N u m b e r s i n d i c a t e r e l a t i v e a b u n d a n c e s : 1 , 2 ,
3, 4 and 5 represent 0-2%, 2-4%, 4-10%, 10-20% and > 20%, respectively.
SAMPLES
442233312111123334455555
224 2 2223 1 1 113444544553355166
1289023815796056759367891234734762556719048129304468014825301
SPECIES/GROUPS
Rhopalodia gibberula
Amphora montana
Frustulia cf. weinholdi
Surirella angusta
Ulnaria ulna
Gomphonema parvulum
Navicula rostellata
Fragilaria capucina v.
rumpens
Luticola goeppertiana
Navicula gregaria
Melosira varians
Amphipleura lindheimeri
Cyclotella meneghiniana
Cymbella affinis
Cymbella aff. hustedtii
Nitzschia palea
Navicula symmetrica
Nitzschia linearis
Encyonema silesiacum
Gomphonema angustatum
Geissleria aikenenses
Navicula cryptotenella
Adlafia bryophila
Diadesmis contenta
Cocconeis placentula
v. euglypta
Sellaphora seminulum
Achnanthes exigua v.
exigua
Achnanthidium minutissimum
Eolimna minima
Nitzschia amphibia
Gomphonema cf. clevei
Planothidium rostratum
Cocconeis placentula
v. placentula
Gomphonema angustum
Navicula atomus
GROUPS OF SAMPLES
---------------------------------4---------------------------------------------------123322--21----------------------------------------------------1111--3--------------------------------------------------4121223-11--------------------------------------------------1112123-12-----------------------------------------2423-53232334223-541---------------------------------------2---4-33223112112--1----------------------------------------------2-----------------------------------------1-111112111--------33341422433-1-----11-------------------2
3-444545554431--3-------32415313111----------------------------22241-1-111----------3-2-----1---------------------------3211131----11-------------------------------------------------211124-1111------------------------------------------------4-2211-------------------------------------------------------431-1111-1-----------2------------------------------------235454345545423----44-332133233-12132111-11-1----3--------1--434454454444234434534324233334-1313322121223-4-------------2
4222122----------2-------111122----21-1-----1----------------32131122234243-3-----333113134-3112222121314---3-----3---1-2-1-1---111212-------333-1----1--------------4--------------2
--111111232221232---4-3235335--44--11-2131213---------3---22-2112121113112-34-----222111-12-1-11111-11113-3-----------1-24252221111233----------411-1213----3--111113--23-------3-----1-1-31-1-111---------------------------------------------24
---131133-1121---2---------------------------533-------5----3-1121411424455525553544-535332534-32132114343555555555555254
---111-1112122342---2---254211132-11111324313--2---334354442--3-1-------23--------3------11--3-221121-2--------4----53543
-----------------------3-----------------------------------33
-3-11-121111223333------2222121-55-13112214543-433--44----233
5311-1122141224-------3------------11--1--55-54-5--433-----------------------------------------2-11-1--11--------------2------------------------1211132-1--4555555252-----35-4----2------------------------------------4443522441--------------------------------------------------------------------------22
AAAAAAAAAAAAAABBBBBBBBBBCCCCCCCCCCCDDDDDDDDDDEEEEEEEEEEEEEEEE
Table IV: S u m m a r y o f C C A r e s u l t s .
Axis 1
Axis 2
Axis 3
Eigenvalues (λ)
0.017
0.010
0.006
Percentage of variance explained (%)
10.9
6.7
3.7
Cummulative variance (%)
10.9
17.7
21.4
Pearson correlation (species-environment)
Monte Carlo’s test (p)
32
LOBO, E.A. et al.
0.789
0.748
0.740
Eigenvalues
0.001
0.001
0.001
Species environment correlations
0.001
0.001
0.001
Use of epilithic diatoms as bioindicators from lotic ...
Table V: C a n o n i c c o e f f i c i e n t a n d i n t r a - s e t c o r r e l a t i o n s o f n i n e e n v i r o n m e n t a l v a r i a b l e s w i t h C C A a x e s 1 ,
2 and 3, with 35 biological variables.
Canonic Coefficient
Variable
Intra-set correlation
coefficient
Axis 1
Axis 2
Axis 3
Axis 1
Axis 2
Axis 3
Temperature
0.744
0.212
0.356
0.527
0.416
PH
0.241
-0.001
0.551
0.270
-0.575
0.012
Conductivity
0.125
0.475
-0.206
0.478
0.336
0.106
-0.467
0.486
Turbidity
0.100
0.530
-0.031
-0.001
0.610
Dissolved Oxygen
0.030
-0.028
-0.649
-0.169
-0.302
-0.711
Biochemical Oxygen Demand
0.200
-0.639
-0.039
0.557
-0.658
-0.201
Dissolved Inorganic Nitrogen
0.203
0.075
-0.369
0.494
-0.104
-0.607
Phosphate
-0.472
0.043
0.156
-0.635
0.213
0.362
Total Solids
-0.090
0.082
-0.294
0.155
0.125
-0.274
Table VI: TWINSPAN groups with respective abundant species and indicative values related to eutrophication.
SPECIES
Amphora montana Grunow
Frustulia cf. weinholdii Hustedt
TWINSPAN
GROUP
C
TOLERANCE TO INDICATIVE
EUTROPHICATION
VALUE
Very Low
1
Low
2
A
(Plate 3)
Medium
3
B
High
4
Very High
5
(Plate 1)
Luticola goeppertiana (Bleisch in Rabenhorst) D.G.Mann
Geissleria aikenenses (Patrick) Torgan et Oliveira
Rhopalodia gibberula (Ehrenberg) O.Muller
Surirella angusta Kützing
Ulnaria ulna (Nitzsch.) Compère
Cocconeis placentula Ehrenberg var. placentula
Encyonema silesiacum (Bleisch) D.G.Mann
D
(Plate 2)
Gomphonema angustum Agardh
Nitzschia amphibia Grunow
Planothidium rostratum (Oestrup) Lange- Bertalot
Adlafia bryophila (Petersen) Moser Lange-Bertalot &
Metzeltin
Amphipleura lindheimeri Grunow
Cocconeis placentula Ehrenberg var euglypta (Ehrenberg)
Grunow
Cyclotella meneghiniana Kützing
Cymbella affinis Kützing
Cymbella aff. hustedii Krasske
Diadesmis contenta (Grunow ex Van Heurck) D.G.Mann
Gomphonema cf. clevei Fricke
Melosira varians Agardh
Navicula cryptotenella Lange-Bertalot
Navicula gregaria Donkin
Navicula symmetrica Patrick
Nitzschia linearis (Agardh) W.Smith
Nitzschia palea (Kützing) W.Smith
Eolimna minima (Grunow) Lange-Bertalot
Fragilaria capucina Desmazieres var. rumpens (Kützing)
Lange-Bertalot
Gomphonema angustatum (Kützing) Rabenhorst
(Plate 4)
Gomphonema parvulum Kützing
Navicula rostellata Kützing
Achnanthes exigua Grunow var. exigua
Achnanthidium minutissimum (Kützing) Czarnecki
E
(Plate 5)
Mayamea atomus (Kützing) Lange-Bertalot
Sellaphora seminulum (Grunow) D.G.Mann
Acta Limnol. Bras., 16(1):25-40, 2004
33
vi is the species indicative value. Values of BWQI vary from 1 to 4 in aquatic environments:
0-0.9 (pollution absent), 1.0-1.4 (low pollution), 1.5-2.0 (moderate pollution), 2.1-2.7 (heavy
pollution) and 2.8- 4.0 (very heavy pollution).
The results generally confirmed conclusions by others studies in streams and
rivers in Europe. Sellaphora seminulum a n d Mayamea atomus, grouped among the species
with high tolerance to eutrophication were described by Van Dam et al. (1994) as species
characteristic of respectively eutrophic and hypereutrophic waters. The same authors
described A c h n a n t h e s e x i g u a var. e x i g u a a n d Achnantidium minutissimum a s s p e c i e s
with broad tolerance ranges, occurring successfully from oligotrophic to eutrophic
environments.
K e l l y & W h i t t o n ( 1 9 9 5 ) a s s i g n e d t h e i n d i c a t i v e v a l u e 5 t o Gomphonema parvulum
and small (< 1 2 m m ) s p e c i e s o f t h e g e n e r a Navicula a n d Sellaphora, qualified as typical
species of environments with phosphate values 0.3 mg/L. In the present study the same
tendency was found, with these species also showing, high and very high tolerances to
eutrophication. Kelly et al. (1996) reported C o cco ne is p la ce ntula as dominant species in
less eutrophic environments of the River Kennet, England a similar situation found in the
Studied Hydrographic Basin, showing low tolerance to eutrophication.
The development of biological methods to indicate running waters trophic levels
has been an important aim in diatom research in the past few years (Coring, 1999).
Trophic indices have been developed by Schiefele and Kohmann (1993) and Kelly &
Whitton (1995) in England. Both systems use weighted indicative values, which are related
to the nutrient load. Since phosphate is one of the most important variables affecting
running waters trophic levels, phosphate concentration is often used in the calibration of
the trophic index.
The Trophic Diatom Index (TDI) proposed by Kelly & Whitton (1995) and modified by
Kelly (1998) and Kelly & Harding (1999), has been widely used in the European Community,
especially after the publication of the EU Water Framework Directive, in 1991. TDI uses
the weighted average equations of Zelinka & Marvan (1961) to infer the epilithic diatom
community structure, related to nutrient concentration in the river water. In this case, the
relationship between species and environment was established from the analysis of the
graphs which sum up the percentages of occurrence of each species, against the phosphate
concentration in the water. Indicative values between 1 and 5 were given to each species,
according to the concentration in which they were mostly abundant. TDI values vary from
1 (very low nutrient concentration) to 5 (very high nutrient concentration).
According to Kelly & Whitton (1995), a functional index requires a measure of
eutrophication, as well as an indication of the proportion associated with organic pollution.
TDI fulfils this requirement, since organic pollution indication is done from the percentage
of valves of species characteristic of organically polluted waters, such as G o m p h o n e m a
parvulum, Navicula gregaria, Planothidium lanceolatum, and small forms of the genera
Navicula, Sellaphora a n d Nitzschia.
Compared to the use of trophic indices, the Biological Water Quality Index (BWQI)
incorporates an integrate response of the epilithic diatom community to the eutrophication
and organic contamination processes in Southern Brazilian rivers. Thus, system
recommended here is the first attempt to assess water quality in surface freshwaters in
Brazil, regarding both eutrophication and organic pollution.
Acknowledgements
Authors would like to thank Dr. Luc Ector from the Centre de Recherche Public –
Centre Universitaire, Centre de Recherche en Environnement et Biotechnologies,
Luxembourg, for reviewing the diatom taxa identified. We are also grateful to: Dra.
Denise de Campos Bicudo and the PhD student Carla Ferragut, from Botanic Institute,
São Paulo, for their valuable contributions and help with multivariate analyses; Mato
L e i t ã o m u n i c ipal administration for their logistic help; National Environmental Fund, for a
research grant; Biologists at University of Santa Cruz do Sul (UNISC) Patrícia Bender, Julia
Carina Niemeyer and Leon Maximiliano Rodrigues. Finally, the authors would like to thank
the team at the Water Analyses Laboratory, Analytic Centre, UNISC.
34
LOBO, E.A. et al.
Use of epilithic diatoms as bioindicators from lotic ...
Axis 2 (6,7%)
λ2 = 0,010 p2= 0,001
TWINSPAN
A
B
C
D
E
4
3
1
TURB
5
ºC
COND
PO4
-3
Axis 1 (10,9%)
λ1 = 0,017 p1 = 0,001
DIN
-1
1
2
pH BOD
5
-1
1
-3
F i g u r e 3 : Ordination graph based on Canonical Correspondence Analysis (CCA) of diatom samples (relative
abundances) in 61 sampling sites correlated to the most important environmental variables in the
ordination of axis 1 and 2 ( ºC: temperature; BOD: biochemical oxygen demand; COND: conductivity;
DIN: dissolved inorganic nitrogen; pH: hydrogen potential; PO4: phosphate; TURB: turbidity). Symbols
represent sampling sites TWINSPAN groups. Arrow indicates the phosphate eutrophication gradient
and numbers, within circles, the indicative values given to each group.
2
3
1
5
6
4
7
9
8
13
12
11
10
14
Plate 1. D i a t o m s s p e c i e s w i t h v e r y l o w t o l e r a n c e t o e u t r o p h i c a t i o n ( G r o u p C ) . F i g s . 1 - 3 . A m p h o r a m o n t a n a ;
F i g s . 4 - 5 . F r u s t u l i a c f . w e i n h o l d i i ; Fig. 6. R h o p a l o d i a g i b b e r u l a ; F i g s . 7 - 9 . G e i s s l e r i a a i k e n e n s i s ;
Figs. 10-11. Surirella ovata var. smithii; Figs. 12-13. Luticola goeppertiana; Fig. 14. Ulnaria ulna.
Scale bars correspond to 10 µm.
Acta Limnol. Bras., 16(1):25-40, 2004
35
17
15
16
18
19
20
21
Plate 2: Diatom species with low tolerance to eutrophication (Group D). Fig. 15. Cocconeis placentula
v a r . p l a c e n t u l a ; Fig. 16. E n c y o n e m a s i l e s i a c u m ; F i g . 1 7 . P l a n o t h i d i u m r o s t r a t u m ; F i g s . 1 8 - 1 9 .
Nitzschia amphibia; Figs. 20-21. Gomphonema angustum. Scale bar correspond to 10 µm.
25
26
23
24
27
28
29
22
30
33
34
32
35
31
36
37
41
42
39
38
40
Plate 3: Diatom species with medium tolerance to eutrophication (Group A). Figs. 22-23. Amphipleura
l i n d h e i m e r i ; Fig. 24. C o c c o n e i s p l a c e n t u l a v a r . e u g l y p t a ; F i g . 2 5 . A d l a f i a b r y o p h i l a ; Fig. 26.
Cymbella affinis; Figs. 27-29. Cymbella aff. hustedtii; Fig. 30. Nitzschia linearis; Figs. 31-32.
C y c l o t e l l a m e n e g h i n i a n a ; F i g . 3 3 - 3 4 . D i a d e s m i s c o n t e n t a ; F i g . 3 5 . N a v i c u l a g r e g a r i a ; Fig. 36.
N a v i c u l a c r y p t o t e n e l l a ; Fig. 37. N a v i c u l a s y m m e t r i c a Figs. 38-39. N i t s z c h i a p a l e a ; Fig. 40. M e l o s i r a
varians ; Figs. 41-42. Gomphonema c f . clevei . Scale bars correspond to 10µm.
36
LOBO, E.A. et al.
Use of epilithic diatoms as bioindicators from lotic ...
44
43
45
46
47
48
49
51
50
Plate 4. Diatom species with high tolerance to eutrophication (Group B). Figs. 43-44. Eolimna minima;
F i g s . 4 5 - 4 6 . G o m p h o n e m a a n g u s t a t u m ; F i g s . 4 7 - 4 8 . F r a g i l l a r i a c a p u c i n a v a r . r u m p e n s ; Fig. 49.
Navicula rostellata; Figs. 50-51. Gomphonema parvulum. Scale bar correspond to 10µm.
52
57
53
54
58
56
55
59
P l a t e 5 . D i a t o m s p e c i e s w i t h v e r y h i g h t o l e r a n c e t o e u t r o p h i c a t i o n ( G r o u p E ) . F i g s . 5 2 - 5 4 . Achnanthes
exigua; Figs. 55-56. S e l l a p h o r a s e m i n u l u m ; Figs. 57-58. Mayamaea atomus; Fig. 59. Achnanthidium
minutissimum. Scale bar correspond to 10 µm.
Acta Limnol. Bras., 16(1):25-40, 2004
37
References
American Public Health Association. 1999. Standard Methods for the Examination of water
and Wastewater. 20 ed. Washington.
Coring, E. 1999. Situation and developments of algal (diatom)-based techniques for
monitoring rivers in Germany. In: Prigiel, J., Whitton B. A & Bukowska, J. (eds) Use of
Algae for Monitoring Rivers III. Agence de l’Eau Artois-Picardie, France, p. 122-127.
Eloranta, P. & Soininen, J. 2002. Ecological status of some Finnish rivers evaluated using
benthic diatom communities. Journal of Applied Phycology, 1 4 : 1 - 7 .
Gomez, N. & Licursi, M. 2001. The Pampean Diatom Index (IDP) for assessment of rivers
and streams in Argentina. Aquatic Ecology, 35:173-181.
Hamm, A. 1969. Die Ermittlung der Gewässergüteklassen bei Fliebgewässen nach dem
Gewässergütesystem und Gewässergütenomogramm. Müncher Beiträge zur AbwasserFischerei-und Flussbiologie. 15:46-48.
Hill, M.O. 1979. TWINSPAN - A FORTRAN Program for Arranging Multivariate Data in an
Ordered Two-way Table by Classification of the Individuals and Atributes. Cornell
University, Ithaca, New York. 60p.
Kwandrans, J., Eloranta, P., Kawecka, B. & Wojtan, K. 1998. Use of benthic diatom communities
to evaluate water quality in rivers of southern Poland. Journal of Applied Phycology,
10:193-201.
Kelly, M.G. 2002. Role of benthic diatoms in the implementation of the Urban Wastewater
Treatment Directive in the River Wear, North-East England. Journal of Applied Phycology.
14:9-18.
Kelly, M.G., Whitton, B. A. & Lewis, A. 1996. Use of Diatoms to Monitor Eutrophication in
U.K Rivers. In: Whitton, B. A. & Rott, E. (eds.) Use of Algae for Monitoring Rivers II. Istitut
für Botanik, Universitãt Innsbruck, Innsbruck, p. 79-86.
Kelly, M.G. & Whitton, B. A. 1995. The trophic diatom index: a new index for monitoring
eutrophication in rivers. Journal of Applied Phycology. 7:433-444.
Kelly, M.G. 1998. Use of the trophic diatom index to monitor eutrophication in rivers.
Water Research, 3 2 : 2 3 6 - 2 4 2 .
Kelly, M.G. & Harding, J. P. C. 1999. Recent developments in algal-based monitoring in the
United Kingdom. In: Prigiel, J., Whitton B. A & Bukowska, J. (eds) Use of Algae for
Monitoring Rivers III. Agence de L’Eau Artois-Picardie, França, p. 26-34.
Kobayasi, H. & Mayama, S. 1982. Most pollution tolerant diatoms of severely polluted
rivers in the vicinity of Tokyo. Japanese Journal of Phicology, 30:188-196.
Krammer, K. 1997. Die Cymbelloiden Diatomeen. Eine Monographie der Werltweit be
Konnten Taxa Teil 1. Algem eineis und Encyonema Part. Bibliotheca Diatomologica
b a n d 3 6 . J. Cramer, stuttgart. 382p.
Krammer, K. 2000. Diatoms of Europe. Diatoms of the European Inland Waters and
Comparable Habitats. Lange-Bertalot, H. (ed) Volume 1: The Gennus Pinnularia. Koeltz
Scientific Books, Gantner Verlag, Königstein. 703p.
Krammer, K. 2002. Diatoms of Europe. Diatoms of the European Inland Waters and
Comparable Habitats. Lange-Bertalot, H. (ed) Volume 3: Cymbella. K o e l t z S c i e n t i f i c
Books, Gantner Verlag, Königstein. 584p.
Krammer, K. 2003. Diatoms of Europe. Diatoms of the European Inland Waters and
Comparable Habitats. Lange-Bertalot, H. (ed) Volume 4: Cymbopleura, Delicata,
Navicymbula, Gomphocymbellopsis, Afrocymbella. K o e l t z S c i e n t i f i c B o o k s , G a n t n e r
Verlag, Königstein. 530p.
Krammer, K. & Lange-Bertalot, H. 1986. Freshwater flora of Central Europe. Bacillariophyceae
2/1 Naviculaceae. (In German). Gustav Fischer Verlag, Stuttgart, 876p.
Krammer, K. & Lange-Bertalot, H. 1988. Freshwater flora of Central Europe. Bacillariophyceae
2/2 Epithemiaceae, Surirellaceae. (In German). Gustav Fischer Verlag, Stuttgart. 596 p.
K r a m m e r , K . & L a n g e - B e r t a l o t , H . 1 9 9 1 a. F r e s h w a t e r f l o r a o f C e n t r a l E u r o p e .
Bacillariophyceae 2/3 Centrales, Fragilariaceae, Eunotiaceae. (In German). Gustav Fischer
Verlag, Stuttgart. 576p.
38
LOBO, E.A. et al.
Use of epilithic diatoms as bioindicators from lotic ...
Krammer, K . & Lange-Bertalot, H. 1991b. 2/4 Achnanthaceae, critical statement about Navicula
(Lineolatae) and Gomphonema. Index of the known literature Part 1-4. (In German). Gustav
Fischer Verlag, Stuttgart. 437p.
Lange-Bertalot, H. 1993. 85 new taxa and much more than 100 taxonomic classifications
supplementary to freshwater flora of Central Europe V. 2/1-4. (In German). Bibliotheca
Diatomologica, 27. J. Cramer, Stuttgart. 454p.
La n g e - B e r t a l o t , H . 1 9 9 5 . T a x o n o m y . I c o n o g r a p h i a D i a t o m o l o g i c a v o l . 1 . ( E d . L a n g e B e r t a l o t , H . ) K o e l t z S c i e n t i f i c B o o k s . 1 0 7 p.
Lange-Bertalot, H. 1996 a. Indicators of Oligotrophy. Ecology-Diversity-Taxonomy.
Iconographia Diatomologica vol. 2. Lange-Bertalot, H. (ed) Koeltz Scientific Books. 390p.
L a n g e - B e r t a l o t , H . 1 9 9 6 b. Taxonomy. Iconographia Diatomologica vol. 4. L a n g e - B e r t a l o t ,
H. (ed) Koeltz Scientific Books. 287p.
Lange-Bertalot, H. 2001. Diatoms of Europe. Diatoms of the European Inland Waters and
Comparable Habitats. Lange-Bertalot, H. (ed) Volume 2: Navicula sensu stricto. 10 genera
Separated from Navicula sensu lato. Frustulia. Koeltz Scientific Books, Gantner Verlag,
Königstein. 526p.
Lange-Bertalot, H. & Metzeltin, D. 1996. Indicators of Oligotrophy. Ecology-DiversityTaxonomy. Iconographia Diatomologica vol. 2. L a n g e - B e r t a l o t , H . ( e d ) K o e l t z S c i e n t i f i c
Books. 390p.
Lange-Bertalot, H. & Moser, G. 1994. Brachysira – A Monograph of
Bibliotheca Diatomologica 2 9 . J. Cramer, Sttutgart, 212p.
genera. (In German).
Lange-Bertalot, H., Cavacini, P., Tagliaventi, N. & Alfinito, S. 2003. Diatoms of Sardinia.
Biogeography-Ecology-Taxonomy. Iconographia Diatomologica vol. 12. Lange-Bertalot,
H. (ed) Koeltz Scientific Books, Gantner Verlag, Königstein. 438p.
Lobo, E. A. & Leighton, G. 1986. Estructuras comunitarias de las fitocenosis planctónicas
de los sistemas de desembocaduras de rios y esteros de la Zona Central de Chile .
Revista de Biología Marina, Valparaíso, 22:1-29.
Lobo, E. A. & Ben da Costa. 1997. Estudo da qualidade da água do Rio Pardinho, Município
de Santa Cruz, Rio Grande do Sul, Brasil. Tecno-Lógica, Santa Cruz do Sul, 1:11-36.
Lobo, E. A. & Bender, P. 1998. Aplicabilidade de sistemas de sapróbios para avaliação da
qualidade de águas correntes fortemente poluídas, no sul do Brasil, utilizando
diatomáceas. Anais do IV Congresso Latino Americano de Ficologia, 1 9 9 6 . M i n a s G e rais: Brasil, 1:401-422.
Lobo, E. A. & Callegaro, V. L. 2000. Avaliação da qualidade de águas doces continentais
com base em algas diatomáceas epilíticas: Enfoque metodológico. p. 277- 300. In:
Tucci, C. E. M. e Marques, D. M. (eds) Avaliação e Controle da Drenagem Urbana. Porto
Alegre: Ed. Universidade/UFRGS. 558 p.
Lobo, E. A., Katoh, K. & Aruga, Y. 1995. R e s p o n s e o f e p i l i t h i c d i a t o m a s s e m b l a g e s t o w a t e r
pollution in rivers located in the Tokyo Metropolitan Area, Japan. Freshwater Biology,
34:191-204.
Lobo, E.A., Callegaro, V.L.M., Oliveira, M.A., Salomoni, S.E., Schuler, S. & Asai, K. 1996.
Pollution tolerant diatoms from lotic systems in the Jacui Basin, Rio Grande do Sul,
Brazil. Iheringia Série Botânica, Porto Alegre, 47:45-72.
Lobo, E.A., Ben da Costa, A. & Kirst, A. 1999. Avaliação da qualidade da água dos arroios
Sampaio, Bonito e Grande, Município de Mato Leitão, RS, Brasil, segundo a resolução
do CONAMA 20/86. Revista Redes, Santa Cruz do Sul, 4:129-146.
Lobo, E.A., Callegaro, V.L. & Bender, P. 2002. Utilização de algas diatomáceas epilíticas
como indicadoras da qualidade da água em rios e arroios da Região Hidrográfica do
Guaíba, RS, Brasil. Santa Cruz do Sul: EDUNISC. 127p.
Metzeltin, D. & Lange-Bertalot, H. 1998. Tropical Diatoms of South America I. DiversityTaxonomy-Geobotany. Iconographia Diatomologica vol. 5. Lange-Bertalot, H. (ed) Koeltz
Scientific Books, Gantner Verlag, Königstein. 695p.
Metzeltin, D. & Lange-Bertalot, H. 2002. Diatoms from the ‘Island Continent’ Madagascar.
Taxonomy-Biogeography-Diversity. Iconographia Diatomologica vol. 11. Lange-Bertalot,
H. (ed) Koeltz Scientific Books, Gantner Verlag, Köni g s t e i n . 2 8 6 p .
Acta Limnol. Bras., 16(1):25-40, 2004
39
McCune, B. & Mefford, M. J. 1999. PC-ORD. Multivariate Analysis of Ecological Data, Version 4.
MjM Software Design, Gleneden Beach, Oregon, USA. 237p.
Oliveira, M.A., Torgan, L., Lobo, E.A. & Schwarzbold, A. 2001. Association of periphitic
diatom species on artificial substrate in lotic environments in the Arroio Sampaio
basin, RS, Brazil: relationships with abiotic variables. Revista Brasiliera de Biologia,
61(4):523-540.
Pantle, R. & Buck, H. 1955. Die biologisch Oberwachung der Gewässer and die Darstellung
der Ergebnisse. Gas- u. Wasserfach, 96:604.
Rodrigues, L.M. & Lobo, E.A. 2000. Análise da estrutura de comunidades de diatomáceas
epilíticas no Arroio Sampaio, Município de Mato Leitão, RS, Brasil. Caderno de Pesquisa
Série Botânica, S a n t a C r u z d o S u l , 1 2 : 5 - 2 7 .
Round, F.E. 1993. A Review and Methods for the Use of Epilithic Diatoms for Detecting
and Monitoring Changes in River Water Quality. HMSO Publisher, London. 63p.
Rumrich, U., Lange-Bertalot, H. & Rumrich, M. 2000. Diatoms of the Andes. From Venezuela
to Patagonia/Tierra del Fuego. Iconographia Diatomologica vol. 9. L a n g e - B e r t a l o t , H .
(ed) Koeltz Scientific Books, Gantner Verlag, Königstein. 673p.
Schiefele, S. & Kohmann, F. 1993. Bioindikation der Trophie in Fliebgewassern.
Umweltforschungspaln des Bundesminister fur Umwelt, Naturschutz und
Reaktorsicherheit, Project Report 10201504, 3211p.
Schoeman, F. R. 1979. Diatoms as indicator of water quality in the upper Hennops River.
Journal of the Limnological Society of Southern Africa, 5: 73-78.
Schoeman, F. R. & Haworth, E. Y. 1986. Diatom as indicator of pollution. P r o c e e d i n g s o f
the Eighth International Diatom Symposium 1984. Ricard, M. (ed) Koeltz Scientific Books,
Koenigstein. p.757-766.
Shepherd, G. J. 1996. Fitopac 1: manual do usuário. Departamento de Botânica,
UNICAMP.
95p.
Simonsen, R. 1987. A t l a s a n d C a t a l o g u e o f t h e D i a t o m T y p e s o f F r i e d r i c h H u s t e d t .
V o l . 1 - 3 . J . Cramer, Berlin. 1741p.
Ter Braak, C. J. F. 1986. Canonical Correspondence Analysis: a new eigenvector technique
for multivariate direct gradient analysis. E c o l o g y, 6 7 : 1 1 6 7 - 1 1 7 9 .
Ter Braak, C. J. F. & Prentice, I. C. 1988. The theory of gradient analysis. Advances in
Ecological Research, 18:271-313.
Van Dam, H., Mertens, A. & Sinkeldam, J. 1994. A coded checklist and ecological indicator
values of freshwater diatoms from the Netherlands. Netherlands Journal of Aquatic
Ecology 28: 117-133.
Wegl, R. 1983. Index für die Limnosaprobitët. Wasser und Abwasser band, 26:1–175.
Wu, J. T. & Kow, L. T. 2002. Applicability of a generic index for diatom assemblages to
monitor pollution in the tropical Rivers Tsanwun, Taiwan. Journal of Applied Phycology,
14:63-69.
Zelinka, M. & Marvan, P. 1961. Zur Prazisierung der biologischen Klassifikation der Reinheit
fliessender Gewasser. Archiv für Hydrobiologie , 5 7 : 3 8 9 - 4 0 7 .
Received: 29 April 2003
Accepted: 20 October 2003
40
LOBO, E.A. et al.
Use of epilithic diatoms as bioindicators from lotic ...
Baixar