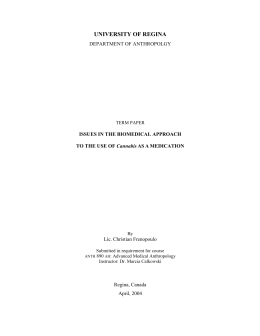
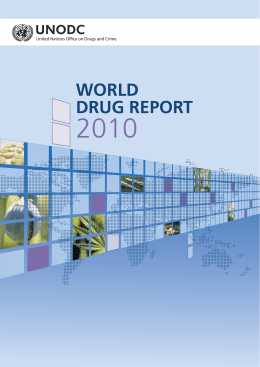
Ann Ist Super Sanità 2005;41(4):483-485
δ9 THC content in illicit cannabis products
over the period 1997-2004 (first four months)
Manuela LICATA, Patrizia VERRI and Giovanni BEDUSCHI
Servizio di Medicina Legale, Policlinico,
Università degli Studi di Modena e Reggio Emilia, Modena, Italy
Summary. - The aim of this study is to determine delta 9 tetrahydrocannabinol (δ9 THC) content in 5227
seizures of cannabis products over the period 1997-2004 (first four months). The products were seized in
Modena country (Italy). The samples were classified as marijuana and hashish and divided into subgroups. The
following results show an increase in the potency (concentration of δ9 THC) of these products.
Key words: forensic science, cannabis, analysis, δ9 THC potency.
Riassunto (Variazioni della percentuale di δ9 THC nelle preparazioni clandestine di Cannabis - periodo
1997-2004 - primo quadrimestre). - Sono riferiti i risultati delle determinazioni di delta 9 tetraidrocannabinolo (δ9 THC) in 5227 reperti di derivati della cannabis sequestrati nel periodo 1997-2004 (primo quadrimestre)
nel territorio modenese. I campioni sono stati classificati come marijuana e hashish e suddivisi in sottogruppi.
Si presentano i risultati che documentano l’incremento della potenza (concentrazione di δ9 THC) delle
preparazioni clandestine.
Parole chiave: scienze forensi, cannabis, analisi, potenza δ9 THC.
Introduction
Materials and Methods
Spreading of cannabis products (marijuana and hashish), in particular among the young generations, is increasingly being studied in epidemiological surveys [1, 2].
According to recent studies the demand for
treatment of cannabis related disorders (tendency to
suicide, depression and deviations) [3-6] has risen.
Other epidemiological data, and in particular those of
increased THC contents in illicit cannabis products,
explain the “cannabis alarm” [7].
The marijuana sample’s potency (δ9 THC
concentration) [7] has increased from 1.5% (1980) to
4.2% (1997). Furthermore, the DEA (Drug
Enforcement Administration) warns of a 1% increase
over the 1970-1980 decade, a 6% increase in 2002 and
a 13% increase in the sinsemilla variety (with some
samples showing a 33% increase) [2].
The aim of this study is to determine delta 9 tetrahydrocannabinol (δ9 THC) content in 5227 seizures of
cannabis products detained in Modena country (Italy)
over the period 1997-2004 (first four months). This
report shows the potency trends of δ9 THC.
Samples
Marijuana and hashish samples were seized by the
police in Modena country over the period 1997-2004
(from January to April). On the Court’s demand, they
were analysed by the Institute of Forensic Medicine
University of Modena and Reggio Emilia.
Firstly, the samples were classified according to
their morphologic characteristics, following in part the
Mahmoud A classification system [7].
Due to the characteristics of our samples, we
decided to change something in that method: thus the
samples were classified as follows:
1. marijuana: general definition regarding four products:
- “loose marijuana”: samples which are not
compressed, nor chopped, with no definite form;
- “kilobricks”: samples of pressed cannabis made
of leaves, heads, stems, seeds;
- “buds”: samples made of flowering heads;
- “domestic marijuana” locally prepared cannabis
products.
Indirizzo per la corrispondenza (Address for correspondence): Manuela Licata, Servizio di Medicina Legale, Università degli Studi,
Policlinico, Modena e Reggio Emilia, Italy, Via del Pozzo 71, 41100 Modena. E-mail: [email protected].
484
Manuela LICATA, Patrizia VERRI and Giovanni BEDUSCHI
2. hashish: resin of cannabis plant, colour from
light to dark brown, two types:
- samples of hashish cut into sticks;
- samples of hashish cut into bars (from 0.8 to 2.5
cm thick).
Sample analysis
Marijuana: after removing both the stems and
seeds, 0.1g sample was extracted, at room temperature
for one hour, with 10 ml of petroleum ether (C. Erba®
Italy) containing docosane (SI) (1mg/ml) (Sigma
Aldrich®). One microlitre of the filtered solution was
injected by gas chromatography and gas chromatography mass spectrometry.
Hashish: samples, finely hashed, were analysed
with the same method as the marijuana samples. One
microlitre was iniected in gas chromatography and in
gas chromatography mass spectrometry.
Analysis by gas chromatography
Varian® gas chromatograph CP3880 with FID
detector, DB5 column, J&W Scientific, Inc. (30 m x
0.25 mm i.d 0.25 µm film thickness) under the
following conditions:
- initial temperature 150°C (1 min), programmed
temperature 10°C/min, final temperature 290°C (2 min).
- temperature of the injector: 200°C in split mode
(50 ml/min; split ratio 30:1).
- temperature of detector 300 °C.
Quantitative examination has been done with
calibration curve made by certificated standard (delta 9
THC SALARS® Como Italy) to the concentrations: of
0.1; 0.5;1; 2; 3 mg/ml.
Excepted from some rare cases the seizures were
modest or small in quantity (from 20 to 5 g); Table1
shows the number of seizures for each subgroup of
products and for each year.
Delta 9 THC content of marijuana samples goes
from an average of 2.5% in 1997 to 15% in 2004.
About prevalence of some subgroup of products
during years we detect: in 2002, we can find a
prevalence of flowering heads with a high THC
content and the appearance onto the market of selected
home-produced marijuana strains while the kilobricks
- pressed marijuana - which were significantly present
on the illicit market, disappear in that year.
The following diagram shows the different THC
content of the several product of marijuana: in 1997,
55% of the samples had a δ9 THC content of 0.5-3%
and these percentages were the highest until 2001
excepted for the year 2000 in which 61% of the
samples showed a percentage of 3-8%. Over the period
2002-2003, 53-58% of the samples were characterized
by a 8-13% THC content, with some samples showing
a potency higher than 20%.
In first four months of 2004, 57% of the sample had
a δ9 THC content of 13-20% (Fig. 1).
The same evaluation was carried out with hashish
seizures: the variation of THC content in hashish
samples as well has its rising trend over the period
considered; yet, if in 1997 the average content was of
4.5%, in 2004 it rose to 15.3%. The variation between
two types (sticks or bars) in which hashish is sold on the
illicit market, is narrow and probably caused by the
deterioration of active ingredient. As to samples’
distribution, Fig. 2 shows that until 2002 half samples
120
Analysis by gas chromatography
mass spectrometry
Results
Over the period 1997-2004 (first four months), we
analysed 4280 samples of hashish and 947 samples of
marijuana.
80
% of sample
Varian® 3400 gas chromatograph with Saturn 2000
mass detector equipped with DB5MS J & W (30 m x
0.25 mm i.d 0.25 µm film thickness) column under the
following conditions:
- programmed temperature 120°C/1 min; rate
10°/min to 290°C/10 min;
- injector temperature: 250°C spitless;
- transfer line 280°C;
- layout in full scan range m/z 43-500.
100
0,5-3%
3-8%
8-13%
13-20%
>20%
60
40
20
0
1997 1998 1999 2000 2001 2002 2003 2004*
Year
Fig. 1. - Distribution of marijuana samples on the basis
of their δ9THC content.
δTHC CONTENT IN ILLICIT CANNABIS PRODUCTS
485
Table 1. - Number of seizures for each subgroup of products and for each year
Year
Marijuana
Loose
Hashish
Kilobrick
Buds
Home produced
Sticks
Bars
1997
5
11
17
8
120
7
1998
3
119
7
0
113
35
1999
3
257
7
1
276
8
2000
20
28
89
24
165
220
2001
2
46
22
2
338
170
2002
3
55
57
16
473
69
2003
6
0
20
21
260
1858
2004*
2
0
26
70
120
48
* first four months.
had a δ9 THC content of 4-8%. From that point onwards,
we can see samples of higher potency (13-20% of δ9
THC) and in particular, in 2004 (from January to April),
we find percentages of 13-20% in 44% of samples and a
δ9 THC content over 20% in 20% of samples.
Conclusion
Evaluation of cannabis samples show, over the period
1997-2000, a moderate fluctuation in the potency of
hashish (from 4.5% of δ9 THC to 6%) and a rise in that of
marijuana (from 2.5% of δ9 THC to 7%). The trend over
the period 2002-2004 shows a remarkable increase of the
potency with mean δ9 THC values from 10.7% to 15% in
marijuana and a range from 9.8% to 15.3% in hashish.
100
90
80
0,5-4%
4-8%
8-13%
13-20%
>20%
% of sample
70
Our study shows that until 2002 medium δ9 THC
potency of marijuana is like to δ9 THC potency of hashish.
As we show after 2002, most of seizures has a mean
active ingredient content higher than 8%, that the trend
is climbing to 13% and in some cases touches 20%.
Chemical analysis of confiscated material becomes
important to understanding health problems associated
with drug abuse.
Increase of δ9 THC potency in all cannabis products
will be an important element to understand adverse affects
of drug use and abuse and value treatment possibility.
About marijuana, our study show percentages of δ9
THC potency higher than in the past. These results
improve increasing preoccupations about psycophysical effects of drug use and abuse.
Received on 28 February 2005.
Accepted on 19 July 2005.
REFERENCES
1.
European Monitoring Centre for drug and drug addiction.
Annual Report 2004: The state of the drugs problem in the
European Union and Norway. EMCDDA; 2004.
2.
Office of National Drug Control Policy. What Americans need to
know about marijuana. Annual Report ONDCP; 2003.
3.
Rey J, Tennant CH. Cannabis and mental health. British Medical
Journal 2002;325:1183-4.
4.
Van Os J & Co. Cannabis use and psychosis: a longitudinal
population based study. Am J Epidemiol 2002;156:319-27.
5.
Stefanis NC, Delespaul P, et al. Early adolescent cannabis
exposure and positive and negative dimensions of psychosis.
Addiction 2004;99:1333-41.
6.
Ferrguson DM, Horwood J, Swain-Campbell N. Cannabis use
and psychosocial adjustment in adolescence and young
adulthood. Addiction 2002;97:1121-35.
7.
Mahmoud A, & Co. Potency trend of ∆9 THC and other
cannabinoids in confiscated marijuana from 1980-1997. J
Forensic Sci 2000;45(1):24-30.
60
50
40
30
20
10
0
1997 1998 1999 2000 2001 2002 2003 2004*
Year
Fig. 2. - Distribution of hashish samples as to their
δ9THC content. * First four months.
Baixar