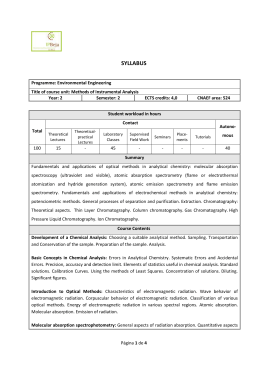
Filtração em gel: separação por faixas de PM
Figure 4.3. Gel Filtration Chromatography. A mixture of proteins in a small volume is applied to a column
filled with porous beads. Because large proteins cannot enter the internal volume of the beads, they emerge
sooner than do small ones
Carga?
(histonas = +)
Cromatografia
de troca iônica
+
-
Figure 4.4. Ion-Exchange Chromatography. This technique separates proteins mainly according to their net
charge
Substrato?
Cromatografia
de afinidade
Figure 4.5. Affinity Chromatography. Affinity chromatography of
concanavalin A (shown in yellow) on a solid support containing
covalently attached glucose residues (G).
Colunas de material finamente dividido
•
•
muito mais sítios de interação
tempo “infinito” de purificação...
Solução: HPLC
High-Pressure Liquid Chromatography
Figure 4.6. High-Pressure Liquid Chromatography
(HPLC). Gel filtration by HPLC clearly defines the
individual proteins because of its greater resolving
power: (1) thyroglobulin (669 kd), (2) catalase (232 kd),
(3) bovine serum albumin (67 kd), (4) ovalbumin (43
kd), and (5) ribonuclease (13.4 kd).
A Atividade Específica aumenta com a purificação
OD 340nm
Atividade Enzimática (Unidades):
• x aumento de OD por minuto
Atividade Específica:
• unidades por miligrama de proteína
Eletroforese
Verificação de Massa Molecular
Eletroforese é usada para monitorar a
purificação com colunas
1
2
3
4
5
Figure 4.13. Electrophoretic Analysis of a Protein Purification. The purification scheme in Table 4.1 was
analyzed by SDS-PAGE. Each lane contained 50 mg of sample. The effectiveness of the purification can be
seen as the band for the protein of interest becomes more prominent relative to other bands.
Gel bi-dimensional
Passo n°1: Focalisação Isoelétrica
• separação por pI, ponto isoelétrico, onde carga = 0
Figure 4.11. The Principle of Isoelectric Focusing. A pH gradient is established in a gel before loading the
sample. (A) The sample is loaded and voltage is applied. The proteins will migrate to their isoelectric pH, the
location at which they have no net charge. (B) The proteins form bands that can be excised and used for
further experimentation.
Passo nº2: PAGE
Figure 4.12. Two-Dimensional Gel Electrophoresis. (A) A protein sample is initially fractionated in one
dimension by isoelectric focusing as described in Figure 4.11. The isoelectric focusing gel is then attached to
an SDS-polyacrylamide gel, and electrophoresis is performed in the second dimension, perpendicular to the
original separation. Proteins with the same pI are now separated on the basis of mass. (B) Proteins from E.
coli were separated by two-dimensional gel electrophoresis, resolving more than a thousand different
proteins. The proteins were first separated according to their isoelectric pH in the horizontal direction and
then by their apparent mass in the vertical direction.
Matrix-assisted laser desorption-ionization (MALDI)
Time of flight (TOF)
Figure 4.16. MALDI-TOF
Mass Spectrometry. (1)
The protein sample,
embedded in an
appropriate matrix, is
ionized by the application
of a laser beam. (2) An
electrical field accelerates
the ions formed through
the flight tube toward the
detector. (3) The lightest
ions arrive first. (4) The
ionizing laser pulse also
triggers a clock that
measures the time of flight
(TOF) for the ions.
ESPECTROMETRIA DE MASSA
+ GENOMA = TDB
MALDI-TOF:
Bom e... barato
5 pmol de mistura I + L
Gel 2D, PM de fragmentos + PM bioinformático = 80% sucesso
Figure 4.17. MALDI-TOF Mass Spectrum of Insulin and b -lactoglobulin. A mixture of 5 pmol each of
insulin (I) and b-lactoglobulin (L) was ionized by MALDI, which produces predominately singly charged
molecular ions from peptides and proteins (I + H+ for insulin and L + H+ for lactoglobulin). However,
molecules with multiple charges as well as small quantities of a singly charged dimer of insulin, (2 I + H) +,
also are produced.
Seqüenciamento químico
Degradação de Edman
(ligação com PTH)
Phenil isothiocyanate
Figure 4.22. Separation of PTH-Amino Acids. PTHamino acids can be rapidly separated by high-pressure
liquid chromatography (HPLC). In this HPLC profile, a
mixture of PTH-amino acids is clearly resolved into its
components. An unknown amino acid can be identified by
its elution position relative to the known ones.
Utilidade dos anticorpos
Western Blot
Figure 4.36. Western Blotting. Proteins on an SDS-polyacrylamide gel are transferred to a polymer sheet
and stained with radioactive antibody. A band corresponding to the protein to which the antibody binds
appears in the autoradiogram
ELISA: quantificações
Figure 4.35. Indirect ELISA and Sandwich ELISA (A) In indirect ELISA, the production of color
indicates the amount of an antibody to a specific antigen. (B) In sandwich ELISA, the production of color
indicates the quantity of antigen
Imunofluorescência: localização
Figure 4.34. Fluorescence Micrograph of a Developing Drosophila
Embryo. The embryo was stained with a fluorescent-labeled
monoclonal antibody for the DNA-binding protein encoded by
engrailed, an essential gene in specifying the body plan.
Figure 4.39. Immunoelectron
Microscopy. The opaque particles
(150-Å, or 15-nm, diameter) in this
electron micrograph are clusters of
gold atoms bound to antibody
molecules. These membrane vesicles
from the synapses of neurons contain a
channel protein that is recognized by
the specific antibody
Figure 4.37. Actin Filaments. Fluorescence micrograph of actin
filaments in a cell stained with an antibody specific to actin
Figure 4.51. Myoglobin
Crystal and X-Ray. (A)
Crystal of myoglobin. (B) Xray precession photograph of a
myoglobin crystal.
Cristalografia
Figure 4.52. Section of the Electron-Density Map of
Myoglobin. This section of the electron-density map shows the
heme group. The peak of the center of this section corresponds to
the position of the iron atom.
Figure 4.43. Basis of NMR Spectroscopy. The energies
of the two orientations of a nucleus of spin (such as 31P and
1H) depend on the strength of the applied magnetic field.
Absorption of electromagnetic radiation of appropriate
frequency induces a transition from the lower to the upper
level.
1/
2
NMR (RMN)
Domínios até 15 kDa (55 aa)
Figure 4.44. One-Dimensional NMR Spectra. (A) 1H-NMR spectrum of ethanol (CH3CH2OH) shows that
the chemical shifts for the hydrogen are clearly resolved. (B) 1H-NMR spectrum from a 55 amino acid
fragment of a protein with a role in RNA splicing shows a greater degree of complexity. A large number of
peaks are present and many overlap. [(A) After C. Branden and J. Tooze, Introduction to Protein Structure
(Garland, 1991), p. 280; (B) courtesy of Barbara
Baixar