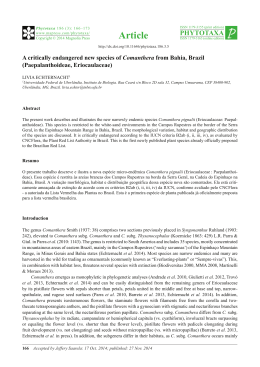
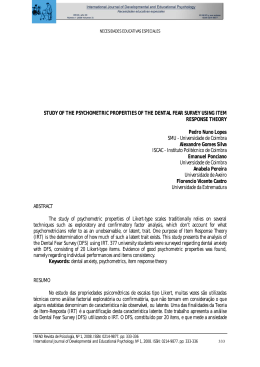
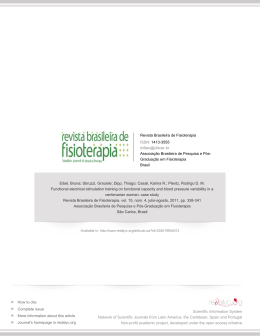
Sandro Mango Norim
PHASE DEPENDENT MOTOR EXCITABILITY
TMS APPLIED IN DIFFERENT tACS PHASES
Master Thesis of Biomedical Engineering, specialization in Biomedical Instrumentation and Biomaterials,
supervised by Prof. Dr. Alireza Gharabaghi and Prof. Dr. Paulo Crespo, presented to the Department
of Physics of the Faculty of Sciences and Technology of the University of Coimbra
September, 2015
Sandro Mango Norim
Phase Dependent Motor Excitability
TMS applied in different tACS phases
A thesis submitted in fulfilment of the requirements
for the degree of Master of Science
in the
University of Coimbra
Supervisors:
Prof. Dr. Alireza Gharabaghi (University of Tuebingen)
Prof. Dr. Paulo Crespo (University of Coimbra)
Coimbra, 2015
This work was developed in collaboration with :
Eberhard Karls Universität Tübingen
Werner Reichardt Centrum Für
Integrative Neurowissenschaften
i
Esta cópia da tese é fornecida na condição de que quem a consulta reconhece
que os direitos de autor são pertença do autor da tese e que nenhuma citação ou
informação obtida a partir dela pode ser publicada sem a referência apropriada.
This copy of the thesis has been supplied on condition that anyone who consults
it is understood to recognize that its copyright rests with its author and that no
quotation from the thesis and no information derived from it may be published
without proper acknowledgement.
ii
Dedicated to my Parents and my Grandma Rosa.
Acknowledgements
I would like to sincerely thank Prof. Dr. Alireza Gharabaghi for his willingness
to provide me with this opportunity to work with the Neuroprosthetics Research
Group, Valerio Raco for the study design and the support in the programming
part, to Srikandarajah Tharsan for helping with the measurements and to all of
my Colleagues that have taught me the techniques required to perform this study,
specially to Vladislav Royter and Ali Soleimanpour for being amazing office mates
that were always ready to help me and also share with me their work, which was
important to acquire some extra knowledge beyond the one needed for my project.
Although not directly involved in the project I would like also to thank Prof.
Dr. Paulo Crespo for being always motivating about this challenging decision of
making my final project abroad and the feedback given, to Maria Teresa Leão
that was my first contact in Tuebingen and strongly supported me during the
application process for this project also to Dr. Robert Bauer for the support
during the application and feedback given.
iv
“We’ve begun to blur the boundaries between humans and devices, and that will
lead to a profound clinical effect for people with physical disabilities.”
Hugh Herr
UNIVERSITY OF COIMBRA
Abstract (EN)
Faculty of Sciences and Technology
Department of Physics
Master of Science
Phase Dependent Motor Excitability:
TMS applied in different tACS phases
by Sandro Norim
Background: Non-invasive brain stimulation has proven to modulate brain activity
as well as motor excitability. Experimental results depend on several parameters,
such as time after a given event, stimulation intensities or frequency. Stimulation
effects depend on the precise timing the stimulus are applied in a so called Brain
State Dependent Stimulation (BSDS).
Objective: Observe the excitability changes in the stimulus response curves (SRCs)
of a transcranial magnetic stimulation (TMS) intensities set, in which the pulse is
triggered at determined wave phase. This study aims to contribute for a solution
to neurological disorders, in this case, motor related disorders.
Methods: A 20 Hz transcranial alternate current stimulation (tACS), was applied
over primary motor cortex (M1) to increase the phase stability of the sensorimotor
β rhythms (13 to 30 Hz). TMS was applied at four different phases of a 20 Hz
wave signal. The motor evoked potentials (MEPs) are recorded from the extensor
digitorum communis (EDC) and the parameters of the SRC’s were analysed for
each phase and the state pre and post intervention.
Results: Although no significant difference between the phases parameters was
observed, there was a significant difference between the pre and post SRCs.
Conclusions: The combination of tACS and TMS results in a significant increase
of the corticomuscular excitability. Further work should be done to evaluate the
contribution of each of the stimulations involved and verify if the potentiation
observed in excitability is a long-term potentiation (LTP).
UNIVERSIDADE DE COIMBRA
Abstract (PT)
Faculdade de Ciências e Tecnologia
Departamento de Fı́sica
Mestre em Ciências
Excitabilidade Motora Dependente da Fase:
TMS aplicada em diferentes fases de tACS
por Sandro Norim
Background: A estimulação cerebral não invasiva tem vindo a ser utilizada para
modular a atividade cerebral assim como a excitabilidade motora. Os resultados experimentais dependem de vários parâmetros, como o tempo após um dado
evento, a intensidade da estimulação ou a frequência. Os efeitos da estimulação
dependem do intervalo de tempo em que esta é aplicada após um dado estado
neuronal ser atingido numa então chamada, estimulação cerebral dependente do
estado (BSDS).
Objetivo:Observar as diferenças na excitabilidade motora através das curvas de
estimulo resposta (SRC) duma serie de diferentes intensidades de estimulação
magnética transcraniana (TMS), na qual os pulsos foram aplicados em determinadas fases da onda produzida pela estimulação transcraniana de corrente alternada (tACS). Este estudo visa contribuir para solucionar problemas neuronais,
neste caso, relacionados com a atividade motora.
Métodos: tACS a 20 Hz, foi aplicada sobre o córtex motor principal (M1) para
estabilizar os ritmos sensorimotores β (13 a 30 Hz). TMS foi aplicada em quatro
diferentes fases da onda de 20 Hz. Potenciais motores evocados (MEPs) do extensor digitorum communis (EDC) foram registados e curvas estimulo-resposta (SR)
foram traçadas de forma a comparar os resultados de cada fase e do estado pré e
pós intervenção.
Resultados: Pulsos de TMS aplicados em fases especificas de tACS resultam em
diferenças nas SRC’s dos diferentes sujeitos. Não foi observada uma differença
significativa entre os resultados relativos às fases mas houve uma diferença significante entre as curvas traçadas para o pré e pós intervenção.
Conclusões: A combinação de tACS com TMS resulta num aumento significativo da excitabilidade corticomuscular. Trabalho futuro deverá ser realizado, para
avaliar a contribuição de cada uma das estimulações envolvidas assim como verificar se a potenciação observada na excitabilidade é uma potenciação longo prazo
(LTP).
Abbreviations
TMS
Transcranial Magnetic Stimulation
tACS
transcranial Alternate Current Stimulation
FDI
First Dorlsal Interosseous
EDC
Extensor Digitorum Communis
BCI
Brain Computer Interface
ISI
Inter Stimuli Interval
RMT
Resting Motor Threshold
MEP
Motor Evoked Potential
FES
Functional Electrical Stimulation
MI
Motor Imagery
SRC
Stimulus Response Curve
MRI
Magnetic Resonance Imaging
ix
Contents
Declaration of Authorship
ii
Acknowledgements
iv
Abstract (English)
vi
Abstract (Portuguese)
vii
Abbreviations
ix
Contents
x
List of Figures
xii
1 Introduction
1.1 Motivation . . . . . . . . . . . . . . . . . . . .
1.2 State of Research . . . . . . . . . . . . . . . .
1.2.1 TMS . . . . . . . . . . . . . . . . . . .
1.2.2 Stimulus Response Curves . . . . . . .
1.2.3 tACS . . . . . . . . . . . . . . . . . . .
1.2.4 The Beta Band . . . . . . . . . . . . .
1.2.5 Stimulation effects depend on the brain
1.3 Goals and Outline . . . . . . . . . . . . . . . .
.
.
.
.
.
.
.
.
1
1
2
2
6
7
9
10
10
.
.
.
.
.
.
13
13
13
14
15
16
17
2 Protocol I: Materials and Methods
2.1 Participants . . . . . . . . . . . . .
2.2 EMG recording . . . . . . . . . . .
2.3 TMS . . . . . . . . . . . . . . . . .
2.4 tACS . . . . . . . . . . . . . . . . .
2.5 Experimental Protocol . . . . . . .
2.6 Experimental Setup . . . . . . . . .
x
.
.
.
.
.
.
.
.
.
.
.
.
.
.
.
.
.
.
.
.
.
.
.
.
.
.
.
.
.
.
.
.
.
.
.
.
. . . .
. . . .
. . . .
. . . .
. . . .
. . . .
state .
. . . .
.
.
.
.
.
.
.
.
.
.
.
.
.
.
.
.
.
.
.
.
.
.
.
.
.
.
.
.
.
.
.
.
.
.
.
.
.
.
.
.
.
.
.
.
.
.
.
.
.
.
.
.
.
.
.
.
.
.
.
.
.
.
.
.
.
.
.
.
.
.
.
.
.
.
.
.
.
.
.
.
.
.
.
.
.
.
.
.
.
.
.
.
.
.
.
.
.
.
.
.
.
.
.
.
.
.
.
.
.
.
.
.
.
.
.
.
.
.
.
.
.
.
Contents
xi
3 Protocol I: Problems and solutions
3.1 Online data quality check . . . . . . . . . . . . . . . . . . . . . . .
3.2 Exponential SRC’s problem . . . . . . . . . . . . . . . . . . . . . .
3.3 Functional movement stability . . . . . . . . . . . . . . . . . . . . .
19
19
20
22
4 Protocol II: Materials and
4.1 Participants . . . . . . .
4.2 EMG recording . . . . .
4.3 TMS . . . . . . . . . . .
4.4 tACS . . . . . . . . . . .
4.5 Experimental Protocol .
4.6 Experimental Setup . . .
.
.
.
.
.
.
23
23
24
24
25
25
27
.
.
.
.
29
29
30
32
33
5 Protocol II: Results
5.1 Online data analysis
5.2 SRC’s . . . . . . . .
5.3 ANOVA test . . . . .
5.4 Discussion . . . . . .
.
.
.
.
.
.
.
.
Methods
. . . . . .
. . . . . .
. . . . . .
. . . . . .
. . . . . .
. . . . . .
.
.
.
.
.
.
.
.
.
.
.
.
.
.
.
.
.
.
.
.
.
.
.
.
.
.
.
.
.
.
.
.
.
.
.
.
.
.
.
.
.
.
.
.
.
.
.
.
.
.
.
.
.
.
.
.
.
.
.
.
.
.
.
.
.
.
.
.
.
.
.
.
.
.
.
.
.
.
.
.
.
.
.
.
.
.
.
.
.
.
.
.
.
.
.
.
.
.
.
.
.
.
.
.
.
.
.
.
.
.
.
.
.
.
.
.
.
.
.
.
.
.
.
.
.
.
.
.
.
.
.
.
.
.
.
.
.
.
.
.
.
.
.
.
.
.
.
.
.
.
.
.
.
.
.
.
.
.
.
.
.
.
.
.
.
.
.
.
.
.
.
.
.
.
.
.
.
.
.
.
.
.
.
.
.
.
.
.
.
.
.
.
.
.
6 Conclusion and future directions
35
A Written Consent
39
B TMS Assessment
41
C Edinburgh Handedness Inventory
45
Bibliography
47
List of Figures
1.1
1.2
1.3
1.4
1.5
1.6
1.7
TMS . . . . . . .
Coil orientation .
TMS hotspot . .
LTP . . . . . . .
tACS current flow
Entrainment . . .
Beta ERD . . . .
.
.
.
.
.
.
.
.
.
.
.
.
.
.
.
.
.
.
.
.
.
.
.
.
.
.
.
.
.
.
.
.
.
.
.
.
.
.
.
.
.
.
.
.
.
.
.
.
.
.
.
.
.
.
.
.
.
.
.
.
.
.
.
.
.
.
.
.
.
.
.
.
.
.
.
.
.
.
.
.
.
.
.
.
.
.
.
.
.
.
.
.
.
.
.
.
.
.
.
.
.
.
.
.
.
.
.
.
.
.
.
.
.
.
.
.
.
.
.
.
.
.
.
.
.
.
.
.
.
.
.
.
.
.
.
.
.
.
.
.
.
.
.
.
.
.
.
.
.
.
.
.
.
.
.
.
.
.
.
.
.
.
.
.
.
.
.
.
.
.
.
.
.
.
.
.
.
.
.
.
.
.
.
.
.
.
.
.
.
.
.
.
.
.
.
.
3
4
4
5
7
8
9
2.1
2.2
2.3
2.4
2.5
EMG Setup . . . . . . . . . . . .
tACS electrodes . . . . . . . . . .
Target Phases . . . . . . . . . . .
TMS - tACS synchronization . . .
Experimental setup of protocol I .
.
.
.
.
.
.
.
.
.
.
.
.
.
.
.
.
.
.
.
.
.
.
.
.
.
.
.
.
.
.
.
.
.
.
.
.
.
.
.
.
.
.
.
.
.
.
.
.
.
.
.
.
.
.
.
.
.
.
.
.
.
.
.
.
.
.
.
.
.
.
.
.
.
.
.
.
.
.
.
.
.
.
.
.
.
.
.
.
.
.
.
.
.
.
.
14
15
16
17
18
3.1
3.2
TMS pulse detection problem . . . . . . . . . . . . . . . . . . . . . 20
Exponential SRC’s . . . . . . . . . . . . . . . . . . . . . . . . . . . 21
4.1
4.2
4.3
EMG Setup . . . . . . . . . . . . . . . . . . . . . . . . . . . . . . . 24
TMS - tACS synchronization . . . . . . . . . . . . . . . . . . . . . . 26
Experimental setup of protocol II . . . . . . . . . . . . . . . . . . . 27
5.1
5.2
5.3
5.4
5.5
5.6
Control screen . . . . . . . . . . .
Single subject SRC’s . . . . . . .
Exponential single subject SRC’s
Range ANOVA . . . . . . . . . .
Threshold ANOVA . . . . . . . .
Slope ANOVA . . . . . . . . . . .
6.1
Robotic TMS . . . . . . . . . . . . . . . . . . . . . . . . . . . . . . 37
xii
.
.
.
.
.
.
.
.
.
.
.
.
.
.
.
.
.
.
.
.
.
.
.
.
.
.
.
.
.
.
.
.
.
.
.
.
.
.
.
.
.
.
.
.
.
.
.
.
.
.
.
.
.
.
.
.
.
.
.
.
.
.
.
.
.
.
.
.
.
.
.
.
.
.
.
.
.
.
.
.
.
.
.
.
.
.
.
.
.
.
.
.
.
.
.
.
.
.
.
.
.
.
.
.
.
.
.
.
.
.
.
.
.
.
30
31
31
32
32
33
Chapter 1
Introduction
1.1
Motivation
Non-invasive neurostimulation can modulate neuronal activity and disrupt the
natural wave patterns of the brain. There are two main techniques used in this
field, transcranial magnetic stimulation (TMS) and trancranial current stimulation
(tCS), their capacity of changing brain plasticity1 is well known and the research
for their therapeutic usage has exponentially grown over the last two decades.
This techniques are widely used as a research tool to study aspects of human brain
physiology including motor function, vision, language and the pathophysiology of
brain disorders. It’s also used for therapy, for instance in motor related disorders,
like the ones provoked by stroke, and in psychiatry, for problems as depression.
Though, due to the complexity of the human brain, the existing methods, still
require scientists to try novel approaches that adapt the stimulation parameters
to individual subjects characteristics.
This introduction is focused in the motor effects of TMS and transcranial alternating current stimulation (tACS) to give the necessary information to the reader
1
The brain is able to reshape itself depending on the subject experiences, rebuilding it’s
connections according to the subject needs or the stimulus of the environment. With brain
stimulation it’s possible to force the brain to perform this changes.
1
Chapter 1. Introduction
2
to understand the protocols and the interpretation of the results. The brain stimulations used in this study are applied in other areas as it was referred in the first
paragraph but previous work in this areas is not referred here.
Biomedical engineering is a field of studies that applies engineering concepts to
solve health related problems. There is a big demand in the motor rehabilitation
field, patients with motor disorders might benefit from neurostimulation studies
as this one, where we combine TMS with tACS in a phase dependent approach.
1.2
1.2.1
State of Research
TMS
TMS was firstly brought to public by Anthony Barker (University of Sheffield,
UK) in 1985, for the first time it was possible to stimulate neural tissue (cerebral cortex, spinal roots, cranial and peripheral nerves) in a safe, non-invasive and
painless way. This technique is based in Faraday’s law of induction, this law tells
that a time-varying magnetic field, when in interaction with an electrical circuit
originates electrical currents by forcing the charges to move inside this circuit, this
force is known as, electromotive force. A TMS coil generates a time-varying magnetic field, perpendicular to the coil plane, over the scalp that induces electrical
currents, in specific groups of neurons (circuit), which depolarizes them and originates action potentials (fig. 1.1) (Di Lazzaro, 2004). There are different shapes
of coils, the round coils that generate a widely distributed field and figure-eightshaped coils that produce more focal stimulus because they have maximum current
at the intersection of the two round elements. Round coils allow bihemispheric
stimulation, to do so with 8-figure coils it’s necessary one for each hemisphere.
TMS can be applied in single pulse, paired pulse or trains of pulses. The pulses
can have different amplitudes, different widths and separated by different inter
stimulus intervals (ISIs). Motor evoked potentials (MEPs) driven by TMS are
Chapter 1. Introduction
3
Figure 1.1: TMS produces a magnetic field (left image) that produces an
action potential called motor evoked potential (MEP). The MEP is recorded by
EMG on the target muscle (right image) the first peak in the signal is the TMS
artefact and the next peaks describe the MEP.
Sources: Ridding and Rothwell, 2007,p.2 and Butler and Wolf, 2007,p.9
directly related to motor excitability of the target motor pathway. This potentials can be recorded through surface electromyography (EMG). Higher MEPs are
recorded if the coil is placed tangentially to the skull with the handle oriented 45◦
medial to the anterior–posterior plane (fig. 1.2) (Mills, Boniface, and Schubert,
1992). From the EMG data two features are mostly analysed, latency, expressed
in milliseconds (ms) and peak-to-peak amplitude, expressed in microvolts (µV ).
Latency is mostly related to the amount of synapses that are crossed by the signal from the pulse application site (cortex) till the recording site (muscle) and
integrity of the white matter fibres, like the diameter and the thickness of myelin
sheaths. The peak-to-peak amplitude is measured as the difference between the
negative and positive peak, usually detected between 10 to 30 ms after the TMS
pulse. Before starting a specific muscle stimulation the experimenter needs to find
an area in the cortex defined has the ”hotspot” of the muscle, that corresponds to
the area that is more strongly connected to the muscle in study. Resting motor
threshold (RMT) is defined as the TMS intensity where the reproducibility of 5
MEPs > 50µV out of 10 (over the hotspot) by Rossini’s method is verified (Rossini
et al., 1994; Groppa et al., 2012), this is a reference value considering that after
this intensity the chances of obtaining an MEP is higher than 50% and is also the
beginning of the slope of the stimulus response curves (SRCs) described in the
Chapter 1. Introduction
Figure 1.2: 45◦ produces much higher MEPs than the other orientations.
Sources: Mills, Boniface, and Schubert, 1992,p.3
Figure 1.3: TMS hotspot finding. Red dots are the ones with better response
from the muscle and blue/black dots the ones with worst response (left image).
MEPs are analysed for each pulse on a second monitor (right image).
Sources:
https://www.ant-neuro.com/show-case/motor-mapping-navigatedtranscranial-magnetic-stimulation-0 and Alafaci, Conti, and Tomasello, 2013,p.9
4
Chapter 1. Introduction
5
next section. Active motor threshold (aMT) is basically the same as RMT but the
subjects are asked to keep an isometric contraction2 on the target muscle around
20% of their maximum force. A gauge is necessary to check first the maximum
force and the for the subject to control the contraction and keep it around 20%.
Another difference in relation to RMT is the minimum value of the MEP when
applying Rossini’s method, instead of > 50µV the value has to be > 200µV to
distinguish the MEP from the EMG background activity due to the subject’s contraction. aMT is used as reference to experiments where a isometric contraction
is performed during the experiment. One pulse of TMS has an effect of some
milliseconds on the target cells while multiple pulses might induce long term potentiation (LTP) represented in figure 1.4 or long term depression (LTD). Single
Figure 1.4: LTP after stimulation. The amount of neurotransmitters and
neuroreceptors increases improving the communication between the two neurons
after being stimulated.
Sources: http://www.sciengage.com.au/toying-memory-like-yo-yo/
pulse TMS is used as a probe to check the excitability or integrity of the neuronal
tracts (Stinear et al., 2012) and repetitive TMS (rTMS) is used to enhance or
inhibit the excitability of the target cells (Maeda et al., 2000). Significant phase
resetting occurs at the TMS-targeted area and distant areas, showing that the disruption caused by TMS pulses resets the phase of brain ongoing signals (Kawasaki
2
When there is a balance in a muscular contraction between the agonist and antagonist
muscles of a given movement (constant contraction). This activates the muscle fibres but keeps
their length static.
Chapter 1. Introduction
6
et al., 2014). Age seems to influence interindividual variability in paired associative stimulation, LTD and LTP effects on plasticity were smaller in elder subjects
than in young ones (Müller-Dahlhaus et al., 2008). Motor excitability depends
on various factors like age, sex and handedness; this factors were not taken into
account for this study due to the limited number of subjects recruited but their
information was collected in case the sample of subjects is to be increased, so that
group analysis might be done.
1.2.2
Stimulus Response Curves
Stimulus response curves (SRCs) also called input output curves or recruitment
curves, describe the motor pathways (Devanne, Lavoie, and Capaday, 1997). To
obtain this curves, several stimulus are applied from low to high output powers of
the TMS device starting from the power where we can’t record any MEP (none or
few motor units recruited - minimum contraction) and increasing until we reach
a saturation plateau (all the motor units recruited - maximum contraction). The
MEPs obtained are averaged for each intensity and fitted to a Boltzmann sigmoid
equation. There are three main parameters that we can extract from this curves,
”range” that is the value of the upper plateau (or saturation plateau), ”threshold” that is the function’s inflexion point and ”slope” is the function’s steepness
between the plateaus. ”Range” is related with the maximum strength of the
corticospinal projection, ”threshold” reflects the bias level of the target motorneurons and ”slope” reflects the gain. Steepness increases with tonic contraction and
threshold decreases suggesting that this two parameters are related to the easiness
of motor unit recruitment but they are determined by different neural mechanisms
(Devanne, Lavoie, and Capaday, 1997). The turning point from the slope to the
upper plateau with a preactivated muscle occurs around 140% of RMT, if the
muscle is at rest this turning point occurs around 170% of RMT and these are
also the intensities considered to be optimal to perform TMS diagnosis. The turning point intensity evokes MEP’s at maximum strength at better comfort level
for the subjects (Groppa et al., 2012). SRCs can be acquired using two different
Chapter 1. Introduction
7
methods (”ramped” and ”random” mode), in ”ramped” mode the intensities used
are sequential (i.e. 50%, 60%, 70%, 80%) and in ”random” mode they are shuffled
(i.e. 70%, 50%, 80%, 60%) . Random mode was suggested by some authors to
avoid increasing MEP’s due to a serial order effect (Kazis et al., 2006; Kuijk et al.,
2009), though it has been reported that there is no significant difference between
them (Pearce, Clark, and Kidgell, 2013).
1.2.3
tACS
tACS is a very recent technique that belongs to the group of the tCSs, among transcranial direct current stimulation (tDCS) and transcranial random noise stimulation (tRNS). This technique can induce sinusoidal patterns in the brain driven
by the alternating current between two electrodes (fig. 1.5) exerting behavioural
changes in perceptual, motor and cognitive tasks (Feurra, Pasqualetti, et al., 2013).
Through the induction of a low current electric field over a target area of the cor-
Figure 1.5: Current flow during tACS.
Sources: Neuling et al., 2012,p.8
tex, tACS drives the ongoing brain activity and forces the rhythmic brain patterns
to synchronize on a given frequency (fig. 1.6), this is often referred as brainwave
entrainment3 . This entrainment can be registered even 10 min after stimulation
3
When oscillators (neurons) are perturbed by an external force (tACS) and this force is
periodic the oscillator might become synchronized in the same period and also in the same phase
after some time of interaction.
Chapter 1. Introduction
8
has been ceased (Zaehle, Rach, and Herrmann, 2010), leading to the idea that
tACS over M1 allows the increasing of the phase stability of the sensorimotor
rhythms and because of this effect it’s possible to target different phases of the induced tACS waveform with TMS pulses. The time needed for the tACS to entrain
the ongoing activity of the brain can be achieved in few seconds but this time is
dependent from the initial phase (onset phase) of the signal applied (Ali, Sellers,
and Frohlich, 2013) having a faster entrainment when the initial phase is set to π
rad. From 0 to π rad the entrainment time increases and for phases starting close
to π till 2π rad the time of entrainment is shorter than in the previous interval
increasing from π to 2π. Furthermore entrainment of tACS has been proved by
invasive and non-invasive studies (Ali, Sellers, and Frohlich, 2013; Helfrich et al.,
2014). Stimulation at 1mA intensity increases the MEP amplitude and intensities
Figure 1.6: Groups of neurons (oscillators) are driven by an external force
(tACS) to synchronize in the same period and phase after some time of interaction.
Sources: Thut, Schyns, and Gross, 2011,p.3
lower than 0.4mA provoke inhibition of the motor cortex. Intensities of 0.6 and
Chapter 1. Introduction
9
0.8mA didn’t have any effect (Moliadze et al., 2012). These data suggest that for
intensities lower than 0.4mA the inhibitory neurons are more active and above
1mA excitatory neurons are favoured, between these two intensities the neuronal
activity is equal so they cancel each others effects.
1.2.4
The Beta Band
The β band (13 − 30Hz spiking at 20Hz) of the brain waves frequencies is considered to transfer the information between the cortex and the muscle (Stuart N
Baker, 2007). tACS at 20Hz (β frequency) has increased the MEP of TMS single pulses (Feurra, Bianco, et al., 2011) and slowed down voluntary movement
(Pogosyan et al., 2009). A wide range of sensorimotor related studies have been
performed showing it’s relation with movement: the power of β increases while
maintaining posture and decreases during motor initiation and performance (Conway et al., 1995; S. N. Baker, Olivier, and Lemon, 1997; K. J. Miller et al.,
2007), motor imagery (MI) (Engel and Fries, 2010; Kilavik et al., 2013) and passive movement (Müller et al., 2003) also cause a decrease in β power (fig. 1.7) also
called beta event related desynchronization (β ERD). The phase of oscillations in
Figure 1.7: Progress of an EEG recording during the β ERD.
textitSources: Takemi et al., 2013,p.5
β band was recorded over M1 and has shown to be decisive for cortical computations (Kai J. Miller et al., 2012) and neuromuscular control (Lim et al., 2014),
validating a relevance of pre-stimulus phase on TMS effects.
Chapter 1. Introduction
1.2.5
10
Stimulation effects depend on the brain state
Using tACS we can induce different brain states (Feurra, Pasqualetti, et al., 2013).
Studies applying brain state-dependent stimulation (BSDS) have shown either increase or decrease excitability (Gharabaghi et al., 2014; Takemi et al., 2013). The
difficulties of predicting the right timing for the stimulus application is within a
very narrow time window, since the state of the brain changes very fast and a difference of few milliseconds, can provoke completely opposite effects (Gharabaghi,
2015; Devanne, Degardin, et al., 2009). Therefore is necessary to have an accurate
control on the timings of stimulation.
1.3
Goals and Outline
This present work came out with the hypothesis that cortical excitability might
be phase dependent. To test this two non-invasive stimulation methods were used:
tACS was applied to entrain and stabilize the phase of the brain waves and TMS as
a probe to check the neuromuscular excitability at four different phases of a 20Hz
signal. Like this we can predict the brain state and stimulate in the pretended
phase.
The ISI of the TMS pulse was set to 4.5 seconds to avoid frequency specific effects
and once TMS leads to phase resetting it was necessary to have a large ISI to let
tACS entrain the ongoing brain activity between TMS pulses.
Two experiments were done to complete this work the first one had too noisy data
so changes were made in order to have better quality data. Both are reported so
the reader can have a notion of the difficulties faced in this kind of protocols and
how they were overcome. The main differences between them were:
• TMS system used (because of logistic reasons)
• muscle used to record the MEPs (to get more stable MEPs)
Chapter 1. Introduction
11
• placement of the EEG electrodes for the TMS artefact detection (due to
noise problems)
• set of intensities (because of exponential SRCs problems - plateau was not
reached in protocol I and neither the script for sigmoid fitting could predict
it)
Due to safety measures, tDCS should not be applied to the subjects for more than
20 consecutive minutes (Bikson, Datta, and Elwassif, 2009). For this tACS protocol it was followed the same principle and also to avoid secondary neurosensory
effects (Raco et al., 2014). Hence the reduced range of TMS intensities, which
revealed to be problematic for the SRCs fitting because the saturation plateau
wasn’t always clear, this resulted in exponential fittings and measurements with
exponential fittings were discarded.
Chapter 2
Protocol I: Materials and
Methods
2.1
Participants
Nineteen subjects were recruited for this first study who had no history of psychiatric or neurological conditions, participated after giving a written informed
consent (Appendix A), a form to check for contraindications to brain stimulation
(Appendix B) and there was a monetary compensation according to the time of
the procedure. The study was approved by the local ethics committee.
2.2
EMG recording
EMG data were recorded and digitized with a BrainAmpExG-Amplifier (Brainproducts GmbH, Germany) with 5 kHz sampling rate using a customized MATLAB (MathWorks, Natick, MA) code. EMG activity was recorded using surface
Ag/AgCl adhesive electrodes (Neuroline 7200-S/25, Ambu/Medicotest, Denmark).
The EMG electrodes were placed at the right first dorsal interosseous (FDI) with
13
Chapter 2. Protocol I: Materials and Methods
14
the belly-tendon technique and the ground on the ulnar close to the humeroulnar joint (Fig. 2.1). To lower the impedance between the skin where the electrodes were placed was used abrasive gel (Nuprep Skin Prep Gel) and ethanol,
the impedance was checked using BrainVision software (Brainproducts GmbH,
Germany) and kept < 20kΩ.
Figure 2.1: EMG Setup for FDI MEP measurement
2.3
TMS
Participants were seated in a comfortable reclining chair for the duration of the
mapping and the following intervention. During all TMS measurements, participants were requested to keep their muscles relaxed. A focal single-pulse TMS
was applied over the FDI area of the left hemisphere M1 through a figure-of-eight
coil (17.3cm) connected to an eXimia 3.2 magnetic stimulator (Nexstim, Helsinki,
Finland). The coil was placed tangentially to the skull with the handle oriented
45◦ medial to the anterior–posterior plane. The FDI hotspot was defined as the
point where the TMS pulse has maximal amplitude and minimal latency in the
MEP. The points were acquired in a pseudo-random way. This point was marked
on a standard template of a brain MRI and was used for pseudo-navigation using
the eXimia NBS System 3.2 (Nexstim, Helsinki, Finland). RMT was calculated
as the intensity that allowed the reproducibility of MEP >50 µV in 5 out of 10
times.
Chapter 2. Protocol I: Materials and Methods
2.4
15
tACS
Experiments were conducted using a multi-channel transcranial AC stimulator
(NeuroConn, Ilmenau, Germany), a ring rubber electrode (internal diameter 2.5cm
external diameter 5cm) and a second rectangular electrode (5x6cm) (Fig. 2.2).
The round (”active”) electrode was positioned around the hotspot area and the
rectangular (”passive”) electrode over Pz according to the International 10-20
EEG System. The electrodes surfaces that were in contact with the scalp have
been covered first, with Ten20 conductive paste and then with electrolyte gel.
More gel was added in case the impedance was still high, impedance was kept
below 5kΩ. During the whole duration of each run a tACS block at 20Hz (1mA)
was delivered to the subject.
Figure 2.2: tACS electrodes: on the left the active electrode that was positioned above the hotspot and on the right the passive electrode placed over
Pz.
Chapter 2. Protocol I: Materials and Methods
2.5
16
Experimental Protocol
Six TMS intensities were set as the 90% to 140% (in 10% steps) of the RMT.
During the experiment tACS was turned on and each of the six intensities represented a separate run whose order was randomized (SRC ”random” mode acquisition). The duration of each run was around 3.5min and the total time of
tACS applied was around 21min. TMS pulses were triggered at one of 4 target
tACS phases (maxima, falling flank, minima and rising flank), representing the
four experimental conditions (Fig. 2.3). Each condition was repeated 10 times
Figure 2.3: Recorded tACS waveform epoched and centred around the time
of the TMS pulses (grey vertical patch). The gray sinuses represent the single
waveforms and the thick black line is the mean across the whole run for each
condition. The yy axis is in arbitrary units and xx axis is the time of one period
(50ms)
and the full sequence randomized across the whole run (40 pulses per intensity).
The interval between two consecutive TMS pulses is set as 4.5 seconds with a
jitter of 0.05 seconds to limit frequency specific effects of the TMS stimulation.
The TMS trigger is synchronized with the tACS signal with the help of a MATLAB script that calculates the time difference (∆t) between a test pulse and the
tACS maximum just before this pulse (Fig. 2.4). Once the signal is periodic
(P eriod = 1/20Hz = 0.05s) the script will always know when the next maximum
will take place (N extM ax = 0.05s − ∆t) and also all the other phases (incrementing with 0.05s/4 = 0.0125s).
Chapter 2. Protocol I: Materials and Methods
17
Figure 2.4: This figure shows how the time corrections for the TMS-tACS
synchronization were calculated. The yy axis is expressed in millivolts and xx
axis is in samples at a sampling frequency of 1100Hz
2.6
Experimental Setup
The experimental setup is represented in figure 2.5. The tACS stimulator is connected to a splitter box, that splits the tACS signal in two pairs of cables, one
pair to stimulate the subject’s cortex and the other pair to the recording amplifier
that sends the signals acquired to the computer. The EEG electrodes are placed
over the subject’s scalp to record the TMS artefact and also connected to the signal amplifier. The controlling computer acquires the tACS sinusoidal signal and
the TMS artefact recorded by the EEG electrodes and triggers the TMS system
according to the calculations described in the previous section. The EMG electrodes are also connected to the amplifier and the MEP information is stored in
the computer.
Chapter 2. Protocol I: Materials and Methods
Figure 2.5: (1) tACS stimulator, (2) splitter box, (3) EEG (brown and green)
and tACS electrodes (red and blue), (4) input-box and signal amplifier, (5)
recording computer, (6) TMS system
18
Chapter 3
Protocol I: Problems and
solutions
3.1
Online data quality check
During the experiment some data was plotted in a control screen (Fig. 3.1), this
screen was used to check if the target phase was correctly targeted. The script
defined which phase was going to be targeted and plotted the tACS signal when
the TMS pulse was applied in the corresponding ”box” according to the previously
defined phase. For example, if there was a descending part of a sinusoidal signal
in the maxima ”box”, the experimenter could observe that there was a mistake on
the timing the TMS was triggered because the signal recorded at the same time as
the TMS pulse didn’t correspond to the targeted phase. For most of the subjects
it was not possible to detect the TMS pulse (recorded by the EEG electrodes)
and it was not possible to have an accurate phase targeting, so the measurements
were discarded. When the EEG electrodes are placed over the scalp they capture
the tACS signal and brain signals. The objective was to find the TMS artefact
and most of the times it was mixed with other signals that were not of interest,
the script used to make the calculations for the trigger timing couldn’t trigger
the TMS correctly due to this mixture of signals. The impedance registered (at
19
Chapter 3. Protocol I: Problems and solutions
20
BrainVision software) in the EEG electrodes was also many times too high causing
saturation on the amplifier and the signal couldn’t be properly analysed. In this
screen was also visible the EMG signal where the experimenter could check if the
signal was correctly acquired and even the MEP was visible if the TMS intensity
was enough to evoke it.
Figure 3.1: The four first plots correspond to the four phases that were targeted. Here it is visible that the TMS was not triggered in the right time
showing an error at the time TMS was triggered. The first long plot was the
EMG signal. The last plot was the signal recorded by the EEG electrodes, in
this picture is visible that the tACS signal was strongly affecting the signal. The
yy axis is in arbitrary units and the xx axis is a period time for the phases plots,
for EMG and TMS xx axis is in samples at a sampling frequency of 1100Hz.
Solution: EEG electrodes attached to the top of the TMS coil with the surfaces
turned to each other. This reduced the impedance between them and there was
no other signals registered besides environmental noise and the TMS artefact was
precisely detected, as it is shown in chapter 5.
3.2
Exponential SRC’s problem
The EMG data was cut into epochs of 1 second length centred on each TMS pulse.
For the calculation of the MEP size it was considered the range of the signal from
Chapter 3. Protocol I: Problems and solutions
21
10 to 30 ms after the TMS artefact in the the EMG signal. The MEP amplitudes
were averaged and a Boltzmann sigmoidal function was fitted by a MATLAB script
to the results of each condition using the equation:
M EP max(S) =
M EP max
1+e
S50−S
k
(3.1)
Where MEPmax (Range) is the estimated maximal MEP amplitude, S is the
stimulus intensity, S50 (Threshold) is the stimulus intensity required to produce
a response equal to half MEPmax and k is the slope parameter (inversely proportional to maximal function steepness). This script also made a prediction of
values for the intensities not applied. Many SRC’s had an exponential fitting due
to the lack of values that could define or predict where the plateau would be (Fig.
3.2). The average for the turning point of the upper plateau is around 170% of
RMT with the muscle relaxed. The amplitudes registered till 140% of RMT were
only enough to define the lower plateau and the slope but not enough to define
the upper plateau.
Figure 3.2: Exponential SRC’s. The yy axis is in microvolts and the xx axis
is the percentage of maximum TMS output.
Chapter 3. Protocol I: Problems and solutions
22
Solution: TMS set of intensities changed to a wider range of intensities. Intensities
set was defined to 80%, 100%, 110%, 120%, 140% and 150% so the plateau could be
found by the script used to fit the sigmoid function. Although this intensities are
not considered to define points after the turning point (170% of RMT for muscles
at rest) from the slope to the upper plateau it was enough to do a prediction of
this values.
3.3
Functional movement stability
In many subjects the stability of the functional movement in this case the finger
pinch was not possible and for high intensities there was contraction of multiple
muscles of the arm putting into question the reliability on the MEP’s recorded.
This multiple contraction might be caused by cross talking of the motor-neurons.
Solution: Target muscle was changed from FDI to EDC. EDC is bigger and a
stable functional movement was observed even at high intensities.
Chapter 4
Protocol II: Materials and
Methods
4.1
Participants
Twelve subjects were recruited for this second study (5 female and 7 male), 11
right-handed and 1 left-handed according to Edinburgh Handedness Inventory
(Appendix C) (Oldfield, 1971), ages ranged from 21 to 30 years old (Avg: 25).
Although the age, sex and handedness are reported, they were not taken in account to this protocol but it could be used to separate the subjects in groups for
further statistical analysis. The subjects filled a form to check for contraindications to brain stimulation (Appendix B). They did not suffer from neurological or
psychological disorders, didn’t have metallic implants/implanted electric devices,
didn’t take any medication nor had a personal or family history of epilepsy. The
experiment started after giving a written informed consent (Appendix A) and after the experiment there was a monetary compensation according to the time of
the procedure. The study was approved by the local ethics committee.
23
Chapter 4. Protocol II: Materials and Methods
4.2
24
EMG recording
EMG data were recorded with a BrainAmpExG-Amplifier (Brainproducts GmbH,
Germany) with 5kHz sampling rate using a customized MATLAB (MathWorks,
Natick, MA) code. EMG activity was recorded using surface Ag/AgCl adhesive electrodes (Neuroline 7200-S/25, Ambu/Medicotest, Denmark). The EMG
electrodes were placed over the right extensor digitorum communis (EDC) and
the ground on the ulnar close to the humeroulnar joint (Fig. 4.1). To lower
the impedance between the skin where the electrodes were placed, abrasive gel
(Nuprep Skin Prep Gel) and ethanol were used, the impedance was checked using
BrainVision software (Brainproducts GmbH, Germany) and kept < 20kΩ.
Figure 4.1: EMG Setup for EDC MEP measurement
4.3
TMS
Participants were seated in a comfortable reclining chair for the duration of the
mapping and the following intervention. During all TMS measurements, participants were requested to keep their muscles relaxed. A focal single-pulse TMS was
applied over the FDI area of the left hemisphere M1 using the MagVenture R30
Chapter 4. Protocol II: Materials and Methods
25
stimulator (MagVenture A/S, Farum, Denmark) and a figure-of-eight coil (MCFB70, inner diameter 23mm, outer diameter 96mm, 2.5kg). The coil was held by
the experimenter tangentially to the skull with the handle oriented 45◦ medial to
the anterior–posterior plane. The EDC hotspot was defined as the point where the
TMS pulse has maximal amplitude and minimal latency in the MEP. This point
was marked on a brain model generated by the navigation software (Localite TMS
Navigator, Localite GmbH, Sankt Augustin, Germany) and was used for pseudonavigation. RMT was calculated as the intensity that allowed the reproducibility
of MEP > 50µV in 5 out of 10 times.
4.4
tACS
Experiments were conducted using a multi-channel transcranial AC stimulator
(NeuroConn, Ilmenau, Germany), a ring rubber electrode (internal diameter 2.5cm
external diameter 5cm) and a second rectangular electrode (5x6cm) (Fig. 2.2). A
pointer provided with the TMS system was used to help finding the right location
for the round (”active”) electrode, that was positioned around the hotspot area
and the rectangular (”passive”) electrode over the Pz area according to the International 10-20 EEG System. The electrodes surfaces that were in contact with
the scalp have been covered first, with Ten20 conductive paste and then with electrolyte gel. More gel was added in case the impedance was still high, impedance
was kept below 5kΩ. During the whole duration of each run a tACS block at 20
Hz (1 mA) was delivered to the subject.
4.5
Experimental Protocol
Six TMS intensities were set as the 90%, 100%, 110%, 120%, 140% and 150% of the
RMT. The intensities set didn’t have a constant increment between intensities due
to the limited time for tACS stimulation and it was the strategy found in attempt
to find the the SRC’s upper plateau. SRC’s were acquired without tACS in a
Chapter 4. Protocol II: Materials and Methods
26
”ramped” mode to check the differences in the excitability before (Pre SRC) and
after (Post SRC) the experiment. During the experiment tACS was turned on and
each of the six intensities represented a separate run whose order was randomized
(SRC ”random” mode acquisition). The duration of each run was around 3.5min
the total time of tACS applied was around 21min. TMS pulses were triggered
at one of 4 target tACS phases (maxima, negative zero crossing, minima and
positive zero crossing), representing the four experimental conditions (Fig. 2.3).
Each condition was repeated 10 times and the full sequence randomized across the
whole run (40 pulses per intensity). The interval between two consecutive TMS
pulses is set as 4.5 seconds with a jitter of 0.05 seconds to limit frequency specific
effects of the TMS stimulation. The TMS trigger is synchronized with the tACS
signal with the help of a MATLAB script that calculates the time difference (∆t)
between a test pulse and the tACS maximum just before this pulse (Fig. 4.2).
Since the signal is periodic (P eriod = 1/20Hz = 0.05s) the script will always
know when the next maximum will take place (N extM ax = 0.05s − ∆t) and also
all the other phases (incrementing with 0.05s/4 = 0.0125s).
Figure 4.2: This figure shows how the time corrections for the TMS-tACS
synchronization were calculated. The yy axis is expressed in millivolts and xx
axis is in samples at a sampling frequency of 1100Hz
Chapter 4. Protocol II: Materials and Methods
4.6
27
Experimental Setup
The experimental setup is represented in figure 4.3. The tACS stimulator is connected to a splitter box, that splits the tACS signal in two pairs of cables, one
pair to stimulate the subject’s cortex and the other pair to the recording amplifier
that sends the signals acquired to the computer. The EEG electrodes are also
connected to the signal amplifier, the recording surface was touching each other
and they were placed over the TMS coil to record the TMS artefact. The controlling computer acquires the tACS sinusoidal signal and the TMS artefact recorded
by the EEG electrodes and triggers the TMS system according to the calculations
described in the previous section. The EMG electrodes are also connected to the
amplifier and the MEP information is stored in the computer.
Figure 4.3: (1) tACS stimulator, (2) splitter box, (3) tACS electrodes, (4)
input-box and signal amplifier, (5) recording computer, (6) TMS system, (7)
EEG electrodes attached to the TMS coil
Chapter 5
Protocol II: Results
5.1
Online data analysis
During the experiment some data was plotted in a control screen (Fig. 5.1), this
screen was used to check if the target phase was correctly targeted. The script
defined which phase was going to be targeted and plotted the tACS signal when
the TMS pulse was applied in the corresponding ”box” according to the previously
defined phase. For example, if there was a descending part of a sinusoidal signal in
the maxima ”box”, the experimenter could observe that there was a mistake on the
timing the TMS was triggered because the signal recorded at the same time as the
TMS pulse didn’t correspond to the targeted phase, like in protocol I. During the
observation of the control screen during the experiments it was possible to observe
much less noise on the signal of the EEG electrodes and the target phases were
found correctly. The impedance registered (at BrainVision software) in the EEG
electrodes was much lower than in protocol I and the amplifier channel was never
saturated. In this screen was also visible the EMG signal where the experimenter
could check if the signal was correctly acquired and even the MEP was visible if
the TMS intensity was enough to evoke it.
29
Chapter 5. Protocol II: Results
30
Figure 5.1: The control screen showing a good TMS pulse detection and the
correct target phases. The yy axis is in arbitrary units and the xx axis is a
period time for the phases plots, for EMG and TMS xx axis is in samples at a
sampling frequency of 1100Hz.
5.2
SRC’s
The EMG data was cut into epochs of 1 second length centred on each TMS pulse.
For the calculation of the MEP size it was considered the range of the signal from
10 to 30 ms after the TMS artefact in the the EMG signal. The MEP amplitudes
were averaged and a Boltzmann sigmoidal function was fitted to the results of each
condition using the equation:
M EP max(S) =
M EP max
1+e
S50−S
k
(5.1)
Where MEPmax (Range) is the estimated maximal MEP amplitude, S is the
stimulus intensity, S50 (Threshold) is the stimulus intensity required to produce
a response equal to half MEPmax and k is the slope parameter (inversely proportional to maximal function steepness). This script also made a prediction of values
for the intensities not applied (Fig. 5.2). Subjects with exponential SRC’s were
rejected from further analysis (Fig. 5.3).
Chapter 5. Protocol II: Results
Figure 5.2: Single subject SRC’s analysis. The yy axis is in microvolts and
the xx axis is the percentage of maximum TMS output.
Figure 5.3: Exponential single subject SRC’s analysis. The yy axis is in
microvolts and the xx axis is the percentage of maximum TMS output.
31
Chapter 5. Protocol II: Results
5.3
32
ANOVA test
An ANOVA test was made to check the variance of each condition (pre,maxima,negative
zero cross, minima, positive zero cross and post) within the three SRC’s parameters
(Figs. 5.4, 5.5, 5.6). The ANOVA test of the range parameter shows significant
Figure 5.4: Range ANOVA
Figure 5.5: Threshold ANOVA
differences between the pre and post SRC’s (P < 0.0322). In the ANOVA test of
the threshold parameter there is significant differences between the tACS phases
Chapter 5. Protocol II: Results
33
Figure 5.6: Slope ANOVA
and the post SRC’s post-maxima: 0.0066, post-negative zero: P < 0.0003, postminima: P < 0.0004, post-positive zero: P < 0.0047. For the slope parameter it
was not found any significant difference between the conditions.
5.4
Discussion
The significance observed in the range parameter between pre and post SRC’s
and the less significant but still noticeable increase of the the maximum MEP’s
values during tACS confirms that 20Hz tACS at 1mA increases the power of the
MEP’s during tACS (Feurra, Bianco, et al., 2011;Feurra, Pasqualetti, et al., 2013)
and had an even more noticeable increase after the intervention, revealing that
the stimulation applied strengthened the corticomuscular communication. This
would be interesting for a clinical application if the increase after the experiment
is kept during time enough to be considered a LTP of the corticomuscular pathways. In this protocol it was not recorded more SRC’s after the one that was
taken immediately after the end of the tACS. There was an immediate effect in
the strengthening of the communication between the cortex and the target muscle
but it’s not possible to state that this is a long term effect also because the effects
of tACS are kept for several minutes after the intervention (Zaehle, Rach, and
Chapter 5. Protocol II: Results
34
Herrmann, 2010).
The significance observed in the threshold parameter shows that during tACS
(20Hz @ 1mA) is facilitated the excitability of the corticospinal components revealing that more motor units are recruited at lower intensities.
In the slope parameter there was no significant results and once slope parameter is related to the gain of the MEP’s in this experiment there wasn’t a factor
that could add this gain like in experiments with active contraction while TMS is
applied where somehow there is an offset to obtain the MEP’s.
Chapter 6
Conclusion and future directions
The increase in post intervention maximum excitability revealed to be significant
and it might be of clinical interest. In this study it was combined two kinds
of stimulation and might be interesting to make further experiments that could
distinguish which stimulation is the one that contributed more to this result or
it might be that only their combination reproduces such results. The reduced
threshold parameter during tACS suggests that stimulation with 20Hz at 1 mA
positively influences motor excitability facilitating the recruitment motor units
for muscular contraction. The results show once more the relation of β band in
corticomuscular communication. There was not foreseen in this protocol a period
after the intervention in which SCR’s were recorded periodically to check if LTP
was achieved or if it was just a short lasting effect.
The lack of significant results in the phase parameters, doesn’t mean that further experiments shouldn’t be executed, there are several parameters that can be
adjusted, like changing the time between the TMS ISI’s applied, different set of
TMS intensities, other tACS frequencies, intensity, montage, add control conditions (Herrmann et al., 2013) or reduction of the relative movement between the
head of the subject and the coil during the runs, with a chin rest or other kind of
apparatus, in a way that MEPs amplitudes get more stable. An important change
to this protocol could also be to ask the subjects to keep an active contraction so
that the turning point for the upper plateau could be achieved at 140% of RMT
35
Chapter 6. Conclusion and future directions
36
and the SRC’s would be more reliable. The force would have to be the same during the whole intervention and a gauge to measure the force would be required; in
this case there could be also a limitation due to possible muscular fatigue of the
subject.
Brain stimulation experiments are very susceptible to human errors, parameters as
the angle and perfect position of the coil is not easy to achieve even with navigated
stimulation. Involuntary movements provoked by the subject (i.e. respiration or
reaction to muscle twitches caused by stimulation) and small movements from the
experimenter while holding the coil changes the angle or the distance of stimulation
and might stimulate neurons in the neighbourhood of the marked ”hotspot” resulting in high variability of the MEP’s. Even with navigated TMS, MEP variability
doesn’t have a significant decrease and it might be influenced by neurophysiologic
factors (Jung et al., 2010). A rigid support as a mechanical arm can be used to
perform TMS experiments but if the subject makes a slight movement with the
head the problem is not solved once the arm will stay static, while if you have
an experimenter holding the coil, the experimenter can always adjust as good as
possible the position with the help from the navigation system. Robotic TMS
could be a solution to reduce the margin of human error (fig. 6.1) in this protocols
and achieve more reliable results (Richter et al., 2013) but is always conditioned
by the budget of each research institution.
Figure 6.1: Human error induces high variability in the Magnetic fields produced by TMS. Here is possible to see that robotic TMS in much more stable.
Source: Richter et al., 2013,p.5
Appendix A
Written Consent
Klinik für Neurochirurgie
Clinics for Neurochirurgie • Hoppe-Seyler-Str. 3 • 72076 Tübingen
Motor Effects of Transcranial Alternating Current
Stimulation
Consent form
Sir/Madam Dr. __________________________ explained the possibile
Medical Director:
Prof. Dr. med. Marcos Tatagiba
Hoppe-Seyler-Straße 3
72076 Tübingen
www.neurochirurgie-tuebingen.de
benefits and the existing risks of the above mentioned study. I do not have any
Chief secretariat:
additional questions and hereby accept the presented treatment.
This is to
cerfify that I have given all the information about my medical history truthfully.
Sir/Madam Dr. __________________________ explained the handling of the
collected data. I do not have any additional questions and hereby accept the
terms. I understand that the data does not contain any personal information
and thereby cannot be traced back to me.
I know that I may decide to stop being part of the study at any time without any
repercussions.
07071/ 29-8 03 25
07071/ 29-8 64 41
fax
07071/ 29- 45 49
General ambulance and
special consultations:
07071/ 29-8 66 79
Private consultations:
07071/ 29-8 03 25
Occupancy management:
07071/ 29-8 36 23
Normal station:
Station 24
07071/ 29-8 20 55
Station 27
07071/ 29-8 66 54
Station 42
07071/ 29-8 55 53
Intensive care unit:
Station 23
07071/ 29-8 58 48
Tübingen, at __________________
Name of the expimenter and signature
Tübingen, at __________________
Name of particepant and signature
Seite 1 von 1
39
Appendix B
TMS Assessment
Assessment for TMS_tACS experiment
Before you are able to take part in our TMS experiment, we need to make sure that it
is safe for you to do so. For this purpose, we need information about the possible
factors that would enhance the risk for you to experience unintended side effects.
Please fill out the questionnaire carefully and honestly.
Personal Information
Surname,Name:
Date of birth:
Gender:
Adress:
male
female
Emailadress:
Phone number:
Handedness
left
right
Short Anamnesis
If you answer ‘Yes‘, please provide an explanation
(What, when, under which circumstances, and if applicable where).
1. Are you currently suffering from any medical conditions?
Yes:
No
2. Do you have any diseases? (High blood pressure, diabetes, etc.)
Yes:
No
3. Do you suffer from epilepsy, have you ever experienced seizures or does
someone in your family suffer from epilepsy?
Yes:
No
4. Have you ever had a severe head trauma?
Yes:
No
5. Have you ever lost consciousness without any known reason?
Yes:
No
6. Have you ever undergone surgery to your spinal column or head
Yes:
No
Prof. A. Gharabaghi
Translationale Neurochirurgie
Otfried-Müller-Str. 45
72076 Tübingen
Paraph: __________
1/4
41
Appendix B. TMS Assessment
42
Assessment for TMS_tACS experiment
7. Do you have any of the following implants in your body?
Nein
Yes (metal) plates and /or screws
Yes Vascular clips
Yes Artificial heart valve
Yes Metallic splinters/shrapnel/etc.
Yes Pacemaker
Yes Insulin pump
Yes Internal hearing aid (cochlear implant)
Yes Any other implant not mentioned above
If you answered ‘yes’ to any of the questions above,
Please specify:
8. Do you have any deviations of the spinal cord, bone marrow, or the
ventricular system?
Yes:
No
9. Have you ever (at present or in the past) had a brain-related, neurological
illness?
Yes:
No
10. Do you have frequent severe headaches?
If yes, please describe how often, and on which occasions
Yes:
No
11. Are you currently under any form of medical treatment?
Yes:
No
12. Are you currently taking antibiotics (a medication that helps alleviate
bacterial infections)?
Yes:
No
13. Do you ever take antihistamines (anti-allergy medication)?
If yes, how often and when was the last time you took them?
Yes:
No
Prof. A. Gharabaghi
Translationale Neurochirurgie
Otfried-Müller-Str. 45
72076 Tübingen
Paraph: __________
2/4
Appendix B. TMS Assessment
43
Assessment for TMS_tACS experiment
14. Have you used any recreational drugs during the past year (such as
marijuna, ecstays, cocaine, etc.)?
If yes, how often, which drugs did you use and when was the last time that
you used them
Yes:
No
15. Have you ever suffered from substance dependence or abuse?
Yes:
No
16. Do you drink alcohol, coffee or do you smoke?
If yes, how often?
Yes:
No
17. Do you have sleeping problems?
Yes:
No
18. Have you ever undergone a MRI for clinical purpose?
Yes:
No
19. Have you ever undergone TMS?
Yes:
No
20. Are you pregnant, or is there a chance that you might be?
No
Yes
Prof. A. Gharabaghi
Translationale Neurochirurgie
Otfried-Müller-Str. 45
72076 Tübingen
Paraph: __________
3/4
Appendix B. TMS Assessment
44
Assessment for TMS_tACS experiment
Information and explanation
I am aware of the fact that a false statement can influence the quality of the
experiment and declare hereby that I have answered all questions to the best of my
knowledge and belief.
I was pointed out that all information will be treated confidentially according to the
Verschwiegenheitsgebotes (Secrecy commandment) in § 203 StGB.
I am sufficiently informed, have no further questions and agree to conduct the
experiment.
Place, Date:
Signature participant:
Signature experimenter:
Prof. A. Gharabaghi
Translationale Neurochirurgie
Otfried-Müller-Str. 45
72076 Tübingen
Paraph: __________
4/4
Appendix C
Edinburgh Handedness Inventory
Edinburgh Handedness Inventory
Surname_________________________ Given Name____________________________
Date of Birth______________________ Sex___________________________________
Please indicate your preferences in the use of hands in the following activities by
putting + in the appropriate column. Where the preference is so strong that you would
never try to use the other hand unless absolutely forces to, put ++. If any case you are
really indifferent put + in both columns.
Some of the activities require both hands. In these cases the part of the task, or
object, for which hand preference is wanted is indicated in brackets.
Please try to answer all the questions, and only leave a blank if you have no
experience at all of the object or task.
Left
1. Writing
2. Drawing
3. Throwing
4. Scissors
5. Toothbrush
6. Knife (without fork)
7. Spoon
8. Broom (upper hand)
9. Striking Match (match)
10. Opening box (lid)
i. Which foot do you prefer to kick with?
ii. Which eye do you use when using only one?
L.Q.
Leave these spaces blank
45
DECILE
Right
Bibliography
Alafaci, Concetta, Alfredo Conti, and Francesco Tomasello (2013). “Navigated
Brain Stimulation (NBS) for Pre-Surgical Planning of Brain Lesion in Critical
Areas: Basic Principles and Early Experience”. In: Clinical Management and
Evolving Novel Therapeutic Strategies for Patients with Brain Tumors. Ed. by
Terry Lichtor. InTech. isbn: 978-953-51-1058-3.
Ali, M. M., K. K. Sellers, and F. Frohlich (2013). “Transcranial Alternating Current Stimulation Modulates Large-Scale Cortical Network Activity by Network
Resonance”. In: Journal of Neuroscience 33.27, pp. 11262–11275. issn: 02706474, 1529-2401. doi: 10.1523/JNEUROSCI.5867-12.2013.
Baker, S. N., Etienne Olivier, and R. N. Lemon (1997). “Coherent oscillations in
monkey motor cortex and hand muscle EMG show task-dependent modulation.”
In: The Journal of Physiology 501 (Pt 1), pp. 225–241.
Baker, Stuart N (2007). “Oscillatory interactions between sensorimotor cortex and
the periphery”. In: Current Opinion in Neurobiology 17.6, pp. 649–655. issn:
09594388. doi: 10.1016/j.conb.2008.01.007.
Bikson, Marom, Abhishek Datta, and Maged Elwassif (2009). “Establishing safety
limits for transcranial direct current stimulation”. In: Clinical Neurophysiology
120.6, pp. 1033–1034. issn: 13882457. doi: 10.1016/j.clinph.2009.03.018.
Butler, A. J and S. L Wolf (2007). “Putting the Brain on the Map: Use of Transcranial Magnetic Stimulation to Assess and Induce Cortical Plasticity of UpperExtremity Movement”. In: Physical Therapy 87.6, pp. 719–736. issn: 0031-9023,
1538-6724. doi: 10.2522/ptj.20060274.
Conway, B. A. et al. (1995). “Synchronization between motor cortex and spinal
motoneuronal pool during the performance of a maintained motor task in man.”
In: The Journal of physiology 489 (Pt 3), pp. 917–924.
Devanne, H., A. Degardin, et al. (2009). “Afferent-induced facilitation of primary
motor cortex excitability in the region controlling hand muscles in humans”. In:
European Journal of Neuroscience 30.3, pp. 439–448. issn: 0953816X, 14609568.
doi: 10.1111/j.1460-9568.2009.06815.x.
Devanne, H., B. A. Lavoie, and C. Capaday (1997). “Input-output properties and
gain changes in the human corticospinal pathway”. In: Experimental Brain Research 114.2, pp. 329–338.
Di Lazzaro, V (2004). “The physiological basis of transcranial motor cortex stimulation in conscious humans”. In: Clinical Neurophysiology 115.2, pp. 255–266.
issn: 13882457. doi: 10.1016/j.clinph.2003.10.009.
47
Bibliography
48
Engel, Andreas K and Pascal Fries (2010). “Beta-band oscillations—signalling
the status quo?” In: Current Opinion in Neurobiology 20.2, pp. 156–165. issn:
09594388. doi: 10.1016/j.conb.2010.02.015.
Feurra, M., G. Bianco, et al. (2011). “Frequency-Dependent Tuning of the Human Motor System Induced by Transcranial Oscillatory Potentials”. In: Journal of Neuroscience 31.34, pp. 12165–12170. issn: 0270-6474, 1529-2401. doi:
10.1523/JNEUROSCI.0978-11.2011.
Feurra, M., P. Pasqualetti, et al. (2013). “State-Dependent Effects of Transcranial Oscillatory Currents on the Motor System: What You Think Matters”. In:
Journal of Neuroscience 33.44, pp. 17483–17489. issn: 0270-6474, 1529-2401.
doi: 10.1523/JNEUROSCI.1414-13.2013.
Gharabaghi, Alireza (2015). “Activity-dependent brain stimulation and robotassisted movements for use-dependent plasticity”. In: Clinical Neurophysiology
126.5, pp. 853–854. issn: 13882457. doi: 10.1016/j.clinph.2014.09.004.
Gharabaghi, Alireza et al. (2014). “Coupling brain-machine interfaces with cortical stimulation for brain-state dependent stimulation: enhancing motor cortex
excitability for neurorehabilitation”. In: Frontiers in Human Neuroscience 8.
issn: 1662-5161. doi: 10.3389/fnhum.2014.00122.
Groppa, S. et al. (2012). “A practical guide to diagnostic transcranial magnetic
stimulation: Report of an IFCN committee”. In: Clinical Neurophysiology 123.5,
pp. 858–882. issn: 13882457. doi: 10.1016/j.clinph.2012.01.010.
Helfrich, Randolph F. et al. (2014). “Entrainment of Brain Oscillations by Transcranial Alternating Current Stimulation”. In: Current Biology 24.3, pp. 333–
339. issn: 09609822. doi: 10.1016/j.cub.2013.12.041.
Herrmann, Christoph S. et al. (2013). “Transcranial alternating current stimulation: a review of the underlying mechanisms and modulation of cognitive processes”. In: Frontiers in Human Neuroscience 7. issn: 1662-5161. doi: 10.3389/
fnhum.2013.00279.
Jung, Nikolai H. et al. (2010). “Navigated transcranial magnetic stimulation does
not decrease the variability of motor-evoked potentials”. In: Brain Stimulation
3.2, pp. 87–94. issn: 1935861X. doi: 10.1016/j.brs.2009.10.003.
Kawasaki, Masahiro et al. (2014). “Transcranial magnetic stimulation-induced
global propagation of transient phase resetting associated with directional information flow”. In: Frontiers in Human Neuroscience 8. issn: 1662-5161. doi:
10.3389/fnhum.2014.00173.
Kazis, Dimitrios A. et al. (2006). “The effect of valproate on silent period and
corticomotor excitability”. In: Epileptic disorders 8.2, pp. 136–142.
Kilavik, Bjørg Elisabeth et al. (2013). “The ups and downs of beta oscillations in
sensorimotor cortex”. In: Experimental Neurology 245, pp. 15–26. issn: 00144886.
doi: 10.1016/j.expneurol.2012.09.014.
Kuijk, Annette A. van et al. (2009). “Stimulus–response characteristics of motor
evoked potentials and silent periods in proximal and distal upper-extremity
muscles”. In: Journal of Electromyography and Kinesiology 19.4, pp. 574–583.
issn: 10506411. doi: 10.1016/j.jelekin.2008.02.006.
Lim, Manyoel et al. (2014). “Ascending beta oscillation from finger muscle to
sensorimotor cortex contributes to enhanced steady-state isometric contraction
Bibliography
49
in humans”. In: Clinical Neurophysiology 125.10, pp. 2036–2045. issn: 13882457.
doi: 10.1016/j.clinph.2014.02.006.
Maeda, Fumiko et al. (2000). “Modulation of corticospinal excitability by repetitive
transcranial magnetic stimulation”. In: Clinical Neurophysiology 111.5, pp. 800–
805.
Miller, K. J. et al. (2007). “Spectral Changes in Cortical Surface Potentials during
Motor Movement”. In: Journal of Neuroscience 27.9, pp. 2424–2432. issn: 02706474, 1529-2401. doi: 10.1523/JNEUROSCI.3886-06.2007.
Miller, Kai J. et al. (2012). “Human Motor Cortical Activity Is Selectively PhaseEntrained on Underlying Rhythms”. In: PLoS Computational Biology 8.9. Ed.
by Tim Behrens, e1002655. issn: 1553-7358. doi: 10 . 1371 / journal . pcbi .
1002655.
Mills, K.R., S.J. Boniface, and M. Schubert (1992). “Magnetic brain stimulation
with a double coil: the importance of coil orientation”. In: Electroencephalography and Clinical Neurophysiology/Evoked Potentials Section 85.1, pp. 17–21.
issn: 01685597. doi: 10.1016/0168-5597(92)90096-T.
Moliadze, Vera et al. (2012). “Close to threshold transcranial electrical stimulation
preferentially activates inhibitory networks before switching to excitation with
higher intensities”. In: Brain Stimulation 5.4, pp. 505–511. issn: 1935861X. doi:
10.1016/j.brs.2011.11.004.
Müller, G.R. et al. (2003). “Event-related beta EEG changes during wrist movements induced by functional electrical stimulation of forearm muscles in man”.
In: Neuroscience Letters 340.2, pp. 143–147. issn: 03043940. doi: 10 . 1016 /
S0304-3940(03)00019-3.
Müller-Dahlhaus, J. Florian M. et al. (2008). “Interindividual variability and agedependency of motor cortical plasticity induced by paired associative stimulation”. In: Experimental Brain Research 187.3, pp. 467–475. issn: 0014-4819,
1432-1106. doi: 10.1007/s00221-008-1319-7.
Neuling, Toralf et al. (2012). “Finite-Element Model Predicts Current Density
Distribution for Clinical Applications of tDCS and tACS”. In: Frontiers in Psychiatry 3. issn: 1664-0640. doi: 10.3389/fpsyt.2012.00083.
Oldfield, R.C. (1971). “The assessment and analysis of handedness: The Edinburgh
inventory”. In: Neuropsychologia 9, pp. 97–113.
Pearce, Alan J., Ross A. Clark, and Dawson J. Kidgell (2013). “A Comparison of
Two Methods in Acquiring Stimulus–Response Curves with Transcranial Magnetic Stimulation”. In: Brain Stimulation 6.3, pp. 306–309. issn: 1935861X. doi:
10.1016/j.brs.2012.05.010.
Pogosyan, Alek et al. (2009). “Boosting Cortical Activity at Beta-Band Frequencies Slows Movement in Humans”. In: Current Biology 19.19, pp. 1637–1641.
issn: 09609822. doi: 10.1016/j.cub.2009.07.074.
Raco, Valerio et al. (2014). “Neurosensory Effects of Transcranial Alternating Current Stimulation”. In: Brain Stimulation 7.6, pp. 823–831. issn: 1935861X. doi:
10.1016/j.brs.2014.08.005.
Richter, Lars et al. (2013). “Stimulus Intensity for Hand Held and Robotic Transcranial Magnetic Stimulation”. In: Brain Stimulation 6.3, pp. 315–321. issn:
1935861X. doi: 10.1016/j.brs.2012.06.002.
Bibliography
50
Ridding, Michael C. and John C. Rothwell (2007). “Is there a future for therapeutic
use of transcranial magnetic stimulation?” In: Nature Reviews Neuroscience 8.7,
pp. 559–567.
Rossini, Paolo M. et al. (1994). “Non-invasive electrical and magnetic stimulation
of the brain, spinal cord and roots: basic principles and procedures for routine
clinical application. Report of an IFCN committee”. In: Electroencephalography
and clinical neurophysiology 91.2, pp. 79–92.
Stinear, C. M. et al. (2012). “The PREP algorithm predicts potential for upper
limb recovery after stroke”. In: Brain 135.8, pp. 2527–2535. issn: 0006-8950,
1460-2156. doi: 10.1093/brain/aws146.
Takemi, M. et al. (2013). “Event-related desynchronization reflects downregulation of intracortical inhibition in human primary motor cortex”. In: Journal
of Neurophysiology 110.5, pp. 1158–1166. issn: 0022-3077, 1522-1598. doi: 10.
1152/jn.01092.2012.
Thut, Gregor, Philippe G. Schyns, and Joachim Gross (2011). “Entrainment of
Perceptually Relevant Brain Oscillations by Non-Invasive Rhythmic Stimulation
of the Human Brain”. In: Frontiers in Psychology 2. issn: 1664-1078. doi: 10.
3389/fpsyg.2011.00170.
Zaehle, Tino, Stefan Rach, and Christoph S. Herrmann (2010). “Transcranial Alternating Current Stimulation Enhances Individual Alpha Activity in Human
EEG”. In: PLoS ONE 5.11. Ed. by André Aleman, e13766. issn: 1932-6203.
doi: 10.1371/journal.pone.0013766.
Baixar