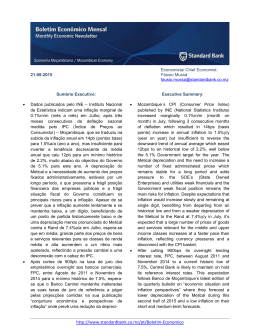
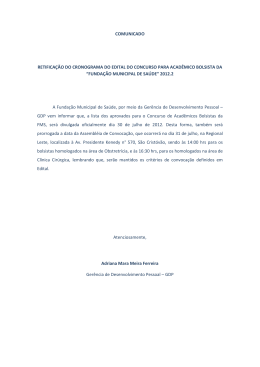
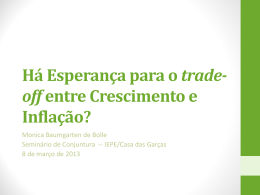
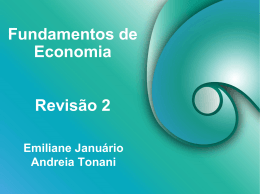
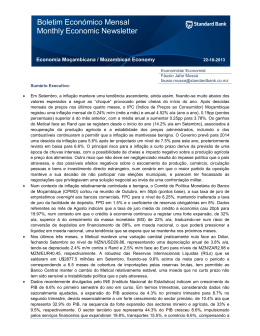
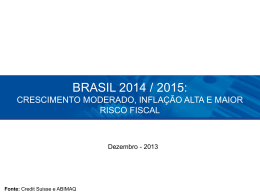
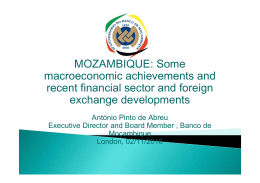
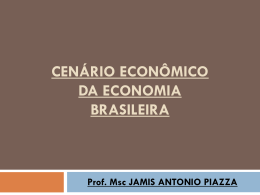
Economista/ Chief Economist:
Fáusio Jafar Mussá
[email protected]
25-Mar-2015
Sumário Executivo:
•
•
•
A subida do preço dos alimentos associada ao
impacto negativo das cheias manteve a inflação
mensal elevada em Fevereiro ao nível de
1.56%m/m (mês a mês), após 1.84%m/m em
Janeiro, o que fez acelerar a anual em 1.2pp
(pontos percentuais) para 3.99%a/a (ano a ano)
e a média em 0.14pp para 2.67%. Ainda assim,
parece-nos realista o objectivo do Governo para
este ano de uma inflação média de 5.1%,
anunciado recentemente no âmbito da
preparação do PES (Plano Económico e Social)
e do OGE (Orçamento do Estado) 2015, com a
fragilidade do Metical contra o Dólar a constituir
um dos principais riscos para a inflação este
ano.
A tendência ascendente da inflação muito
provavelmente irá obrigar as autoridades
monetárias a manterem uma política monetária
menos acomodativa, mesmo que não implique
de imediato um aumento da taxa de juro de
referência dos empréstimos overnight do Banco
Central
aos
bancos
comerciais,
FPC,
actualmente fixa em 7.5%. Não se descarta um
provável aumento do coeficiente de reservas
obrigatórias, que se mantém estável em 8%
desde Junho de 2012, e poderá ser accionado
em paralelo com a actual venda de divisas pelo
Banco Central e a emissão de BT ’s (Bilhetes do
Tesouro) que têm retirado alguma liquidez ao
mercado.
Num esforço para reduzir a volatilidade do
Metical face ao Dólar, o Banco Central
continuou a suportar o MCI (Mercado Cambial
Interbancário) com vendas líquidas de divisas
aos bancos comerciais de U$228 milhões em
Fevereiro, após U$164 milhões em Janeiro,
traduzindo-se num desgaste mensal das
Reservas Internacionais Líquidas (RIL’s) de
Executive Summary:
•
•
•
Food price increases, mainly due to recent
floods has kept monthly inflation elevated in
February, at 1.56% m/m/m (month on month)
from 1.84%m/m in January bringing up the
annual figure 1.2pp (percentage points) to
3.99%y/y (year on year), with the average up
0.14pp to 2.67%. Despite this, it looks
achievable the Government inflation target of
5.1% announced under the preparation of 2015
Government Budget and Social and Economic
Plan, documents we expect to be available
towards the end of March as they will be tabled
for discussion at National Parliament. The
Metical weakening against the US Dollar
remains one of the major risks for inflation this
year.
With inflation maintaining an upward trend,
Central Bank is likely to adopt a less
accommodative monetary stance, even if it does
mean immediately an increase in their overnight
reference lending interest rate (FPC), currently
at 7.5%, but with a possible increase in the
reserve requirements ratio that has been stable
at 8% since June 2012. This could be activated
in parallel with current issuance of Treasury Bills
(TBs) and sales for foreign currency which have
helped to withdraw some of the market liquidity.
In an effort to contain the Metical volatility,
Central Bank continued to support the Interbank
Foreign Exchange Market (MCI) with foreign
exchange (fx) sales amounting U$228 million in
February, from U$164 million in January. This
resulted in Net International Reserves (NIR)
plunging 8.8%m/m to U$2.49 billion, with the
import cover ratio down from 4 to 3.5 months, in
terms of gross reserves, below the 4.2 months
target for the year. The Metical closed February
at MCI levels of 32.37 MZM/USD, representing
•
•
8.8%m/m para U$2.49 mil milhões, reduzindo o
rácio de cobertura de importações pelas
reservas brutas de 4 para 3.5 meses,
distanciando-se do objectivo para este ano, de
4.2 meses. No MCI o Metical fechou o mês de
Fevereiro a 32.37 MZM/USD, representando
perdas anuais de 5.6%a/a, com o cambio no
MCI a aproximar-se do novo nível de equilíbrio
das transacções entre os bancos comerciais e
os seus clientes, que se manteve entre os 33 e
34 Meticais por Dólar, mas com fortes sinais de
fragilidade para sustentar esses níveis, com
algumas das transacções efectuadas na terceira
semana de Março a quebrarem a barreira
psicológica dos 40 Meticais por Dólar, mas com
sinais de recuperar para uma banda de variação
entre os 35 e 36 MZM/USD. A fragilidade e
sazonalidade das receitas de exportação e a
dependência na ajuda externa que este ano
poderá atingir entre U$400 e U$500 milhões,
mas com desembolsos mais tardios do que o
habitual, continuam a pressionar o Metical.
Dados recentemente publicados pelo INE
(Instituto Nacional de Estatística) indicam que a
actividade económica manteve-se robusta em
2014, mas com uma desaceleração da
expansão do PIB de 0.6pp último trimestre do
ano para 7%a/a, quando comparado com o
terceiro trimestre. O Governo prevê para este
ano, um crescimento do PIB de 7.5%, o que
nossa opinião, não reflecte ainda de forma
apropriada o efeito negativo das cheias, as
expectativas de desaceleração do investimento
e a forte probabilidade da adopção de uma
política monetária menos acomodativa para
conter a inflação, o que requer uma forte
coordenação com a política fiscal, prevendo-se
que o OGE 2015 apresente um défice fiscal
substancialmente inferior aos 17.5% inscritos no
OGE 2014, necessário para garantir a
sustentabilidade da dívida e despesa públicas, o
que em conjunto poderá cortar entre 0.5 e 1pp o
crescimento previsto para o PIB que poderá
fixar-se entre 6.5% e 7%, ainda assim, robusto.
•
annual losses of 5.6%y/y. By February end, the
gap between the Metical/Dollar exchange rate in
MCI and the one charged by commercial banks
to their clients narrowed to a new short lived
equilibrium level between 33 and 34 Meticais
per Dollar but with difficulties to sustain it, with
data on transactions recorded during the third
week of March indicating that the MZM/USD 40
psychological barer has been temporarily broken
but with signals to recover to a trading range
between 35 and 36. Seasonality and weakness
of export revenue combined with dependence
on foreign aid that could reach between U$400
and U$500 million this year, although with
disbursements expected to occur later than
usual, continues to put pressure on the Metical.
Data recently published by National Statistics’
Institute (INE) indicates that economic activity
remained strong during 2014 but with GDP
decelerating 0.6pp to 7%y/y during the last
quarter of 2014 when compared with the third
quarter. Government is forecasting for 2015 a
GDP growth of 7.5%, a figure that in our opinion
does not reflect at an appropriate magnitude, the
impact of floods, the expected deceleration of
FDI inflows, and the need for a less
accommodative monetary stance to maintain
inflation pressures under control, requiring a
strong coordination with the fiscal policy, with
the 2015 budget expected to show a much lower
deficit than the 2014’s budgeted deficit of 17.5%
of GDP, needed to ensure that both the
government expenditure and debt remains at
sustainable levels. These could cut lower
forecasted GDP growth by 0.5 to 1pp to levels
between 6.5% and 7%, still robust.
Boletim Económico Mensal / Monthly Economic Newsletter
25-Mar-2015
Inflation
Tal como esperado, o IPC (Índice de Preços ao
Consumidor) Moçambique voltou a registar uma
forte inflação mensal em Fevereiro, de 1.56%
m/m (mês a mês), após 1.84% m/m em Janeiro,
o que fez acelerar a anual em 1.2pp (pontos
percentuais) para 3.99%a/a (ano a ano) e a
média em 0.14pp para 2.67%.
As expected, Mozambique CPI (Consumer Price
Index) continued to show a strong inflation in
February, at 1.56% m/m/m (month on month)
from 1.84%m/m in January increasing the
annual figure 1.2pp (percentage points) to
3.99%y/y (year on year), with the average up
0.14pp to 2.67%.
Transportes
Transport
Comunicacoes
Communication
Lazer, recreacao e cultura
Leasure, recreation and culture
Educacao
Education
Restaurantes, hoteis, cafes e similares
Restaurants, hotels, coffe shops and others
Bens e serv icos div ersos
1,32
2,48
0,62
2,45
4,13
8,67
1,05
1,55
2,09
-0,49
12,29
-0,56
0,24
-1,06
-1,44
6,30
0,72
2,16
2,81
-2,31
1,54
0,14
-0,51
1,45
0,67
11,91
0,16
0,53
-0,12
-0,41
3,36
1,32
0,12
0,37
2,69
3,56
13,44
10,47
1,61
38,00
1,61
2,74
3,11
0,90
-0,05
1,29
1
0
Other goods and serv ices
0,72
1,49
0,48
-1,57
3,23
Total (variação anual %/ % annual change)
3,99
2,09
4,22
6,68
100
Média anual (annual average)
2,67
2,14
2,26
3,62
Fonte(Source): Instituto Nacional de Estatistica (Nat. Statistics Institute)
Este aumento continuou a ser determinado
essencialmente pela subida de preço nas
classes de alimentos e educação, com a
primeira a explicar mais de 80%, reflectindo o
efeito
negativo
das
cheias
sobre
a
disponibilidade de produtos agrícolas, e a
segunda como resultado do ajustamento do
custo das propinas e material escolar, nalguns
casos, indexadas ao câmbio do Dólar.
A cidade de Nampula registou a inflação mensal
mais elevada, de 2.61%m/m, traduzindo-se num
aumento de 2.58pp em termos anuais para
6.68%y/y, com a média a subir 28pb (pontos
base) para 3.62%, reflectindo um maior impacto
das cheias sobre a oferta agrícola e infraestruturas, incluindo as de transporte e energia.
Seguiu-se a cidade de Maputo, barómetro do
IPC do país, com uma inflação mensal de
3
Inflação Mensal (Monthly Inflation, Moz CPI)
2
-1
2010
2011
2012
2013
2014
Dez
Health
4,55
Nov
Saude
-0,02
Out
Furniture, decoration and domestic equipment
0,14
Set
Mobiliario, artigos de decoracao, equipamento
1,09
Ago
Housing, w ater, electricity , gas and other fuels
44,93
Jul
Habit., agua, electric., gas e out. combustiv eis
12,36
Jun
Clothing and footw ear
6,84
Mai
Vestuario e calcado
3,42
Abr
Alcoholic bev erages and tobacco
7,36
Mar
Bebidas alcoolicas e tabaco
Fev
Food and non-alcoholic bev erages
Jan
Alimentos e bebidas nao alcoolicas
Moç. Maputo Beira Nam p.
The rise in inflation reflects mainly higher food
and education costs with the first explaining
more than 80% of the increase, translating
mainly the impact of floods on food supply and
the second, reflecting the increase in schooling
materials and fees, some of them Dollar linked.
%
Inflação anual (Annual inflation) y/y %
% pesos medios
(% average weightings)
Inflação
2015
Nampula city recoded the highest monthly
inflation at 2.61%m/m which increased the
annual CPI by 2.58pp to 6.68%y/y with the
average up 28bps (basis points) to 3.62%y/y.
Maputo city, the barometer of the country´s
inflation increased 1.23%m/m mainly reflecting a
higher price of vegetables, which has translated
into 58bps increase in annual inflation to
2.09%y/y, with the average still benefiting from
last year´s low levels, down 2bps to 2.14%.
Beira recorded the lowest inflation at 0.45%m/m,
as a result of a lower growth in food prices, with
the annual and average CPI up 38bps and
30bps, respectively, to 4.22%y/y and 2.26%.
Despite this, it looks achievable the Government
inflation target of 5.1% announced under the
2015 Government Budget and Social and
Economic Plan, documents we expect to be
available towards the end of March as they will
be tabled for discussion at National Parliament.
Alongside the floods impact, we expect the
Metical weakening against the US Dollar to
remain one of the major risks for inflation this
Boletim Económico Mensal / Monthly Economic Newsletter
25-Mar-2015
A cidade da Beira registou a menor inflação
mensal, de 0.45%m/m, reflectindo um aumento
moderado do preço dos alimentos, com o IPC
anual e médio a subirem, respectivamente
38pbs e 30pbs para 4.22%a/a e 2.26%.
Ainda assim, parece-nos realista o objectivo do
Governo para este ano de uma inflação média
de 5.1%, anunciado recentemente no âmbito da
preparação do PES (Plano Económico e Social)
e do OGE (Orçamento do Estado) 2015,
documentos que se espera que fiquem
disponíveis no final do mês.
Para além do choque das cheias, a fragilidade
do Metical em relação ao Dólar constitui um dos
principais riscos para a inflação este ano,
podendo encarecer o preço dos comodities que
o país importa, com impacto no IPC, apesar
destes se manterem deprimidos a nível mundial.
year, with the potential of increasing the cost of
imported commodities with impact in CPI basket,
despite their depressed price globally.
Last year’s low inflation was partially attributed
to the quick recovery of agricultural output from
the negative effects of the floods that affected
the southern region of the country, the
maintenance of stable administered prices and
the strength of the Metical to the Rand making
cheaper the imports from South Africa.
This year, the Rand losses to the US Dollar, at
8.5% y/y in February helped to maintain
relatively stable the exchange rate of the Metical
to the Rand, a situation that may change if the
Metical weakens further to the US Dollar.
Inflação Moç.(Mozambique Inflation)
20
18
Anual (Annual)
16
Média (Average)
14
Annual (forecast)
12
Average (forecast)
10
8
6
Previsão (Forecast)
1.23%m/m com o preço dos vegetais a
contribuir para este aumento, traduzindo-se na
subida da inflação anual em 58pbs para
2.09%a/a mas com a média a beneficiar ainda
do efeito da inflação baixa do ano anterior, ao
cair 2pb para 2.14%.
4
2
Este ano, as perdas do Rand contra o Dólar, de
8.5%a/a em Fevereiro têm ajudado a manter um
Metical estável contra o Rand, uma situação
que poderá ser temporária, se a derrapagem do
Metical contra o Dólar acelerar.
Mercado Monetário
0
Dec/2009
Mar/2010
Jun/2010
Sep/2010
Dec/2010
Mar/2011
Jun/2011
Sep/2011
Dec/2011
Mar/2012
Jun/2012
Sep/2012
Dec/2012
Mar/2013
Jun/2013
Sep/2013
Dec/2013
Mar/2014
Jun/2014
Sep/2014
Dec/2014
Mar/2015
Jun/2015
Sep/2015
Dec/2015
No ano passado, uma parte da estabilidade
local de preços resultou do impacto da rápida
recuperação da produção agrícola após as
cheias que afectaram o sul do país e da
manutenção de preços administrados estáveis,
incluindo os ganhos do Metical contra o Rand
que permitiram estabilizar o custo dos produtos
importados da África do Sul.
Money Market
With inflation maintaining an upward trend,
monetary authorities are likely to adopt a less
accommodative monetary stance, even if they
keep on hold their overnight reference lending
interest rate (FPC), currently at 7.5% following
the 75bp (basis points) cut last November.
18
Taxas de Juro do Mercado Monetário I. & Inflação
Média Maputo (Interbank Money Market Interest
Rates & Maputo Avegare Inflation)
16
O fraco mecanismo de transmissão da política
monetária por via das taxas de juro muito
provavelmente irá determinar que se usem
4
14
12
10
%
8
6
Inflação
(Inflation
FPC
BTs 3M (3Month TBs)
4
2
FPD
0
Dec-09
Feb-10
Apr-10
Jun-10
Aug-10
Oct-10
Dec-10
Feb-11
Apr-11
Jun-11
Aug-11
Oct-11
Dec-11
Feb-12
Apr-12
Jun-12
Aug-12
Oct-12
Dec-12
Feb-13
Apr-13
Jun-13
Aug-13
Oct-13
Dec-13
Feb-14
Apr-14
Jun-14
Aug-14
Oct-14
Dec-14
Feb-15
A tendência ascendente da inflação este ano
muito provavelmente irá obrigar as autoridades
monetárias a manterem uma política monetária
menos acomodativa, mesmo que não implique
de imediato um aumento da taxa de juro de
referência dos empréstimos overnight do Banco
Central
aos
bancos
comerciais,
FPC,
actualmente fixa em 7.5%, após o corte de 75pb
(pontos base) em Novembro de 2014.
The weak interest rate transmission mechanism
Boletim Económico Mensal / Monthly Economic Newsletter
25-Mar-2015
instrumentos alternativos para desacelerar a
expansão dos agregados monetários.
Por essa razão, não se descarta um provável
aumento
do
coeficiente
de
reservas
obrigatórias, que se mantém estável em 8%
desde Junho de 2012, e poderá ser accionado
em paralelo com a actual venda de divisas pelo
Banco Central e a emissão de BT ’s (Bilhetes do
Tesouro) que têm retirado alguma liquidez ao
mercado.
A base monetária, variável operacional da
política monetária começou a desacelerar, com
a expansão anual a baixar de 25.6% em Janeiro
para 21.3% em Fevereiro, com um objectivo
para o final de Março de 18.3% a/a,
correspondendo a um saldo de MT53.6 mil
milhões.
of monetary policy will most probably force
Central Bank to use other tools to decelerate the
growth of monetary aggregates.
For that reason, increases the probably of an
increase in the reserve requirements ratio that
has been stable at 8% since June 2012.
This could be activated in parallel with the
current issuance of Treasury Bills (TBs) and
sales for foreign currency which have helped to
withdraw some of the market liquidity.
Reserve money, the operational variable of
monetary policy has started to decelerate, down
from 25.6% y/y in January to 18.3%yy in
February with the March target at 18.3% y/y,
reflecting a balance of MT53.6 billion.
60
No mercado monetário, as taxas de juro dos
BT´s (Bilhetes do Tesouro) mantiveram uma
ligeira tendência ascendente em Fevereiro,
reflectindo alguma pressão para retirada de
liquidez, com aumentos de 5pb e 2pb para as
maturidades de 3 e 6 meses, respectivamente
para níveis de 5.43% e 6.69%, com os yields a
364 dias a manterem-se inalterados em 7.25%.
Variação % anual de gregados monetários a/a e Taxa
de Juro Prime Rate (Annual change in monetary
agregates and prime lending interest rates)
50
M3
40
Crédito a Economia (PSCE)
%
30
Base Monetária (Reserve Money)
Taxa de Juro Prime (Prime Lending Interest Rate)
20
10
0
Dec-09
Feb-10
Apr-10
Jun-10
Aug-10
Oct-10
Dec-10
Feb-11
Apr-11
Jun-11
Aug-11
Oct-11
Dec-11
Feb-12
Apr-12
Jun-12
Aug-12
Oct-12
Dec-12
Feb-13
Apr-13
Jun-13
Aug-13
Oct-13
Dec-13
Feb-14
Apr-14
Jun-14
Aug-14
Oct-14
Dec-14
Feb-15
Dados sobre o crédito à economia continuam a
indicar uma forte expansão, de 28.5% em
Janeiro, nível similar ao observado em
Dezembro, com a componente em moeda
nacional que representa 79% do financiamento
a crescer 31.7% e a componente em moeda
externa que corresponde a 21% a expandir
17.7%. A massa monetária, M3, já apresenta
sinais de desaceleração com a expansão a
baixar de 22.2% em Dezembro para 20.5% em
Janeiro, como resultado de um crescimento
mais lento dos depósitos, tanto em moeda
nacional como em moeda externa, de 27.3% a/a
e 3.6% a/a, respectivamente o que se traduz
num rácio de conversão de depósitos em
financiamento em moeda nacional de 89% e de
70% em moeda externa.
January data indicates that private sector credit
extension (PSCE) continued to grow fast, at
28.5%y/y, similar to the expansion recorded last
December, with local currency component,
which represents 79% of lending growing 31.7%
y/y and foreign currency loans, growing 17.7%
y/y accounting for 21% of the PSCE. Money
supply (M3) started decelerate, growing 20.5%
in Jan, from 22.2% in Dec, following a slower
growth in deposits, both in local and foreign
currency, at 27.3%y/y and 3.6%y/y, respectively,
which translates into a conversion ratio from
deposits into lending of 89% in local currency
and 70% in foreign currency.
Mercado Cambial
Num esforço para reduzir a volatilidade do
Metical face ao Dólar, o Banco Central
continuou a suportar o MCI (Mercado Cambial
Interbancário) com vendas líquidas de divisas
aos bancos comerciais de U$228 milhões em
Fevereiro, após U$164 milhões em Janeiro,
traduzindo-se num desgaste mensal das
Reservas Internacionais Líquidas (RIL’s) de
5
Money market interest rates increased slightly in
February with the 3 and 6 months TBs up 5 and
2bps respectively, to 5.43% and 6.69%, and the
364 days yield stable at 7.25%, reflecting some
pressure for local currency liquidity withdrawal.
Foreign Exchange Market
In an effort to contain the Metical volatility,
Central Bank continued to support the Interbank
Boletim Económico Mensal / Monthly Economic Newsletter
25-Mar-2015
50
45
9
Reservas (Net International Reserves)
3.000
Meses de cobertura (Import cover months)
2.500
2.000
1.500
35
7
1.000
30
6
500
25
5
20
4
3
MZM/USD
2
MZM/EUR
1
Dec-14
Apr-14
Aug-14
Dec-13
Apr-13
Aug-13
Dec-12
Apr-12
Aug-12
0
Dec-11
Apr-11
Apr-10
Aug-10
Dec-09
Aug-11
MZM/ZAR
0
0
7
7
6
6
5
5
4
4
3
3
2
Dec-09
Feb-10
Apr-10
Jun-10
Aug-10
Oct-10
Dec-10
Feb-11
Apr-11
Jun-11
Aug-11
Oct-11
Dec-11
Feb-12
Apr-12
Jun-12
Aug-12
Oct-12
Dec-12
Feb-13
Apr-13
Jun-13
Aug-13
Oct-13
Dec-13
Feb-14
Apr-14
Jun-14
Aug-14
Oct-14
Dec-14
Feb-15
15
10
MZM/
ZAR
8
5
No final de Fevereiro, o Câmbio do Dólar no
MCI aproximou-se do novo nível de equilíbrio
das transacções entre os bancos comerciais e
os seus clientes, que se manteve entre os 33 e
34 Meticais por Dólar, mas com fortes sinais de
fragilidade para sustentar esses níveis, com
dados das transacções efectuadas na terceira
semana de Março a indicarem que a barreira
psicológica dos 40 Meticais por Dólar foi
temporariamente ultrapassada, mas com sinais
de recuperação para uma banda de variação
entre os 35 e 36 MZM/USD.
A fragilidade e sazonalidade das receitas de
exportação e a dependência da ajuda externa
que este ano poderá atingir entre U$400 e
U$500 milhões, mas com desembolsos mais
tardios do que o habitual, continuam a
pressionar o Metical, num período em que o
Dólar se tem fortalecido a nível mundial
aproximando-se da paridade face ao Euro.
A estes factores, associam-se as expectativas
de desaceleração do investimento directo
estrangeiro (IDE), associadas à queda do preço
do petróleo e do carvão mineral, o que poderá
agravar temporariamente o défice da Conta
Corrente da Balança de Pagamentos, estimado
6
3.500
40
Dec-10
MZM/USD & MZM/EUR
10
Taxas de câmbio no MCI
(MCI foreign exchange rates)
Reservas internacionais liquidas e cobertura de importações
(Net international reserves and import cover)
Months
No MCI o Metical fechou o mês de Fevereiro ao
nível de 32.37 MZM/USD, 2.79MZM/ZAR e
36.39MZM/EUR, representando perdas anuais
de 5.6%a/a face ao Dólar e ganhos de 3%a/a e
14%a/a
contra
o
Rand
e
o
Euro,
respectivamente.
Foreign Exchange Market (MCI) with foreign
exchange (fx) sales amounting U$228 million in
February, from U$164 million in January. This
resulted in Net International Reserves (NIR)
plunging 8.8%m/m to a closing balance of
U$2.49 billion, with the import cover months
when excluding the large projects, down from 4
to 3.5 months, below the 4.2 months target for
the year.
USD million
8.8%m/m para o nível de U$2.49 mil milhões, o
que corresponde a uma descida do rácio de
cobertura de importações de bens serviços não
factoriais, excluindo os grandes projectos, pelas
reservas brutas de 4 para 3.5 meses,
distanciando-se do objectivo para este ano,
fixado em 4.2 meses.
The Metical closed February at MCI levels of
32.37
MZM/USD,
2.79MZM/ZAR
and
36.39MZM/EUR, representing annual losses of
5.6%y/y to the Dollar and gains of 3%y/y and
14%y/y to the Rand and Euro, respectively. By
February end, the
gap between the
Metical/Dollar exchange rate in MCI and the one
charged by commercial banks to their clients
narrowed to a new equilibrium level between 33
and 34 Meticais per Dollar but with difficulties is
sustain it, with data on transactions recorded
during the third week of March indicating that the
MZM/USD
40
psychological
has
been
temporarily broken, but with signals to recover to
a trading range between 35 and 36.
Weaker and seasonal export revenue combined
with fact that the country remains dependent on
foreign aid that could amount between U$400
and U$500 million this year, although with
disbursements expected to occur later than
usual, continues to put pressure on the Metical,
in a period were the US Dollar has strengthened
against the major currencies getting closer to the
parity against the Euro.
Also weighing on the Metical is the expectation
of a decline in foreign direct investment (FDI)
following the sharp decline in oil prices and
weak coal prices, which could temporarily
aggravate the Balance of Payments (BoP)
Current Account (CA) Deficit estimated at 38%
of GDP, although we expect FDI and CA deficit
Boletim Económico Mensal / Monthly Economic Newsletter
25-Mar-2015
em 38% do PIB, embora seja de esperar que a
forte correlação entre o défice da Conta
Corrente e o IDE se mantenha, aliviando a
pressão sobre a conta corrente por via da
redução das importações associadas aos
grandes projectos.
Dados referentes aos primeiros nove meses de
2014 indicam uma melhoria do défice da conta
corrente de 7.8% para U$3.7 mil milhões,
quando comparado com os primeiros nove
meses de 2013, mas uma redução do
investimento directo estrangeiro de 32.1% para
U$3.3 milhões.
Défice da Conta Corrente e Investimento Directo Estrangeiro
(External Current Account Dedifict and FDI)
7,2
6,67,06,2
O sector de serviços que representa a maior
7
7,9
6,3
5,2
7,5 7,6
7,3 7,0
2,7
The first annual preliminary estimates indicate a
GDP growth of 7.4%y/y for 2014, up 0.1pp on
previous year.
500.000
450.000
12%
PIB anual (Annual GDP) base2009
9,9%
10%
8,7%
7,1%7,4%7,1%7,3%7,4%
8%
6,5%
6,5%
5,8%
6%
7,4%
350.000
300.000
465.325
423.733
384.997
345.216
295.179
207.448
200.000
4%
175.150
250.000
2%
Nominal (MT10^6)
2014
2015(*)
2013
2012
2011
0%
2006
150.000
2005
O sector secundário, com menor peso no PIB
(17%), foi o que mais cresceu, 10.4%,
reflectindo uma forte expansão da indústria
transformadora, da construção e dos ramos da
electricidade e água, de 11.3%, 10.5% e 7.1%,
respectivamente.
7,8
6,1 6,3
0,6
400.000
Para o ano como um todo, a primeira estimativa
preliminar do INE indica um crescimento do PIB
de 7.4%a/a, mais 0.1pp do que o observado em
2013.
11,2
9,8
9,5
2010
Dados recentemente publicados pelo INE
(Instituto Nacional de Estatística) indicam que a
actividade económica manteve-se robusta em
2014, mas com uma desaceleração da
expansão do PIB de 0.6pp último trimestre do
ano para 7%, quando comparado ao terceiro
trimestre.
7,7
267.945
Actividade Económica
14,8
2008
Com a redução da oferta de divisivas, o Metical
parece ter perdido a “imunidade” que manteve
nos últimos 24 meses ao impacto negativo
sobre o ambiente de negócios da tensão
política, dos raptos e crimes violentos.
16
14
12
10
8
6
4
2
0
2009
-8.000
Variacao% PIB real trimestral a/a 2009-2014
(Change% Quarterly real GDP y/y) 2009 -2014)
237.549
-6.000
Data recently published by National Statistics’
Institute (INE) indicates that economic activity
remained strong during 2014 but with GDP
decelerating 0.6pp to 7% during the last quarter
of 2014 when compared with the third quarter.
2007
2014 (9M)
2013
2013 (9M)
Deficit da Conta
Corrente (Current
Account Deficit)
2012
2011
0
2010
USD 10^6
2.000
-4.000
With the decline in fx supply, the Metical seems
to have lost its “immunity” to the negative impact
on business over the past 24 months of local
political tension, kidnapping and violent crimes.
2009 Q4
2010 Q1
2010 Q2
2010 Q3
2010 Q4
2011 Q1
2011 Q2
2011 Q3
2011 Q4
2012 Q1
2012 Q2
2012 Q3
2012 Q4
2013 Q1
2013 Q2
2013 Q3
2013 Q4
2014 Q1
2014 Q2
2014 Q3
2014 Q4
Investimento Directo
Estrangeiro (Foreign
Direct Investment)
4.000
-2.000
Available data for the first nine months of 2014
shows an ease in current account deficit by
7.8% to a balance of U$3.7 billion, when
compared with the same period of 2013
although with a larger decline in FDI of 32.1% to
U$3.3 billion.
Economic Activity
8.000
6.000
to remain strongly correlated which means that a
decline in FDI would led to an ease on imports
attributed to the large projects, easing the deficit.
Cresc Real (Real Growth)
Secondary sector, accounting with 17% for the
GDP grew faster, 10.4%y/y, as a result of strong
Boletim Económico Mensal / Monthly Economic Newsletter
25-Mar-2015
fatia do PIB (51%) cresceu 8.2%, como
resultado da forte expansão dos serviços
financeiros, da administração pública e do
comércio, de 29.6%, 12.2% e 7.3%,
respectivamente.
O sector primário, que representa 28% do PIB,
cresceu 7%, reflectindo uma expansão da
actividade mineira de 13%, uma forte
recuperação da agricultura do efeito das cheias
do início de 2014 que cresceu 6.4% e um
crescimento de 5.3% no ramo das pescas.
29,6%
Crescimento Real do PIB 2014 (base 2009)
(Real GDP Growth 2014, new base 2009)
35%
expansions in manufacturing, construction and
electricity & water activities, respectively at
11.3%, 10.5% and 7.1%.
This was followed by the services sector which
accounts for 51% of GDP and expanded 8.2%
y/y on the back of a strong growth in financial
services of 29.6% and expansions of 12.2% and
7.3% in public administration and trade.
The primary sector which accounts for 28% of
GDP expanded 7%, fueled by the 13% growth in
mining, 6.4% growth in agriculture, reflecting a
strong recovery for the floods of the beginning of
2014, and fishing activities which expanded
5.3% y/y.
6,2%
Outras Activ e Serv… 0,9%
Saúde e Acção Social…
12,2%
6,1%
Estrutura do PIB 2014 base 2009
(GDP Structure 2014 new base 2009)
Educação (Education)
Adm.Publica Defesa &…
Activ.Imobiliarias (Property) 1,2%
4,6%
Activ.Financeiras…
3,5%
Alojam.Restaurantes…
Comércio (Trade)
Prod&Distrib Electr&Gás…
Construção (Construction)
Ind.Extractivas (Extractive…
Pescas (Fisheries)
Agricultura (Agric.)
0%
Manufactura (Manufacturing)
5%
Transp.Armaz. e Com.…
10,5%
7,3%
10%
6,4%
15%
5,3%
20%
7,1%
13,0%
25%
11,3%
30%
Activ.Imobiliar
ias (Property)
7,0%
Activ.Financei
ras (Financial
Activities)
6,6%
Transp.Arma
z. e
Comunicaçõe
s (Transport
Storage
&Com.)
8,8%
Outros
(Others)
22,6%
Comércio
(Trade)
10,1%
Agricultura
(Agriculture)
23,4%
Pescas
(Fisheries)
1,7%
Ind.Extractiva
s (Extractive
Industries)
3,1%
Manufactura
(Manufacturin
g)
11,3%
Prod&Distrib
Electr&Gás
Construção (Electricity &
(Construct.)
Gas)
2,6%
2,9%
O Governo prevê para este ano, um
crescimento do PIB de 7.5%, o que nossa
opinião, não reflecte ainda de forma apropriada
o efeito negativo das cheias, as expectativas de
desaceleração do investimento e a forte
probabilidade da adopção de uma política
monetária menos acomodativa para conter a
inflação, o que requer uma forte coordenação
com a política fiscal, prevendo-se que o OGE
2015
apresente
um
défice
fiscal
substancialmente inferior aos 17.5% inscritos no
OGE 2014, necessário para garantir a
sustentabilidade da dívida e despesa públicas, o
que em conjunto poderá cortar entre 0.5 e 1pp o
crescimento previsto para o PIB que poderá
fixar-se entre 6.5% e 7%.
Government is forecasting for 2015 a GDP
growth of 7.5%, a figure that in our opinion does
not reflect at an appropriate magnitude, the
impact of floods, the expected deceleration of
FDI inflows, and the need for a less
accommodative monetary stance to maintain
inflation pressures under control, requiring a
strong coordination with the fiscal policy, with
the 2015 budget expected to show a much lower
deficit than the 2014’s budgeted deficit of 17.5%
of GDP, needed to ensure that both the
government expenditure and debt remains at
sustainable levels. These could cut forecasted
GDP growth by 0.5 to 1pp to levels between
6.5% and 7%.
Ainda assim, este crescimento esperado é
considerado robusto, o que reflecte a natureza
relativamente
diversificada
da
economia
moçambicana, as boas perspectivas para a
agricultura, sector que representa 23.4% do PIB
apesar das recentes cheias que destruíram 142
hectares de área cultivada, traduz ainda as
fracas ligações entre a economia doméstica e o
resto do mundo, com a indústria extractiva ainda
em fase de arranque, representando menos de
Nonetheless, the expected growth remains
robust, translating the relatively diversified
nature of the local economy, the positive
prospects for agriculture, despite recent floods
which affected 142ha of cultivated land, a sector
which accounts for 23.4% of GDP, also reflects
the Mozambican economy relatively weak
linkages to the rest of the world, with resources
sector being at an infant stage representing
currently less than 4% of GDP, although
historically a strong contributor for FDI and fx
8
Boletim Económico Mensal / Monthly Economic Newsletter
25-Mar-2015
4% do PIB, embora historicamente tenha
contribuído fortemente para os influxos de
moeda externa e IDE, ajudando a manter a
estabilidade cambial, com uma parte substancial
do recente desenvolvimento da fraca base de
infra-estruturas do país a dever-se a este sector.
Espera-se que o consumo privado, que cresceu
em termos reais 5.2% em média nos últimos 10
anos (dados até 2013) e representa perto de
70% do PIB continue a expandir de forma
robusta, considerando que a inflação se
mantenha baixa, o que poderá ajudar a
compensar a esperada desaceleração na
despesa do Governo que representa 20% do
PIB e cresceu 10.3% na última década, e na
despesa de investimento que representa 20%
do PIB e cresceu 7.3% no mesmo período, com
o sector externo a registar uma contribuição
negativa de -10% do PIB, reflectindo um valor
de importações tradicionalmente superior às
exportações.
9
inflows which helped to maintain currency
stability with a large portion of the recent
developments
in
the
country´s
weak
infrastructure base promoted by this sector.
Private consumer spending averaging 5.2% real
growth over the past ten years (2013 data),
which accounts for nearly 70% of GDP is
expected to continue to pick up as inflation
remains relatively low which should help to
compensate for the expected ease in
Government consumption which accounts for
nearly 20% of GDP and grew 10.3% over the
past decade with investment expenditure
accounting for another 20% of GDP (7.3% real
growth) helping to compensate for the net
negative impact of external sector of -10% of
GDP translating higher imports than exports.
Boletim Económico Mensal / Monthly Economic Newsletter
25-Mar-2015
Anexo (Appendix): Indicadores Macroeconómicos (Macroeconomic Indicators)
Indicadores (Indicators)
Unidade (Unit)
PIB nominal (Nominal GDP)**
PIB nominal (Nominal GDP)**
PIB real (Real GDP)**
PIB real (Real GDP)**
MZN
USD
MZN
variacao % (% change)
PIB per capita (Per capita GDP)
Escala
(scale)
10^6
10^6
10^6
USD
Populacao (Population)
habitantes (Inhabitants)
Inflacao media (Average Inflation) - Maputo
variacao % (% change)
10^6
2010
2011
2012
2013
343.648
10.467
314.917
6,8
383.609
14.134
338.281
7,4
423.733
14.359
362.211
7,1
465.325
15.537
388.696
7,3
2014(*)
2015(*)
2016(*)
2017(*)
2018(*)
2019(*)
534.998 603.000 689.000 784.000 894.000 1.017.000
29.057
17.398 18.109 19.686 22.400 25.543
417.353 444.481 480.484 517.962 559.399
601.913
7,8
8,0
7,6
6,5
8,1
7,4
467
613
606
638
695
704
745
826
917
1.017
22,4
23,0
23,7
24,4
25,0
25,7
26,4
27,1
27,8
28,6
10,4
2,1
4,2
2,3
3,7
5,6
5,6
5,6
5,6
Taxa de cambio media (Average exchange rate)
Taxa de cambio fdp (End of period exchange rate)
MZN/USD
MZN/USD
33,2
32,8
28,8
27,1
28,3
29,5
29,9
30,0
30,8
31,6
33,3
35,0
35,0
35,0
35,0
35,0
35,0
35,0
35,0
35,0
Taxa de juro da FPC (fdp-fim de periodo)
(Central Bank overnigth lending rate, end of period)
por cento (percentage)
15,5
15,0
9,5
8,3
7,5
7,5
7,5
7,5
7,5
7,5
Taxa de juro prime media do mercado
(Market average prime lending rate)
por cento (percentage)
19,0
19,1
15,5
15,0
14,8
14,0
12,5
12,5
12,5
12,5
-14,6
2.333
-3.512
1.917
-21,2
3.118
-5.368
2.240
5,2
-44,4
3.856
-7.903
2.605
4,8
-37,9
4.123
-8.480
2.996
4,8
-38,3
4.774
-7.914
2.882
4,0
-47,5
5.987,0
-50,5
-45,0
-55,5
-55,5
24,6
29,3
29,2
38,8
26,9
9,2
7,8
6,4
8,5
37,5
25,6
8,9
29,4
19,9
19,7
43,9
27,8
9,7
16,3
28,7
15,7
46,5
32,6
10,2
22,2
28,3
20,5
49,4
36,4
10,7
18,0
18,0
18,5
15,2
16,3
14,9
15,1
16,5
14,9
15,1
16,4
15,0
15,2
16,4
15,1
Deficit da conta corrente (Current account deficit)
Exportacoes de bens (Exports of goods)
Importacoes de bens (Imports of goods)
Reservas Internac. Liq. (Net Internat. Reserves)
Cobertura importacoes exc.g.p. (Import cover excl. l
M3, massa monetaria (M3, money supply)
Credito a economia (Private sector credit ext.
Base monetaria (Reserve money)
M3, massa monetaria (M3, money supply)
Credito a economia (Private sector credit ext.
Base monetaria (Reserve money)
% do PIB (% of GDP)
USD
USD
USD
meses (months)
variacao % (% change)
variacao % (% change)
variacao % (% change)
% of GDP
% of GDP
% of GDP
%
10^6
10^6
10^6
95.538 120.492 155.574
Receita Fiscal (Fiscal Revenue) (***)
MZN
10^6
65.960
79.158
10^6
117.977 141.757 163.035 196.372 249.094
Despesa Total (Total Expenditure) (***)
MZN
MZN
10^6
-52.017 -62.599 -67.497 -75.880 -93.520
Deficit Global (Global Deficit) (***)
22,5
25,9
29,1
Receita Fiscal (Fiscal Revenue) (***)
% of GDP
%
19,2
20,6
34,3
37,0
38,5
42,2
46,6
Despesa Total (Total Expenditure) (***)
% of GDP
%
%
-15,1
-16,3
-15,9
-16,3
-17,5
Deficit Global (Global Deficit) (***)
% of GDP
Fontes (Sources): Standard Bank, Banco de Mocambique, Governo de Mocambique, INE, FMI
Notas notes: (*) dados a cinzento indicam previsao, estimativa (grey data indicates forecast, estimate)
(**) Ano base do PIB alterado de 2003 para 2009 em Jul2014 (GDP base year changed from 2003 to 2009 during July2004)
(***) Orcamento Geral do Estado (Government Budget)
10
3.623,0
4,2
Boletim Económico Mensal / Monthly Economic Newsletter
25-Mar-2015
Nota
Disclaimer
Este documento foi preparado com base em
informação de fontes que o Grupo Standard
Bank acredita e são confiáveis. Apesar de todo
o cuidado ter sido tomado na elaboração deste
documento, nenhum analista ou membro do
Grupo Standard Bank fornece qualquer garantia
ou aceita qualquer responsabilidade sobre a
informação contida neste documento. Todas as
opiniões, previsões e estimativas contidas neste
documento podem ser alteradas após a sua
publicação e a qualquer momento, sem aviso
prévio. O desempenho histórico não é indicativo
de resultados futuros. Os investimentos e
estratégias discutidos aqui podem não ser
adequados para todos os investidores ou
qualquer grupo particular de investidores. Este
documento
foi
elaborado
para
efeitos
informativos, apenas para clientes do Standard
Bank ou potenciais clientes e não deve ser
reproduzido ou distribuído a qualquer outra
pessoa sem o consentimento prévio de um
membro do Grupo Standard Bank. O uso não
autorizado deste documento é estritamente
proibido. Ao aceitar este documento, concorda
ser guiado pelas limitações que existem ou que
venham a existir. Copyright 2015 Standard Bank
Group. Todos os direitos reservados.
This research report is based on information
from sources that Standard Bank Group
believes to be reliable. Whilst every care has
been taken in preparing this document, no
research analyst or member of the Standard
Bank Group gives any representation, warranty
or undertaking and accepts responsibility or
liability as to the accuracy or completeness of
the information set out in this document. All
views, opinions, estimates contained in this
document may be changed after publication at
any time without notice. Past performance is not
indicative of future results. The investments and
strategies discussed here may not be suitable
for all investors or any particular class of
investors. This report is intended solely for
clients and prospective clients of members of
Standard Bank Group and may not be
reproduced or distributed to any other person
without the prior consent of a member of the
Standard Bank Group. Unauthorized use or
disclosure of this document is strictly prohibited.
By accepting this document, you agree to be
bound by the foregoing limitations. Copyright
2015 Standard Bank Group. All rights reserved.
11
Baixar