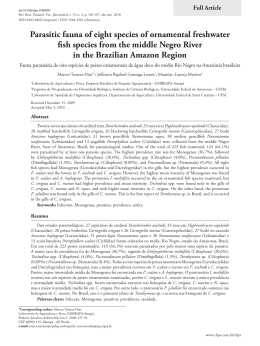
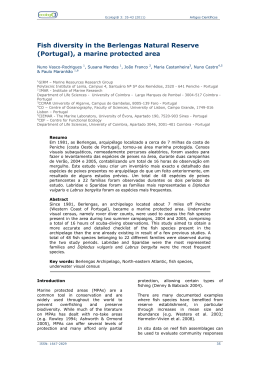
Biodiversity and Conservation 12: 1287–1295, 2003. 2003 Kluwer Academic Publishers. Printed in the Netherlands. Analysis of the marine ornamental fish trade at Ceara´ State, northeast Brazil CASSIANO MONTEIRO-NETO 1,2, *, FRANCISCA EDNA DE ANDRADE CUNHA2 , MARA CARVALHO NOTTINGHAM 2 , MARIA ELIZABETH ˆ LUCENA ROSA3 and GLAURA MARIA LEITE ´ 2 , IERECE ARAUJO 4 BARROS 1 ´, Departamento de Biologia Marinha, Universidade Federal Fluminense, Caixa Postal 100.644, Niteroi RJ 24001 -970, Brazil; 2 Grupo de Ictiologia Marinha Tropical – IMAT, Campus do Pici, s /n, ´ ´ de Biologia Aquatica , Universidade Federal do Departamento de Engenharia de Pesca, Laboratorio 3 ´ e Ecologia, Ceara´ , Fortaleza, RJ CEP 60356 -000, Brazil; CCEN, Departamento de Sistematica ˜ Pessoa, PB 58059 -900, Brazil; 4 Instituto Brasileiro do Meio ´ , Joao Universidade Federal da Paraıba ´ , Av, Visconde do Rio Branco 3900, Fortaleza, CE Ambiente e dos Recursos Naturais Renovaveis-CE 60025 -062, Brazil; * Author for correspondence (e-mail: monteiro@ vm.uff.br; fax: 155 -21 -2629 -3486) Received 24 January 2002; accepted in revised form 3 July 2002 Key words: Marine aquarium fish, Monitoring, Northeast Brazil, Trade Abstract. Brazil is one of the leading exporters of ornamental fishes, mostly freshwater; however, monitoring of the trade is nearly non-existent in the country. This paper provides an initial assessment of a new venture, the marine aquarium fish trade at Ceara´ State, northeast Brazil, aiming to document the species traded, to provide preliminary estimates of numbers of specimens traded, and to identify priorities in data collection and monitoring. A total of 143 species and 199 304 fishes were traded. From the total, 109 species were native and represented 84% of the fishes traded. Thirty-four exotic species figured on the permits and amounted to nearly 16% of the exports; however, most of them consist of misidentified native species. Nearly 90% of the fish trade was directed to the international market. Official figures represent an underestimation of the total number of captured specimens. Introduction The ornamental fish trade is an expanding multi-million dollar market with considerable growth in the last two decades (Cheong 1996). The approximate global import value of ornamental fishes is US$ 321 million (Dawes 2001), from which US$ 21–48 million belong to the marine ornamental fish trade (Wood 2001). Due to the considerable growth and diversification in the international ornamental fish trade, there is a concern about the possible effects on the conservation of wild populations (Andrews 1990). Although some initiatives have promoted the sustainable use of ornamental fish resources (Baquero 2001; Chao 2001), this concern is particularly relevant to the marine aquarium trade, as virtually all commercial fish species are collected in the wild (Wood 2001). The largest suppliers of marine ornamental fishes are Indonesia and the Philippines (Wood 2001). Brazil is one of the leading exporters of freshwater ornamental 1288 fishes (Prang 2001), but also appears as a consistent supplier of marine species (Wood 2001). Despite the increasing demand for tropical marine fishes, monitoring of the trade is nearly non-existent in Brazil. Official records of the marine ornamental fish trade are not consistent from year to year and do not cover all coastal states. Conservation measures and catch quotas established by the national authority for the environment, IBAMA (Instituto Brasileiro do Meio Ambiente e dos Recursos Naturais Re´ novaveis), are ineffective due to the lack of baseline data. In a recent effort to overcome this gap, Nottingham et al. (2000) provided information about handling, keeping and transporting marine ornamental fish. A substantial part of the marine ornamental fish trade is supported by fish ´ is collections in northeast Brazil. The city of Fortaleza, the state capital of Ceara, becoming one of the main centers of the marine ornamental fish trade. Nevertheless, very little is known about the species captured, their population status, and collection areas. This paper provides an initial assessment of the marine aquarium fish trade in Ceara´ State, northeast Brazil. The objectives are to document the species traded, to provide preliminary estimates of numbers of specimens traded, and to identify priorities in data collection and monitoring to support policies for the marine aquarium trade in Brazil. Materials and methods Data were obtained from trade permit forms filed by wholesalers for individual shipments at the regional IBAMA (Brazil’s environmental agency) office at Fortaleza. Permit forms covered the periods between January 1995 and July 1997, and from August 1998 to October 2000. From August 1997 to July 1998, the permit form system was suspended. Information contained on permits included the name of the wholesaler, name of the buyer (national / international), country of destiny, a species list, the number of individuals / species being shipped, and the retail price. Data were compiled on electronic spreadsheets, and double checked through interviews with the wholesalers. Species names compiled from the permit forms were compared to the available information in the literature to check for misidentifications based on geographical ranges (Lima 1969; Mayland 1976; Figueiredo and Menezes 1978, 1980; Menezes and Figueiredo 1980, 1985; Migdalski and Fichter 1983; Humann and Deloach 1994; Randall 1996; Froeser and Pauly 2001). Genera and species names were kept as originally listed on the permit forms. Results and discussion A total of 143 species and 199 304 individuals of marine ornamental fishes were traded through the Fortaleza market. From the total, 109 species were native and represented 84% of the fishes traded. Thirty-four exotic species represented nearly 1289 ´ Brazil, from Table 1. Species list and number of marine aquarium fishes traded at Fortaleza, Ceara, January 1995 to November 2000, including native and exotic species. Species No. % Species No. % Native species Holacanthus ciliaris Pomacanthus paru Hippocampus erectus Pomacanthus arcuatus Holacanthus tricolor Centropyge aurantonotus Acanthurus bahianus Acanthurus coeruleus Bodianus rufus Chaetodon ocellatus Chaetodon striatus Equetus acuminatus Abudefduf saxatilis Selene vomer Cyclichthys schoepfi Halichoeres cyanocephalus Stegastes variabilis Bodianus pulchellus Dactylopterus volitans Balistes vetula Trachinotus carolinus Anisotremus virginicus Chaetodipterus faber Canthigaster rostrata Chaetodon sedentarius Diodon hystrix Haemulon plumieri Ophioblennius atlanticus Scarus vetula Amblycirrhitus pinos Prionotus punctatus Halichoeres radiatus Pseudupeneus maculatus Scarus coeruleus Alphestes afer Lactophrys polygonia Aulostomus maculatus Halichoeres poeyi Aluterus scriptus Narcine brasiliensis Stegastes pictus Halichoeres maculipinna Halichoeres bivittatus Apogon maculatus Xyrichthys novacula Gymnothorax spp. Chromis scotti Ogcocephalus spp. 43 730 22 969 12 586 12 196 8756 5741 5622 5304 3716 3455 3096 2679 2469 2244 2223 1978 1883 1658 1648 1607 1293 1254 1137 1065 984 896 831 668 655 592 570 567 541 535 516 516 487 485 458 467 397 346 334 305 303 289 283 283 21.94 11.52 6.31 6.11 4.39 2.88 2.82 2.66 1.86 1.73 1.55 1.34 1.23 1.12 1.11 0.99 0.94 0.83 0.82 0.80 0.64 0.62 0.57 0.53 0.49 0.45 0.41 0.33 0.32 0.29 0.28 0.28 0.27 0.26 0.25 0.25 0.24 0.24 0.23 0.23 0.19 0.17 0.16 0.15 0.15 0.14 0.14 0.14 Halichoeres spp. Acanthurus chirurgus Thalassoma spp. Acanthostracion quadricornis Microspathodon chrysurus Scarus spp. Gymnothorax funebris Cantherhines macroceros Antennarius multiocellatus Equetus lanceolatus Myrichthys oculatus Apogon pseudomaculatus Diodon spp. Chromis multilineatus Chromis spp. Ginglymostoma cirratum Sphoeroides spengleri Paraclinus fasciatus Ogcocephalus nasutus Rhinobatos percellens Serranus baldwini Cantherhines pullus Myripristis jacobus Parupneus sp. Lutjanus analis Serranus flaviventris Opistognathus aurifrons Pomacanthus spp. Gymnothorax moringa Halichoeres garnoti Scorpaena brasiliensis Sparisoma viride Serranus tortugarum Acanthurus spp. Stegastes spp. Gymnothorax vicinus Echeneis naucrates Eupomacentrus spp. Antennarius spp. Muraena miliaris Monacanthus hispidus Scorpaena plumieri Cephalopholis cruentata Chilomycterus antillarum Malacanthus plumieri Lactophrys spp. Dasyatis guttata Canthidermes maculatus 214 210 208 205 165 145 140 137 131 129 128 125 110 100 94 81 81 75 74 72 70 69 65 63 60 52 51 50 49 49 49 49 40 35 34 27 219 26 24 24 14 13 10 10 7 6 5 4 0.10 0.10 0.10 0.10 0.08 0.07 0.07 0.06 0.06 0.06 0.06 0.06 0.05 0.05 0.04 0.04 0.04 0.03 0.03 0.03 0.03 0.03 0.03 0.03 0.03 0.02 0.02 0.02 0.02 0.02 0.02 0.02 0.02 0.01 0.01 0.01 0.11 0.01 0.01 0.01 – – – – – – – – 1290 Table 1. (continued) Species No. % Species No. % Cephalopholis fulva Rhinobatos spp. Ogcocephalus vespertilio Bathygobius soporator Chromis flavicauda Xyrichthys splendens Exotic species Gramma loreto Gobiosoma evelynae Hippocampus kuda Apogon aurolineatus Sphoeroides marmoratus Hippocampus mohnikei Ogcocephalus radiatus Lactoria cornuta Stegastes leucostictus Bothus leopardus Antennarius biocellatus Thalassoma bifasciatum Pseudopleuronectes americanus Ogcocephalus corniger Sparisoma atomarium Apolemichthys xanthurus Caulolatilus chrysops Total species 259 245 240 236 227 226 0.13 0.12 0.12 0.11 0.11 0.11 Lactophrys quadricornis Bodianus spp. Centropyge spp. Epinephelus guttatus Trachinotus goodei Lactophrys trigonus 4 3 2 2 2 1 – – – – – – 8797 8283 7558 1187 1085 965 716 510 288 282 276 217 206 168 142 135 126 143 4.41 4.15 3.79 0.59 0.54 0.48 0.35 0.25 0.14 0.14 0.13 0.11 0.10 0.08 0.07 0.06 0.06 Chromis cyaneus Rhinobatus armatus Zapteryx exasperata Aluterus schoepfi Pomacanthus maculosus Gymnothorax castaneus Halichoeres nicholsi Prionotus ophryas Halichoeres bathyphilus Centropyge acanthops Chilomycterus affinis Myrichthys maculosus Pomacentrus vaiuli Labrisomus bucciferus Antennarius hispidus Pomacanthus zonipectus Pterois volitans Total abundance 122 102 84 50 25 24 22 15 12 10 10 7 7 5 2 2 2 199.304 0.06 0.05 0.04 0.02 0.01 0.01 0.01 – – – – – – – – – – 100.00 16% of the exports (Table 1), but most of these represented native species misidentified by untrained wholesalers (e.g. Hippocampus kuda ¯ Hippocampus erectus or H. reidi). Five native species, Holacanthus ciliaris, Pomacanthus paru, Hippocampus erectus, Pomacanthus arcuatus and Holacanthus tricolor, made up 50% of the total trade between 1995 and 2000. The top two species together represented 33% of this total (Table 1). Among the misidentified exotic species, Gramma loreto (¯Gramma brasiliensis), Gobiosoma evelynae (¯Elacatinus figaro) and Hippocampus kuda (¯Hippocampus erectus or H. reidi) together represented 12% of the exports. One hundred and twenty-five species were traded occasionally and each represented less than 1% of the total trade (Table 1). Although the total number of native species exploited was probably correct, the total number of fishes harvested and exported was underestimated. When the cargo is ready for shipment, wholesalers often declare fewer fishes than they are actually exporting, to pay less taxes and keep annual shipments within their individual allowable quota of 5000 fishes per year. During the period 1995–1997, between two and six wholesalers were operating in the market, and sales remained around 13 000 and 15 000 fishes per year (Figures 1 and 2). In 1999–2000, the number of fishes traded drastically increased to values around 60 000–80 000 fishes per year, with a total of eight traders in the market (Figure 1). These figures indicate that the trade in tropical marine aquarium fishes at 1291 Figure 1. Number of fishes traded and number of wholesalers per semester, in the marine ornamental fish market at Ceara´ State, Brazil, from 1995 to 2000. Ceara´ is a growing business, attracting both businessmen and fishers into the market. However, only a few keep their production steady for more than 1 year. During the period covered in this study only three companies traded fish consistently. Problems related to the high investments to keep up the quality control during capture and handling (Nottingham et al. 2000), and the market demand for top quality fish, probably discouraged entrepreneurs after their first year of operation. The trade was usually higher in the second half of the year (Figure 2). Monthly production was lowest during January but gradually increased towards the end of the year, reaching its peak in October, and decreasing again in November and December (Figure 2). This pattern was consistent between years, and probably reflected a higher demand from the international market during the northern hemisphere Fall and early Winter. During the colder Winter months hobbyists usually spend more Figure 2. Number of fishes traded per month in the marine ornamental fish market at Ceara´ State, Brazil, from 1995 to 2000. 1292 time indoors taking care of their aquaria (Hudson Crizanto, personal communication). Similarly, Cheong (1996) observed that the largest quantities of freshwater fishes were exported from Singapore towards the end of the year. Holacanthus ciliaris and Pomacanthus paru were the top target species in the ´ and together represented nearly 75% of the marine ornamental fish trade at Ceara, total fish traded in 1995 (Figure 3). However, after 1997 there was an increase in the relative abundance of other species, such as Pomacanthus arcuatus (grey angelfish), Acanthurus bahianus (ocean surgeon), Gramma loreto (fairy basslet), and Hippocampus erectus (seahorse) (Figure 3). Fish groups at risk may include endemic species such as Gramma brasiliensis (¯G. loreto), those species with restricted distribution (Andrews 1990) and subjected to localized fishing pressure (Wood 2001), and species which are already threatened (Hippocampus erectus, Balistes vetula), due to other forms of commercial exploitation (Hilton-Taylor 2000). Removal of key species is another aspect of the trade that deserves attention. At Ceara´ and other northeastern Brazilian states the neon goby (Elacatinus figaro ¯ Gobiosoma evelynae in Table 1), a cleaner species, is traded in large numbers. Cleaner species play an important ecological role in reef areas, and their removal may negatively affect other fish species, including commercially important ones. For instance, it is known that the cleaner wrasse, Labroides dimidiatus, maintains cleaning stations which are loci of high ‘point diversity’ on the reef. As noted by Wood (2001), the secondary effects of the removal of this species for the fish trade are unknown. Nearly 90% of the fish trade was directed to the international market, involving 123 buyers from 19 countries. Considering the number of fishes traded, the USA was by far the largest market, and accounted for 44.8% (89 207 fishes) of the total international trade, followed by Japan and Italy (Figure 4a). Previous authors had already observed that aquarists in North America, Europe and Japan buy the bulk of ornamental fishes traded in the world (Andrews 1990; Davenport 1996; Chapman et al. 1997). Figure 3. Relative percent abundance of the five most abundant species traded in the marine ornamental fish market at Ceara´ State, Brazil, from 1995 to 2000. 1293 Figure 4. Number of buyers and number of fishes sold to the international (a) and national (b) marine ornamental fish markets. Thirty-four buyers from 13 states in Brazil bought fish from Ceara´ traders. Most of the shipments were forwarded to Rio de Janeiro and Bahia, which also had the largest numbers of buyers (Figure 4b). Population estimates for species in the aquarium trade are not available for Ceara´ or elsewhere, and the number of fishes traded is the only available information to date. Nevertheless, Nottingham et al. (2000) reported fish mortalities and losses during the collection process reaching as much as 10% of the total harvest. The high mortality in the collection process indicates that the official figures represent an underestimation of the total number of captured specimens. This aspect of the trade should be closely monitored to reduce losses and to guarantee that mortality rates are taken into account when collection quotas are established. In conclusion, the marine ornamental fish trade at Ceara´ is a growing business 1294 which should be more carefully monitored. Fish lists supplied by the dealers to IBAMA often contain misidentified species and underestimate the numbers of exported fish to reduce costs and circumvent the established quotas. IBAMA officials involved with permit issuing should receive training in marine fish identification and have access to updated fish identification guides. Lastly, the biology of target species should be investigated. The information generated should provide additional elements to the permit issuing process. Acknowledgements We thank Hudson Crizanto and Joseline Veras Kauling for their help and interest in the course of this work. Research was partly funded by the Instituto Brasileiro do ´ Meio Ambiente e dos Recursos Naturais Renovaveis (IBAMA). The Conselho ´ ´ Nacional de Desenvolvimento Cientıfico e Tecnologico (CNPq) provided assistance through a Research Fellowship for C.M.-N. References Andrews C. 1990. The ornamental fish trade and conservation. Journal of Fish Biology 37: 53–59. Baquero J. 2001. The trade of ornamental fish from the Philippines. In: Chao L.N., Petry P., Prang G., Sonneschien L. and Tlusty M. (eds), Conservation and Management of Ornamental Fish Resources of the Rio Negro Basin, Amazonia, Brazil – Project Piaba. EDUA, Manaus, Brazil, pp. 75–86. Chao L.N. 2001. The fishery, diversity and conservation of ornamental fishes in the Rio Negro Basin, Brazil – A review of Project Piaba (1989–1999). In: Chao L.N., Petry P., Prang G., Sonneschien L. and Tlusty M. (eds), Conservation and Management of Ornamental Fish Resources of the Rio Negro Basin, Amazonia, Brazil – Project Piaba. EDUA, Manaus, Brazil, pp. 161–204. Chapman F.A., Fitz-Coy S.A., Thunberg E.M. and Adams C.M. 1997. United States of America trade in ornamental fish. Journal of the World Aquaculture Society 28: 1–10. Cheong L. 1996. Overview of the current international trade in ornamental fish, with special reference to Singapore. Revue Scientifique et Technique de l’Office International des Epizoonties 15: 445–481. Davenport K.E. 1996. Characteristics of the current international trade in ornamental fish, with special reference to the European Union. Revue Scientifique et Technique de l’Office International des Epizoonties 15: 435–443. Dawes J. 2001. International aquatic industry perspectives on ornamental fish conservation. In: Chao L.N., Petry P., Prang G., Sonneschien L. and Tlusty M. (eds), Conservation and Management of Ornamental Fish Resources of the Rio Negro Basin, Amazonia, Brazil – Project Piaba. EDUA, Manaus, Brazil, pp. 100–121. Figueiredo J.L. and Menezes N.A. 1978. Manual de peixes marinhos do sudeste do Brasil. Teleostei, v. 3, ˜ Paulo, Sao ˜ Paulo, 90 pp. n. 2. Museu de Zoologia, Universidade de Sao Figueiredo J.L. and Menezes N.A. 1980. Manual de peixes marinhos do sudeste do Brasil. Teleostei, v. 2, ˜ Paulo, Sao ˜ Paulo, 110 pp. n. 1. Museu de Zoologia, Universidade de Sao Froeser R. and Pauly D. (eds) 2001. Fishbase. World Wide Web Electronic Publication. Hilton-Taylor C. 2000. 2000 IUCN Red List of Threatened Species. IUCN, Gland, Switzerland, xviii 1 61 pp. Humann P. and Deloach N. 1994. Reef Fish Identification. New World Publications, Jacksonville, Florida, 396 pp. ˜ ao conhecimento dos nomes vulgares dos peixes marinhos do Lima H.H. 1969. Primeira contribuiçao ˆ nordeste brasileiro. Boletim de Ciencias do Mar 21: 1–20. 1295 Mayland H.J. 1976. The Complete Home Aquarium. Perigee Books, New York, 223 pp. Menezes N.A. and Figueiredo J.L. 1985. Manual de peixes marinhos do sudeste do Brasil: Teleostei, v. 5, ˜ Paulo, Sao ˜ Paulo, 105 pp. n. 4. Museu de Zoologia, Universidade de Sao Menezes N.A. and Figueiredo J.L. 1980. Manual de peixes marinhos do sudeste do Brasil: Teleostei, v. 4, ˜ Paulo, Sao ˜ Paulo, 96 pp. n. 3. Museu de Zoologia, Universidade de Sao Migdalski E.C. and Fichter G.S. 1983. The Fresh and Salt Water Fishes of the World. Greenwich House, New York, 316 pp. Nottingham M.C., Cunha F.E.A. and Monteiro-Neto C. 2000. Captura de peixes ornamentais marinhos ˆ ´ Arquivos de Ciencias no Estado do Ceara. do Mar 33: 119–124. Prang G. 2001. Aviamento and the ornamental fishery of the Rio Negro, Brazil: implications for sustainable resource use. In: Chao L.N., Petry P., Prang G., Sonneschien L. and Tlusty M. (eds), Conservation and Management of Ornamental Fish Resources of the Rio Negro Basin, Amazonia, Brazil – Project Piaba. EDUA, Manaus, Brazil, pp. 43–73. Randall J. 1996. Caribbean Reef Fishes. TFH Publications, Neptune City, New Jersey, 368 pp. ´ Wood E. 2001. Collection of coral reef fish for aquaria: global trade, conservation issues and management strategies. Marine Conservation Society, Ross-on-Wye, UK, 80 pp.
Baixar