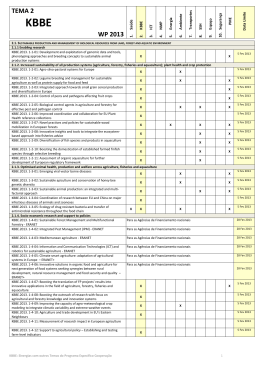
Marcelo Neri CPS/FGV
Higher Education (HE)
Key Questions
1. What are the Private and the Social
Returns of Higher Education (HE) in Brazil?
2. What is the potential role of HE related Immigration?
3. How these Questions are faced by Students and Firms?
4. How these Answers can Help Education Suppliers and
the Government (public policy aspects)?
1
Outline:
• Equality, Efficiency & Education Evolution
• Labor Market Premiums from Overall HE
•
•
•
•
Ranking Specific Undergraduate Careers Premiums
Attracting Talents - Immigration HE related Policies
Engineers, Doctors and Specific Public Policies
Management, Professional HE Courses & Demand
• Plus Doctors
• Science Without Borders
HE Access Policies (FIES, SISU)
HE Evaluation Systems
Returns from Education
Social Return
Private
Return
+ Growth
-Inequality
+ Social Welfare
+ Employability
+ Salary
Formality,
Hours etc
Externalities
How they are measured and perceived in practice?*
*For example, the choice between different university careers regarding salary or understanding the impact of a master’s
degree versus a pure bachelor’s degree
2
Changes in Income Distribution 2001 -2013
Cumulative Growth Rate of Per Capita Income by Vintiles 2001-2013(%)
113% 115% 112%
106% 104%
97%
100%
Total Income
94% 92%
87% 84%
82%
80%
Income of the 40% poorest
has grown 96% or 255% faster
than the 5% richest
73%
69%
63%
60%
Labor Income
Cumulative Growth (%)
120%
58%
52%
47%
39%
Education Bonus
40%
33%
27%
20%
0%
1
5%
2
3
4
5
6
7
8
9
10
11
12
13
14
15
16
17
18
40% Poorest
poorest
Vintiles of Household Income - per capita
19
20
5%
richest
Source: CPS/FGV processing microdata from PNAD/BGE
What is the ability of each Real spent, public or private, to reach a poor Student?
How much each course Cost? Ex: private H.E. courses cost per Brazilian more than
all other private courses
Education Inclusiveness Index
By Grade
Childcare
Pre-School
Alphabetization – adults
Elementary Education – regular
Elementary Education – regular public
Elementary Education – regular private
Adult Education – elementary education
Secondary Education – regular
Secondary Education – regular public
Secondary Education – regular private
Adult Education – secondary education
College Entrance Exam (Pré-Vestibular)
Tertiary Education
Tertiary Education – public
Tertiary Education – private
Graduate
Source: CPS/FGV processing microdata from PNAD
Same Weight to Each Poor – P1
1.08
1.46
1.73
1.53
+ Pro-Poor – P2
1.14
1.56
1.90
1.57
1.68
1.73
0.27
1.09
0.73
0.83
0.10
0.52
0.19
0.07
0.12
0.05
0.00
0.23
1.04
0.63
0.72
0.09
0.44
0.15
0.07
0.10
0.06
0.00
e POF 2003/IBGE
3
What are the Impacts of Education on Labor Market
Outcomes? Overall HE Premiums
in Relation to Illiterates*
Highest Level
Studied
Illiterates
Primary
Secondary
Undergraduate
Graduate
% Employed Hourly Wage
60.65
63.73
68.11
78.16
81.48
1.97
2.99
4.31
10.31
18.22
Probability of %Wage
Employment* Premium*
1
1.36
2.29
3.80
4.08
0
40.05
125.23
318.76
540.42
* controlled by gender, color or race, age, migration, city size, type of sector and State
Source: CPS/FGV based on PNAD 2005/IBGE microdata.
Education
Model With
Interaction
Returns from Higher Education
Change in Higher Education Premium (Diff in Diff)
6 Main Metro Areas
Source: CPS?FGV from PME/IBGE microdata; until February 2015; * at least incomplete level
4
Recent Bivariated Evolution
of Earnings
Jan-July 2014 to Jan-July 2015
6 Main Metro Areas
Source: CPS/FGV from PME/IBGE microdata , data until February 2015 * at least incomplete level
Time Variable
Returns from Education
6 Main Metro Areas
Isolating Macro Effects:
Cumullative Mean Income
Earnings Growth Over the Years
Comparing Similar Persons
Controlled: gender, age, color, metropolitan region, type of
city, number of people in the household, position in the
family, year and completed years of schooling.
Source: CPS/FGV from PME/IBGE microdata , data until February 2015 * at least incomplete level
Model Without Interaction
5
Bivariated Evolution of Earnings
By Productive Attributes
2003 to 2014
6 Main Metro Areas
Source: CPS/FGV from PME/IBGE microdata , data until February 2015 * at least incomplete level
Bivariated Evolution
of Productive Attributes
in Percentage Points
2003 to 2014
6 Main Metro Areas
Source: CPS/FGV from PME/IBGE microdata , data until February 2015 * at least incomplete level
6
0,32
2008
2013
2012
2011
0,44
0,41
0,39
0,37
0,31
2007
2009
0,3
0,25
2005
2006
0,26
0,22
2003
2004
0,21
2002
0,18
0,16
1999
2001
0,16
1998
0,14
1997
0,11
1995
0,14
0,11
1993
1996
0,11
1992
3,5
3,62
3,73
1997
1998
1999
2013
2012
2011
2009
2008
2007
2006
2005
2004
2003
2002
6,66
6,18
5,65
5,33
4,87
4,67
4,41
4,2
3,95
3,31
1996
2001
3,27
3,02
1993
1995
2,9
1992
8,29
7,77
7,39
Share with Completed Higher Education (%)
Soucre: CPS/FGV processing PNAD/IBGE microdata
Share with Graduates Completed (%)
Soucre: CPS/FGV processing PNAD/IBGE microdata
7
Higher Education Map 1
% with bachelor’s degree
within working age population (PIA)
by county
Bachelor’s
degree/ (PIA%)
Ens. Superior/PIA
0.24
4.14
8.03
11.9
15.8
19.7
23.6
27.5
- 4.14
- 8.0
- 11.9
- 15.8
- 19.7
- 23.6
- 27.5
- 31.4
Source: CPS/FGV processing microdata from Censo 2010/IBGE
Higher Education Ranking Among 5500 Municipalities
10 Highest % with bachelor’s degree (BD) within working age population (PIA) by county
Rank
1
2
3
4
5
6
7
8
9
10
UF
São Paulo
Rio de Janeiro
Espírito Santo
São Paulo
Santa Catarina
São Paulo
Paraná
Rio Grande do Sul
Santa Catarina
Distrito Federal
5565 Bahia
County
São Caetano do Sul
Niterói
Vitória
Águas de São Pedro
Florianópolis
Santos
Curitiba
Porto Alegre
Balneário Camboriú
Brasília
Canápolis
BD/PIA (%)
31,40
29,55
27,57
27,14
26,81
26,58
22,70
22,55
22,26
19,75
0,24
Source: CPS/FGV processing microdata from Censo 2010/IBGE
8
Bivariate Ranking of University Careers by Labor Market Outcomes
Working
Hours
Salary
R$
monthly Rank
Career
Social
Occupation Security
Rate
Coverage
Hr
Rate
Rate
week Rank (%) Rank (%) Rank
1
MEDICINE
6940
1
42
45
91,8
1
90,7 10
2
DENTISTRY
4238,65
8
37,46
12
89,96
3
78,63 43
3
CIVIL ENGINEERING
4604
3
41,7
43
90,1
2
4
MECHANICAL AND METALLURGICAL ENGINEERING
4258,69
7
40,96
32
89,17
5
90,53 11
5
MOBILITY SERVICES
4460,89
5
41,91
44
89,14
6
91,47
6
STATISTIC
5416,10
2
39,05
20
81,82 31 89,70 16
7
ELECTRICAL ENGINEERING AND AUTOMATION
3734,10
15
41,73
42
88,07
8
ENGINEERING (OTHERS)
4168,05
10
41,01
34
85,74 14 89,48 19
7
88
90,92
28
6
8
9
MILITARY AND DEFENCE SECTOR
4433,67
6
42,46
47
83,63 20 97,15
10
COMPUTING
2886,57
28
40,73
30
89,61
11
CHEMISTRY ENGINEERING
4549,12
4
41,53
40
83,39 22 91,07
12
ARCHITECTURE AND URBANISM
4206,01
9
39,78
24
86,84
9
74,31 47
13
SECURITY SERVICES
2785,47
32
41,41
38
87,23
8
94,57
14
LAW
4104,84
11
38,94
18
83,28 25 79,71 42
15
PHARMACY
2964,38
26
40,88
31
85,53 16 92,54
4
1
90,50 12
7
2
4
Source: CPS/FGV processing microdata from Censo 2010/IBGE
Multivariate Ranking of University Careers by Labor Market Outcomes
Working
Hours
Salary
Occupation
Rate
Social
Security
Coverage
Hr
Rate
Rate
R$ monthly Rank week Rank (%) Rank (%) Rank
1
MEDICINE
8459
1
41,9
41
97,1
1
2
3
DENTISTRY
MOBILITY SERVICES
5367,31
6053
7
3
38,24
38,9
14
17
96,22
93,6
2 83,23 43
14 93,3 6
4
CIVIL ENGINEERING
5768,19
5
42,12 44 95,72
3
90,7 28
5
6
7
8
9
10
11
12
13
14
15
MILITARY AND DEFENCE SECTOR
MECHANICAL AND METALLURGICAL ENGINEERING
ENGINEERING (OTHERS)
CHEMISTRY ENGINEERING
MATHEMATICS
STATISTIC
EDUCATION AND TEACHER TRAINING
ELECTRICAL ENGINEERING AND AUTOMATION
PHARMACY
LITERATURE, LANGUAGES AND CULTURES
ARCHITECTURE AND URBANISM
7695,84
5500,30
5242,91
5815,28
2811,40
4780,29
2420,73
4835,37
4067,68
2654,21
4744,30
2
6
8
4
40
10
46
9
17
44
11
41,91
42,89
40,74
41,91
38,00
40,43
36,36
41,47
42,65
37,08
40,36
44
6
19
31
5
21
8
17
7
12
4
97,13
92,93
92,11
92,57
93,15
92,57
92,32
92,69
93,72
92,02
78,12
39
48
29
40
12
26
4
35
47
6
25
90,63
94,36
93,11
92,58
94,39
93,08
94,13
93,37
94,30
93,66
94,69
93,4
5
1
8
14
10
7
11
13
9
4
15
47
Source: CPS/FGV processing microdata from Censo 2010/IBGE
9
Multivariate Ranking of University Careers by Labor Market Outcomes
Salary
34
35
36
37
38
39
40
41
42
43
44
45
46
47
48
JORNALISM
ECONOMICS
NURSING
BIOLOGY AND LIFE SCIENCES
ARTS
VETERINARY
PRODUCTION AND PROCESSING ENGINEERING
SOCIOLOGY AND POLITICAL SCIENCE
AGRONOMY, LIVESTOCK AND FISHING
OTHER SOCIAL SCIENCES
OTHER PERSONAL SERVICES (BEAUTY AND DOMESTIC)
TOURISM, TRAVEL AND LEISURE
PHYSICAL EDUCATION AND SPORTS
PHILOSOPHY AND ETHICS
RELIGION
R$
monthly Rank
3758,46 23
4301,66 15
3495,07 28
2848,95 39
3055,59 35
4314,48 14
3950,60 19
3638,39 24
3933,85 20
3099,39 32
2786,87 41
3043,14 36
2786,31 42
2340,35 47
2175,79 48
Working
Hours
Social
Occupation Security
Rate
Coverage
Hr
Rate
Rate
week Rank (%) Rank (%) Rank
39,23
19 92,58 30 85,87 38
41,08
31 92,06 36 89,92 30
41,27
33 92,56 32 91,73 17
38,20
13 92,12 35 90,35 29
36,82
5
92,52 33 81,56 45
41,44
34 92,86 24 81,70 44
42,51
46 92,22 34 90,95 26
38,93
18 91,21 42 88,93 31
41,95
43 91,92 39 85,20 40
37,68
10 90,35 45 88,66 32
40,00
23 92,85 25 71,59 48
41,25
32 90,70 43 87,18 34
38,75
15 89,74 47 86,24 37
37,33
7
89,17 48 86,97 35
39,43
21 89,94 46 78,89 46
Source: microdata from Censo 2010/IBGE
http://www.cps.fgv.br/cps/bd/censo/universidade.eng/index.htm
10
Direct and Indirect Impacts of HE Research
Research Provides a Service
(Public Quasi-Policy)
FGV
Student
New Data Dissemination
(Production of Indicators, Rankings, etc)
Public Policies
and New
Oportunities
Debate Promotion and
Informational Exchange
Government
Private Sector
Public Opinion
Educational
System
International
Organizations
11
Immigrants in Brazil and in the World
Brazil need 5 times more immigrants to reach South-America mean, 10 times
more immigrants to reach the World mean and 50 times more immigrants to
reach the North America and Oceania mean
Population
(by million)
Immigrants
(by million)
Percentage of
Immigrants
within
Population
World
6909
214
3,1
Africa
1033
19
1,9
Asia
4167
61
1,5
Europe
733
70
9,5
North America
352
50
14,2
South America
and Caribbean
Oceania
589
7
1,3
36
6
16,8
Brazil
196
0,6
0,3
Region
Source: United Nations, Department of Economic and Social Affairs, Population Division (2009) and PNAD (2009)
Besides the low mobility of people,
there is little mobility of knowledge
Mobility of students in 2010
Foreign students in the country or nationals studying abroad
Students (by 1000 inhabitants)
Almost 13 in each 1000 residents in
Australia are studying abroad or are foreign
people studying in the country
Austrália
New
Zelandia
In Chile, this number falls to 0.5 and in
Brazil to 0.2
Canadá
Portugal
Brasil
Countries Distribution
Source: Global Education Digest 2012 – Comparing Education Statistics Across The World (UNESCO) – Total of 60 países
12
Percentage of individuals favorable to
Immigration
by type
of Immigrants
Porcetagem de pessoas
favoráveis
a imigração, por tipo
Without
indocumentados
documents
refugiados
Refugee
concorrem
comwith
brasileiros
por vagas
Competing
Brazilians
for
jobs
baixa qualificação
profissional
Low professional
qualification
oriundos
países
pobres
From de
poor
country
From rich
country
oriundos
de países
ricos
To occupy positions which lack
professionals in Brazil
posições para as quais faltam profissionais brasileiros
High professional
alta qualificação
profissional
qualification
Doctors
Médicos
0%
10%
20%
30%
40%
50%
60%
70%
80%
90%
Brazilians are favorable to the coming of High Qualifies
Os
brasileiros são favoráveis à vinda de estrangeiros.
Immigrants
AMONG THOSE WHO CONSIDER THAT
THE
COMING
OF QUE
IMMIGRANTS
WITH
ENTRE
AQUELES
CONSIDERAM
HIGHQUE
PROFESSIONAL
IMIGRANTESQUALIFICATION
DE ALTA
CAUSES FAVORABLE
IMPACTS
IN THE
QUALIFICAÇÃO
CAUSAM
IMPACTOS
COUNTRY
FAVORÁVEIS
AO PAÍS,
66,9%
73,7%
SÃO FAVORÁVEIS
VINDA
FAVORABLE
TO THEÀCOMING
IMIGRANTESWITH
DE ALTA
OFDEIMMIGRANTS
HIGH
QUALIFICAÇÃO
PROFESSIONAL
PROFISSIONAL
QUALIFICATION
CONSIDER THAT THE COMING
CONSIDERAM QUE A
OF IMMIGRANTS WITH HIGH
VINDA DE IMIGRANTES
PROFESSIONAL
DEQUALIFICATION
ALTA QUALIFICAÇÃO
CAUSES
PROVOCA
IMPACTOS
FAVORABLE IMPACTS
IN THE
FAVORÁVEIS
AO PAÍS
COUNTRY
70,8%
ACREDITAM
A SUA
PRESENÇA
BELIEVE
THATQUE
THEIR
PRESENCE
RISES
AUMENTA
A PRODUTIVIDADE
DO
COUNTRY’S
PRODUCTIVITY AND
PAÍS
E
TRANSFERE
CONHECIMENTO
ENABLES KNOWLEDGE TRANSFERS TO
AO TRABALHADOR
BRASILEIRO
BRAZILIAN WORKERS
81,3%
84,2%
WOULD
RECEPTIVE TO
SERIAMBE
RECEPTIVOS
A
FOREIGNER WHO
UMA ESTRANGEIRO
QUE
MOVEDPARA
TO HISSUA
MUDASSE
NEIGHBORHOOD
COMUNIDADE
SERIAM
WOULD
BE RECEPTIVOS
RECEPTIVE TOAA
UM ESTRANGEIRO
QUE
FOREIGNER
WHO MOVED
TO
MUDASSE
PARA SUA
HIS OWN COMPANY
NOTA:Population
Populaçãowith
com16
16years
anos or
ou more
mais.
Note:
EMPRESA
Source:
FONTE: SAE/PR, com base em IPEA/SIPS-Imigração;
Brasil,SAE/PR
2013.
13
ABOUT IMMIGRANTS FOREIGNERS COMING TO BRAZIL
73,7%
74,3%
FAVORABLE TO THE COMING
OF IMMIGRANTS WITH HIGH
PROFESSIONAL
QUALIFICATION
OPPOSE THE COMING OF
IMMIGRANTS WITHOUT
DOCUMENTATION
Degree of Disagreement
0,4%
0,8%
0,5%
2,4%
100
75
50
25
0
0,2%
100
0,6%
3,0%
0,8%
75
50
25
0
Metropolitana
Metropolitan
Urbana
Urban
Rural
Rural
NOTE: Population with 16 years or more
Masculino
Male
Feminino
Female
Branco
White
Negro
Black
Elementary High
Elementary Fundamental
Fundamental
Médio
School
Complete
Incomplete
incompleto
completo
Higher
Educação
Education
superior
SOURCE: SAE/PR and IPEA/SIPS-Immigration; Brazil, 2013.
Specific Careers & Public Policies
14
Inhabitants per Doctor
zoom
Inhabitants/
Doctors
Habitantes por médico
49.21 - 567.48
567.488 - 1135.417
1135.417 - 5000
5000 - 20000
20000 - 50000
Sem informação
Source: CPS/FGV
15
Inhabitants per Doctor
zoom
Habitantes
por médico
Inhabitants/
Doctors
49.21 - 567.48
567.488 - 1135.417
1135.417 - 5000
5000 - 20000
20000 - 50000
sem médicos
Source: CPS/FGV processing microdata from Censo 2000/IBGE
Inhabitants per Doctor
zoom
Inhabitants/
Doctors
Habitantes por médico
49.21 - 567.48
567.488 - 1135.417
1135.417 - 5000
5000 - 20000
20000 - 50000
sem médicos
Source: CPS/FGV processing microdata from Censo 2000/IBGE
16
Inhabitants per Doctor
zoom
Inhabitants/
Doctors
Habitantes por Médico
49.212 - 567.48
567.48 - 1135.417
1135.417 - 5000
5000 - 20000
20000 - 50000
sem médicos
Source: CPS/FGV processing microdata from Censo 2000/IBGE
Number of inhabitants* by Doctors
*within working age population
by Unit of Federation (UF)
Habitantes/Médicos
Inhabitants/
Doctors
370 - 670
670 - 970
970 - 1270
1270 - 1570
1570 - 2335
Source: microdata from Censo 2010/IBGE
17
Number of inhabitants* by Engineers
*within working age population
by Unit of Federation (UF)
Inhabitants/
Doctors
Habitantes/Engenheiros
Inhabitants/ Engineers
140 - 355
355 - 570
570 - 785
785 - 1000
1000 - 1266
Source: CPS/FGV processingmicrodata from Censo 2010/IBGE
THE KEY: DIFFERENCES IN ABILITY TO
ADOPT AND ADAPT NEW TECHNOLOGIES
Inferences across Latin American Countries provinces (does not include Brazil) suggests that a doubling
the density of engieneers is associated with a 60% rise in GDP (similar result across U.S. States)
Engineering Density 1900
Source: Maloney and Valencia, 2015
18
SAME BUSINESS AND INSTITUTIONAL
CLIMATE, DIFFERENT ENTREPRENEURIAL
OUTCOMES
Source: Maloney, 2015
LAC AND BRAZIL: WEAK MANAGEMENT SKILLS
Source: World Management Survey(2015)
19
11
Share of Courses Higher Education %
10
4,5
4
9
3,5
8
3
7
2,5
6
2
5
1,5
4
1
fev/03
mai/03
ago/03
nov/03
fev/04
mai/04
ago/04
nov/04
fev/05
mai/05
ago/05
nov/05
fev/06
mai/06
ago/06
nov/06
fev/07
mai/07
ago/07
nov/07
fev/08
mai/08
ago/08
nov/08
fev/09
mai/09
ago/09
nov/09
fev/10
mai/10
ago/10
nov/10
fev/11
mai/11
ago/11
nov/11
fev/12
mai/12
ago/12
nov/12
fev/13
mai/13
ago/13
nov/13
fev/14
mai/14
ago/14
nov/14
fev/15
mai/15
26
fev/03
mai/03
ago/03
nov/03
fev/04
mai/04
ago/04
nov/04
fev/05
mai/05
ago/05
nov/05
fev/06
mai/06
ago/06
nov/06
fev/07
mai/07
ago/07
nov/07
fev/08
mai/08
ago/08
nov/08
fev/09
mai/09
ago/09
nov/09
fev/10
mai/10
ago/10
nov/10
fev/11
mai/11
ago/11
nov/11
fev/12
mai/12
ago/12
nov/12
fev/13
mai/13
ago/13
nov/13
fev/14
mai/14
ago/14
nov/14
fev/15
mai/15
(Self-Perception – Reality) Gap
FIRMS DON’T KNOW
WHAT THEY
DON’T KNOW
Source: Maloney, 2015
Technical Course – Higher Education (%)
28
24
Attends or attended Course Any Level
22
20
18
16
14
12
10
Share of Courses Higher Education %
(Undergraduate Completed Requirement)
Soucre: CPS/FGV from PME/IBGE microdata
20
What is the Private Premium from HE Courses
Attributes?
1. Level of the Course
2. Thematic Areas of the Courses
Technological
Medicine
UnderGraduate
Engineering
……….
Graduate
Maths, etc.
3. Relation with Earlier Regular
Education: RE-Education
7. HE Meets the Labour Markets
(Diploma-Effect etc)
4. Private, Public & Non Profit
Supply
5. Daytime or Evening Courses
8. Evaluation of Public Policies
Impacts
6. Classroom Courses or On Line
Source: CPS/FGV
It is Necessary to Understand Supply and
Demand for Higher Education
Estimate Models & Hear Different Actors Motivations
Yes
Attended?
HE Technical &
the Labor
Market
No
Yes
Work in the Area of the
Course?
Concluded?
No
No
Why not?
Frequentou?
Não
Sim
Concluiu?
Não
Por Que Não?
21
Professional
Course
Higher Education Range*
Did not Attend
(62,2%)
Attended (37,4%)
Concluded
(94,5%)
Work in
the Area of
the Course
79,5%
“10% Law”
Among the
Rest – Had
Better
Working
Oportunities
50,8%
Lack of
Supply
5,4%
Not
Intereste
d 86,4%
Lack of
Resources
4,2%
Others
26%
Did not
Conclude (5,5%)
Other
Lack of Lack of 26%
Supply Demand
66,1%
8%
Others Disatisfaction 30%
Source: CPS/FGV processingmicrodata from PNAD 2007/IBGE
Map of Public Available Databases Used
Household Surveys Microdata
PNAD (100,000 housedholds per year)
Annual Cross-section (1976 -2012); IBGE
Incomes, Residential Capital
POF (48,000 families per year) 1974; 2002;
2008 ; Details: Incomes, Spending and Taxes
Mapping
CENSUS (18 million individuals) 1960 - 2010
IBGE, Long Run Income and Detailed Maps
Monitoring
PME (36 thousand dwellings month) 19802014, IBGE Monthly Labor with a two month
lag, 6 Metrocities, Longitudinal Aspect
Administrative Records
National Accounts IBGE (Hybrid)
PIT Personal Income Tax -IRPF
25 million individuals; 2007 -2012
Top Incomes and Assets
Unified Register for Social Programs – MDS
CadÚnico (60 million individuals) Bottom
Incomes & Household Characteristics
Subjective Surveys National*
PPPP (3800 Interviews. 215 cities), Ipea
Population Perceptions on Public Policies,
Well-Being; Individuals 15 years or older
Subjective Surveys International*
Gallup World Poll (more than 150 countries &
200.000 yearly interviews) 2006 to 2014
Subjective and Objective Data, Individuals 15
years or older
22
Thanks!
23
Download