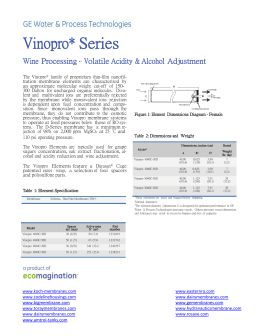
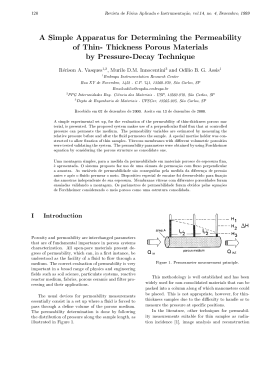
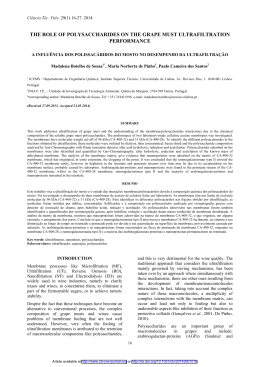
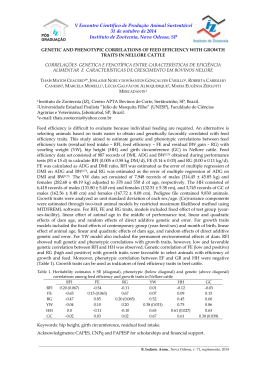
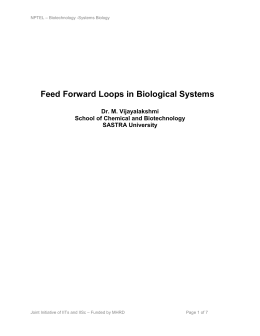
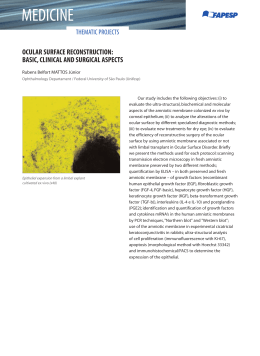
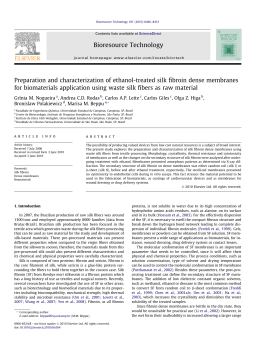
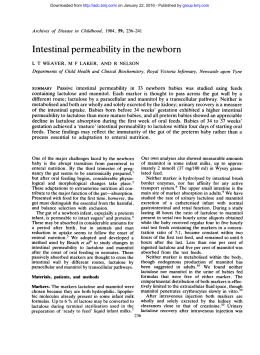
Open Access Article. Published on 04 February 2014. Downloaded on 15/02/2014 14:29:53. This article is licensed under a Creative Commons Attribution-NonCommercial 3.0 Unported Licence. Energy & Environmental Science View Article Online PAPER View Journal Quantifying the potential of ultra-permeable membranes for water desalination† Cite this: DOI: 10.1039/c3ee43221a David Cohen-Tanugi,a Ronan K. McGovern,b Shreya H. Dave,b John H. Lienhardb and Jeffrey C. Grossman*a In the face of growing water scarcity, it is critical to understand the potential of saltwater desalination as a long-term water supply option. Recent studies have highlighted the promise of new membrane materials that could desalinate water while exhibiting far greater permeability than conventional reverse osmosis (RO) membranes, but the question remains whether higher permeability can translate into significant reductions in the cost of desalinating water. Here, we address a critical question by evaluating the potential of such ultra-permeable membranes (UPMs) to improve the performance and cost of RO. By modeling the mass transport inside RO pressure vessels, we quantify how much a tripling in the water Received 26th September 2013 Accepted 16th January 2014 permeability of a membrane would reduce the energy consumption or the number of required pressure vessels for a given RO plant. We find that a tripling in permeability would allow for 44% fewer pressure vessels or 15% less energy for a seawater RO plant with a given capacity and recovery ratio. Moreover, a tripling in permeability would result in 63% fewer pressure vessels or 46% less energy for brackish water DOI: 10.1039/c3ee43221a RO. However, we also find that the energy savings of UPMs exhibit a law of diminishing returns due to www.rsc.org/ees thermodynamics and concentration polarization at the membrane surface. Broader context The development of affordable, reliable and energy-efficient technologies for converting saltwater into fresh water is one of the most important research goals of this century. Yet the best technology available today, reverse osmosis (RO), remains costly. Recent advances in materials research suggest that new membranes could reject salt while permeating water much faster than nonporous RO membranes. However, considerable confusion exists regarding the likelihood that future RO systems will continue to become smaller, more productive or more energy-efficient. Given the critical importance of water technology research for human development goals, it is essential to carefully evaluate what future RO systems can and cannot achieve on the basis of more permeable membranes. Beginning with fundamental transport equations and extending to applied engineering scenarios, we demonstrate that membranes with 3x higher permeability could reduce the energy consumption of RO by 15-46% for seawater and brackish water respectively, or alternatively reduce the number of pressure vessels by 4463%. Given many recent advances in the design of RO membranes, this work highlights the likely development of a new generation of desalination plants with higher throughput and a smaller spatial footprint than what is achievable today. 1 Introduction Fresh water is becoming an increasingly scarce global resource, and its availability is expected to inuence the long-term wealth and wellbeing of nations.1 Desalination provides the attractive possibility of expanding the natural hydrological cycle by supplementing it with water from oceans and brackish reservoirs. RO technology has improved dramatically since the 1950s:2 the most efficient desalination process, reverse osmosis (RO), now requires 2.6 kWh per cubic meter of fresh water compared with 8 kWh in 1980.3,4 However, desalination still a Department of Materials Science & Engineering, Massachusetts Institute of Technology, Cambridge MA 02139, USA. E-mail: [email protected] comes at a high capital and energy cost.5 In particular, RO plants remain expensive to build and oen occupy large areas in coastal zones where available land is increasingly limited (see Fig. 1). Fortunately, advances in RO technology have steadily reduced the cost of desalinated water in past decades.6 However, considerable confusion exists regarding the likelihood that future RO systems will continue to become smaller, faster or more energy-efficient. Given the critical importance of water technology research for human development goals, it is crucial to carefully evaluate what future RO systems can and cannot achieve on the basis of more permeable membranes. 2 Motivation and research question b Department of Mechanical Engineering, Massachusetts Institute of Technology, Cambridge MA 02139, USA. E-mail: [email protected] † Electronic supplementary information (ESI) available: Details regarding RO dynamics and methods employed in this work. See DOI: 10.1039/c3ee43221a This journal is © The Royal Society of Chemistry 2014 The orders-of-magnitude increase in permeability that UPMs could potentially enable require an in-depth assessment of the physical mechanisms that occur at the membrane's surface. Energy Environ. Sci. View Article Online Energy & Environmental Science Paper Open Access Article. Published on 04 February 2014. Downloaded on 15/02/2014 14:29:53. This article is licensed under a Creative Commons Attribution-NonCommercial 3.0 Unported Licence. 2.1 Fig. 1 Hadera RO Desalination Plant, Israel, 127 million m3 year1. The Hadera seawater desalination plant in Israel, among the worlds most efficient, contains tens of thousands of RO membrane cartridges. Courtesy of IDE Technologies Ltd. The thin-lm composite (TFC) membranes employed in RO today achieve very high salt rejection (>99%), but at the expense of a low water permeability (1 L (m2 h bar)1, compared with 300 L (m2 h bar)1 for ultraltration membranes).7,8 Trends in materials research indicate that future RO membranes will likely exhibit substantially higher intrinsic permeability to water than TFCs. For example, it has been shown that graphene is experimentally capable of separating salts from water,9 and simulations suggest that the permeability of nanoporous graphene could exceed that of TFCs by 2–3 orders of magnitude.10 Other research efforts have highlighted the potential of incorporating zeolites, graphene, carbon nanotubes11,12 or bioinspired aquaporins into membranes.2,13–15 However, it is known that concentration polarization – namely, the accumulation of salt near the membrane surface and the resulting decrease in water ux – will prevent UPMs from performing signicantly better than conventional membranes.16–18 Prior work has largely focused on the energy consumption of RO and mostly neglected other ways in which RO systems could produce cheaper water, e.g. reduced system size. Seawater RO plants today can contain >10 000 membrane elements, with capital costs ranging in the hundreds of millions of US dollars and approximately 20% of the capital cost attributable directly to pressure vessels and the associated membranes and piping.19 Studies have also examined the specic engineering aspects of RO modules – including spacer design and interelement connectors20 – but the direct effects of increasing membrane permeability have largely been overlooked in the literature. Thus, this paper addresses the following question: would a tripling of water permeability over current membrane technology allow for a signicant improvement in the performance of RO? More specically, for an RO plant of a given capacity and recovery ratio, how much could UPMs reduce the energy consumption or the number of pressure vessels required to produce the plant's total output, as illustrated in Fig. 2? In the remaining Sections, we answer these questions and demonstrate that energy consumption, far from scaling linearly with membrane permeability, is limited by thermodynamics, while the number of pressure vessels could be reduced more signicantly than had been appreciated previously. Energy Environ. Sci. Methodological approach In order to evaluate how membrane permeability affects the energy consumption and number of pressure vessels in an RO plant, we model the mass transport and uid dynamics of an RO system. Unless mentioned otherwise, we use the term UPMs to refer to membranes whose permeability would be at least three times greater than their TFC counterparts with equivalent salt rejection performance. A factor of three increase is representative of the permeability improvement of RO membranes in the past several decades20 and represents a useful measure of how RO systems would perform given enhanced permeability. Moreover, in order to quantify the effects of feed water concentration, we consider two different saline water sources: seawater (42 000 ppm) and brackish water (2 000 ppm). Because conventional seawater RO (SWRO) plants operate differently from conventional brackish water (BWRO) plants, we examine the benets from UPMs relative to typical operational conditions for both feed waters achievable today with TFC membranes. The reference conditions for each feed water type are summarized in Table 1. In RO, feed water enters pressure vessels containing several cylindrical spiral-wound membrane elements connected in series. The feed water travels parallel to the membrane surface, and water molecules selectively permeate radially across the membrane while most undesired substances remain in the feed channel. For conventional RO systems and new membrane classes alike, empirical studies and molecular dynamics simulations have shown that the local permeate ux J (units: L h1) obeys:10,14,15,23 J ¼ P pf eJ=k pp $Am (1) where pf and pp are the osmotic pressures of the bulk feed and permeate respectively (units: bar), k is the mass transfer coefcient (in m s1)24–26 and Am is the membrane’s water permeability (units: L (m2 h bar)1). The factor of exp(J/k) is due to concentration polarization, as the salt concentration at the membrane surface exceeds that of the bulk due to the balance between salt transport towards and away from the membrane. Due to this boundary layer, a membrane with three-fold greater water permeability will not produce three times more permeate under the same ow conditions. The extent of these diminishing returns depends on the value of k, which increases with higher cross-ow velocities and greater uid mixing inside the channel. The feed was modeled as a pure solution of NaCl in water, and following Hoek et al. we calculate osmotic pressure using van't Hoff's law.27 We note that the ux described by eqn (1) is a local quantity that depends on the distance z along the RO module. As the feed salinity increases in the streamwise direction as water is removed through the membrane, the net driving pressure and the local permeate ux both decline. In order for the permeate ux to remain positive throughout the RO vessel, the feed pressure must be greater than the osmotic pressure difference at any streamwise position. The prole of local permeate ux, feed owrate, feed pressure and bulk salinity (J(z), Q(z), P(z), cb(z)) over the length of the RO vessel are This journal is © The Royal Society of Chemistry 2014 View Article Online Open Access Article. Published on 04 February 2014. Downloaded on 15/02/2014 14:29:53. This article is licensed under a Creative Commons Attribution-NonCommercial 3.0 Unported Licence. Paper Energy & Environmental Science Fig. 2 (a) Schematic representation of cross-flow RO. (b) Comparison of RO performance with low-flux (baseline) membranes and ultrapermeable membranes (UPMs). Relative to today's baseline, this paper examines to what extent UPMs could produce more permeate per RO vessel (resulting in fewer pressure vessels per plant) or operate at lower inlet pressures (resulting in lower energy consumption). The figure schematically illustrates these potential scenarios and does not indicate specific results presented later in this work. Table 1 Reference conditions for seawater and brackish water used in this work Reference parameter SWRO BWRO Feed salinity (ppm) Inlet pressure (bar) Membrane elements per vessel Feed owrate per vessel (m3 day1) Permeate recovery Water permeability (L (m2 h bar)1) Source: 42 000 70 8 300 42% 1.0 Dow Water21 2 000 12 (First stage) 7 140 65% (First stage) 1.5 Sessions et al.22 governed by the differential equations for local permeate ux, conservation of water, conservation of salt, and pressure loss as well as the inlet conditions. 8 Wc > > F0 ðzÞ ¼ JðPðzÞ; QðzÞ; cb ðzÞÞ > > > Q in > < QðzÞ ¼ Qin ð1 FðzÞÞ (2) > > > > c0 dP > > ¼ P0 lost ðzÞ : cb ðzÞ ¼ 1 FðzÞ dz where Wc FðzÞ ¼ Qin ðz z J z~ d~ 0 where the recovery ratio RR is dened as the ratio of permeate produced (Qout) to the owrate of feed into the RO vessel (Qin). The energy consumption per m3 of permeate arises both from a minimum dictated by thermodynamics and from entropy generated throughout the RO process29 and is calculated as: E¼ (3) 0 is the owrate of water that has permeated ahead of position z and Wc is the effective width of the membrane, and all other symbols are in Table 2. The salt conservation equation makes use of the fact that the salinity in the permeate is negligible This journal is © The Royal Society of Chemistry 2014 relative to the feed. The governing equations are supplemented with the appropriate initial conditions. The recovery ratio then equals RR ¼ F(L), where L is the length of the pressure vessel. The system of governing differential equations was solved using numerical integration using the NDSolve method in Mathematica 9.0 and the pressure loss was calculated using the implicit pressure drop equation (see ESI†). Systems-level quantities were calculated by considering the typical RO process diagram shown in Fig. 3. SWRO systems employ isobaric pressure recovery devices (PRDs) to pressurize the feed using mechanical energy salvaged from the brine (Fig. 3a), while BWRO typically do not28 (Fig. 3b). The total permeate production per vessel is calculated as ðL (4) Qout ¼ Wc JðzÞdz 1 Pin zð1 RRÞðPin Plost Þ h RR (5) where z is the efficiency of the PRD and is taken to equal 97% for SWRO (or 0% for BWRO since PRDs are not used). The rst term corresponds to the energy required to pressurize the feed water to the inlet pressure, and the second term corresponds to the energy recovered from the brine whose pressure equals Energy Environ. Sci. View Article Online Energy & Environmental Science Open Access Article. Published on 04 February 2014. Downloaded on 15/02/2014 14:29:53. This article is licensed under a Creative Commons Attribution-NonCommercial 3.0 Unported Licence. Table 2 Paper List of key variables and symbols Symbol Quantity Units Am Qin Qout RR Pin Plost E Water permeability Feed owrate Permeate owrate Recovery ratio Inlet pressure Pressure loss across RO vessel Specic power consumption per unit of permeate Permeate ux at position z Mass transfer coefficient Pressure vessel length Bulk salinity at position z Salt rejection Temperature Universal gas constant Pressure recovery efficiency Pump efficiency L (m2 h bar)1 m3 day1 m3 day1 % bar bar kWh m3 J k L cb R0 T R x h m s1 m s1 m mol L1 % K J (K mol)1 % % Key RO parameters and relationship between the two improvement scenarios considered in this work. In each scenario, the fixed parameters are held at the baseline value specified in Table 1 Table 3 Scenario Pin Qout RR L #1 #2 f(Am) Fixed Fixed f(Am) Fixed Fixed Fixed Fixed The methodology described above is summarized schematically in Fig. 4. Using this methodology, we calculate how inlet pressure and number of RO vessels would evolve as a function of membrane permeability while all other parameters are held xed at the reference values typical of each feed water concentration today. Since RO pressure vessels operate in parallel, the number of required pressure vessels for a given total capacity scales inversely with Qout. The variable and xed parameters for each case are summarized in Table 3. 3 Results 3.1 Seawater RO We rst consider the impact of UPMs on energy consumption in SWRO. Consistent with prior work, we nd that the opportunity for lower energy consumption in SWRO is limited by thermodynamics.16–18 Lower energy consumption (for a given recovery ratio, membrane area and feed owrate) would be obtained by reducing the inlet pressure, and the achievable pressure reduction as a function of membrane permeability is shown in Fig. 5a. The feed inlet pressure for SWRO (purple line) declines asymptotically to the outlet brine osmotic pressure. This limit28 corresponds to the osmotic pressure of the brine, and it represents a fundamental constraint on the energy efficiency of desalination that is entirely independent of membrane performance. Fig. 5a shows that tripling Am from 1 to 3 L (m2 h bar)1 would reduce the inlet pressure from 70 bar to 63 bar. This 10% reduction in inlet pressure translates to a 15% reduction in specic energy consumption. However, the gure also shows that any further improvements in membrane permeability beyond 3 L (m2 h bar)1 would have essentially no effect on energy consumption, since 63 bar is already within 1% of the osmotic limit for SWRO at the chosen recovery ratio. Process diagram for RO with (a) and without (b) pressure recovery, representative of SWRO and BWRO respectively. Pre-treated feed water enters on the left, and desalinated water leaves the RO stage on the right for further polishing and post-treatment. Adapted from Wikimedia Commons and available at http://bit.ly/YIG6fo. Fig. 3 Schematic diagram of the methodology employed in this work. The feed flowrate, inlet pressure, feed concentration and membrane permeability are treated as inputs. Using these inputs and making use of the implicit expressions for permeate flux and pressure drop, we numerically solve the coupled differential equations for conservation of water, conservation of salt, permeate recovery and inlet pressure. The resulting quantities are the recovery ratio and the outlet pressure, from which the permeate production and energy consumption can be directly calculated. Fig. 4 (Pin Plost) aer accounting for viscous losses. We assume that the high-pressure pump and the circulation pump have the same efficiency h. Salt and water leakage effects across the PRD interface are neglected. Additional details about how the plots were generated can be found in the ESI.† Further descriptions of the RO process can also be found in the literature.2,30,31 Energy Environ. Sci. This journal is © The Royal Society of Chemistry 2014 View Article Online Open Access Article. Published on 04 February 2014. Downloaded on 15/02/2014 14:29:53. This article is licensed under a Creative Commons Attribution-NonCommercial 3.0 Unported Licence. Paper We now turn to the effect of permeability on the equipment requirements for SWRO. In this case, the increase in Am serves to increase the permeate ux, while the higher feed velocity mitigates the effect of concentration polarization since the mass transfer coefficient increases monotonically with uid velocity. We have plotted the total number of pressure vessels needed for a 100 000 m3 day1 RO plant as a function of the permeability of the membranes in Fig. 5. Fig. 5b indicates that tripling Am would allow SWRO plants to produce the same total output (at the same inlet pressure and recovery ratio) with 55% fewer pressure vessels. However, more energy is dissipated by viscous losses at high feed velocity, so the specic energy consumption would also increase by 6% at this higher throughput. Alternatively, by operating at lower pressure instead, SWRO plants could maintain the same energy consumption while reducing the number of pressure vessels by 44% (not shown in gure). 3.2 Brackish water RO We now turn to the potential operational impacts of UPMs on BWRO. Fig. 5 reveals a result that is largely unaddressed in the Energy & Environmental Science literature, namely that inlet pressure leaves much more room for reduction in the case of BWRO compared with SWRO. Fig. 5a indicates that the inlet pressure required to achieve 65% recovery in BWRO rapidly drops for increasing Am. Because the osmotic limit for BWRO is only a fraction of that of SWRO, a tripling in membrane permeability would achieve a much greater reduction in inlet pressure, namely down to 6.4 bar from 12 bar in the case of TFC membranes (a 46% reduction in pressure and energy consumption). For even more permeable membranes, the pressure essentially reaches the asymptotic limit when Am > 5 L (m2 h bar)1. Thus, UPMs could nearly halve the energy consumption of the RO stage for brackish water. The reduction in the number of pressure vessels is also greater for BWRO than for SWRO. Fig. 5b indicates that tripling Am would allow for 63% fewer pressure vessels for a given plant capacity by increasing the feed owrate per vessel from 139 m3 day1 to 378 m3 day1. Furthermore, the increase in feed owrate involves approximately no energy penalty, since viscous losses represent a negligible component of the overall energy consumption in a BWRO system. 3.3 Improvements in key performance criteria as a function of membrane permeability for SWRO at 42 000 ppm NaCl (purple) and BWRO at 2 000 ppm NaCl (orange). (a) Minimum required inlet pressure (solid lines) and energy consumption (dashed) as a function of membrane permeability at fixed recovery and feed flowrate. The curves decrease asymptotically from the baseline conditions (colored circles) to a minimum dictated by the osmotic pressure of the feed water. For BWRO, pressure and energy consumption are linearly related, so the two curves are superimposed. (b) Number of pressure vessels required as a function of membrane permeability for a total capacity of 100 000 m3 day1 at fixed recovery ratio and pressure. Membrane width is held fixed in both subplots. Fig. 5 This journal is © The Royal Society of Chemistry 2014 Concentration polarization The effect of concentration polarization is to impede the ux across the membrane (our model accounts for this effect) and to increase the likelihood of membrane scaling (which our model does not account for). Scaling has been observed to occur when the concentration polarization factor (CPF), or ratio of membrane surface salinity to bulk salinity, exceeds 1.20 for SWRO.32 The detailed effects of scaling and fouling are beyond the scope of this paper but are relevant to the design constraints of an RO plant. We have computed the CPF for each scenario investigated as a function of z in Fig. 6. We also report the maximum CPF for each system in the ESI.† Fig. 6 shows that the maximum CPF is higher with UPMs than with TFC membranes, which is consistent with the fact that the former allow for higher transmembrane ux. The CPF begins with high values in the front of the RO vessel, where the permeate ux is highest, and decays to unity towards the end of the vessel. In the reference case, corresponding to conventional TFC membrane operation, the CPF prole is comparatively at in all three scenarios since the permeate ux is relatively modest. In contrast, the UPM system (with Pin, RR and L xed and a larger value of Qin) exhibits greater CP at the front of the vessel (consistent with higher membrane permeability) but decays more steeply to unity along the vessel length. In the SWRO scenario, the CPF in the second half of the vessel is actually lower than in the reference case. Despite the marginally higher CPF values for UPMs, the CPF remains below 1.20 in all three scenarios. 4 Implications The preceding sections quantied the extent to which UPMs would reduce the energy and pressure vessel requirements for SWRO and BWRO by operating at lower pressure or higher owrate. However, each improvement (e.g. reducing Pin) was Energy Environ. Sci. View Article Online Open Access Article. Published on 04 February 2014. Downloaded on 15/02/2014 14:29:53. This article is licensed under a Creative Commons Attribution-NonCommercial 3.0 Unported Licence. Energy & Environmental Science Fig. 6 Concentration polarization factor (CPF) as a function of distance down RO vessel for SWRO and BWRO in the low-permeability reference case and in the UPM scenarios at 3 higher permeability examined in this work. For a tripling in membrane permeability (dashed lines) compared with TFCs (solid lines), the maximum CPF remains below 1.20. calculated by holding other quantities xed (e.g. RR and Qin). Since the various improvements described above cannot be attained simultaneously, the advent of UPMs would require new and existing RO plants to reach a compromise between energy and pressure vessel savings. Fig. 7 represents graphically the tradeoff between the energy and pressure vessel savings from UPMs. Energy consumption and permeate production per vessel are represented on independent axes for a xed recovery ratio and membrane area. For each scenario, the operating regimes achievable using UPMs (dashed lines) can be compared with those achievable with TFC membranes (solid lines). The gure indicates RO plants could adopt any combination of energy savings (up to 15% for SWRO and 46% for BWRO) and pressure vessel savings (up to 44% for SWRO and 63% for BWRO) along the dashed line, with the energy savings becoming smaller for a greater reduction in the number of pressure vessels. We have shown that the impacts of UPMs depend heavily on the feed water type as well as which parameter (pressure or owrate) is being optimized. We now briey turn to the potential implications of these operational impacts in order to Fig. 7 Specific energy consumption of RO vs. permeate production per vessel, for conventional TFC (solid) and UPMs at 3 greater permeability (dashed). Circles depict the baseline case, and the arrows indicate how each RO system could operate given the availability of UPMs. Feed flowrate is held fixed while pressure increases as a function of permeate production. Energy Environ. Sci. Paper evaluate our original hypothesis, i.e. that a tripling in membrane permeability would result in signicant gains for RO. The potential implications of lower pressure operation or greater permeate production can be estimated with reasonable condence. We emphasized above that the energy savings from UPMs in SWRO would be limited to about 15%. In practice, this limitation is due to the fact that current SWRO plants operate near the lowest allowable pressure at the expense of low permeate production per vessel. SWRO plants are optimized to operate in this manner because the minimum pressure required to extract permeate water from seawater is already quite high (60–70 bar) owing to the high salinity of seawater. Since pre- and post-treatment account for another 1 kWh m3, a 15% reduction in the energy consumption of the RO stage would only result in a 10% reduction in the total energy cost of SWRO. Although a 10% savings may seem limited, it may still represent an important improvement given the high energy footprint of SWRO. Assuming an electricity price of 0.10 $ per kWh, reducing the total energy consumption of SWRO from 3.8 kWh to 3.5 kWh would result in a cost savings of about 0.03 $ per m3. When it comes to capital costs, our analysis allows us to posit certain qualitative trends. According to Global Water Intelligence, the levelized capital cost for a typical 150 000 m3 day1 SWRO plant today is about 0.20 $ per m3 (excluding land), and 20% of this cost is due to membranes, pressure vessels and piping.33 Thus, if UPMs were to cost the same per unit area as current membranes and if they were to reduce the number of required pressure vessels by 44% thanks to a tripling in water permeability, the membranes would save on the order of 0.02 $ per m3 in capital costs. For this estimate, we assume that the portion of capital costs due to membranes, pressure vessels and piping scales linearly with the number of pressure vessels and that the remainder of the capital cost (including intake, pretreatment, pumps, etc.) is unaffected by the number of pressure vessels. As a fraction of the overall cost of SWRO, the energy or pressure vessel savings are relatively small: they would only reduce the overall cost of SWRO by about 3–4%. Returning to our starting hypothesis, this implies that a tripling in membrane permeability would result in signicant performance improvements at the RO stage but with cost savings that only range in the single digits for SWRO. Applications of SWRO that are space-constrained (e.g., ship-board systems) might also nd a 44% reduction in pressure vessels attractive from the perspective of a reduced physical footprint. The benets are more signicant for BWRO. We found that BWRO systems would see a 46% reduction in energy consumption using UPMs. This is because the energy consumption in existing BWRO plants is typically much greater today than would be strictly required by thermodynamics since economics favor maximizing recovery and minimizing plant size at the expense of suboptimal energy consumption.34 Thus, UPMs could reduce the energy footprint of BWRO while keeping capital costs and permeate recovery unchanged. Moreover, we also found that BWRO plants using UPMs could alternatively benet from 63% fewer pressure vessels for a given plant This journal is © The Royal Society of Chemistry 2014 View Article Online Open Access Article. Published on 04 February 2014. Downloaded on 15/02/2014 14:29:53. This article is licensed under a Creative Commons Attribution-NonCommercial 3.0 Unported Licence. Paper capacity, which would allow for more compact plants with identical pretreatment, posttreatment, pumps and ancillary processes but with proportionally smaller capital expenses for pressure vessels, membranes and piping. Given the same assumptions as in the SWRO case above,35 BWRO plants with lower inlet pressure and BWRO plants with fewer vessels would both save around 0.03 $ per m3 (9% of costs). Thus, UPMs are projected to have a greater impact on the cost of BWRO than of SWRO. We note that throughout this paper, we kept the membrane's salt rejection xed at 99.8% in order to properly investigate the effect of water permeability in isolation from the separate issue of salt rejection performance and fouling potential. We restricted the scope of this paper to steady-state desalination without time-dependent effects such as gradual fouling or mineral scaling on the membrane surface, because fouling resistance represents a qualitatively different axis for membrane improvement than high permeability. 5 Conclusion We have shown that the development of ultra-permeable membranes could help to reduce the energy consumption and the pressure vessel requirements of RO desalination. However, the benets of UPMs for reducing energy consumption are limited to 15% in the case of SWRO. We also showed that membranes with 3 higher permeability could in principle reduce the number of pressure vessels by 44% for seawater RO plants and 63% in brackish water RO plants without affecting energy consumption or permeate recovery. Such membranes could also reduce the energy consumption of SWRO and BWRO by 15% and 46% respectively at the same permeate production per vessel as is typical today. For even greater permeabilities beyond 3–4.5 L (m2 h bar)1, the incremental energy savings become negligible but capital requirements could continue to decrease thanks to fewer pressure vessels. Despite concerns expressed in the literature, we nd that concentration polarization does not nullify the benets of UPMs, although it does mitigate them relative to what would be expected in the absence of CP. As membrane permeability increases, so too will typical cross-ow velocities and mass transfer coefficients, and permeate ux will increase monotonically – although less than linearly – with membrane permeability. Although novel system designs may be required to fully take advantage of greatly increased feed owrates, our results suggest that advances in membrane science will continue to make desalination increasingly competitive as an option for fresh water supply in coming decades. Acknowledgements We thank Rick Stover, Erik Nottleson, Eric Lam, IDE Technologies and Dianne Wiley for discussions, Felice Frankel for sharing visual communication insights and Jason Hill for helping with graphic design. Funding for this work came from the NSF Graduate Research Fellowship Program, the MIT Energy Initiative Seed Grant Program, the Fulbright This journal is © The Royal Society of Chemistry 2014 Energy & Environmental Science International Science and Technology Award Program, the International Desalination Association, the Channabasappa Memorial Scholarship, the MIT Martin Family Sustainability Fellowship Program and a generous gi by the Douglas C. Spreng Fund. References 1 F. Devoto, E. Duo, P. Dupas, W. Pariente and V. Pons, National Bureau of Economic Research, Working Paper 16933, 2011. 2 R. Baker, Membrane Technology and Applications, Wiley, 2nd edn, 2004. 3 N. Voutchkov, IDA conference, November, 2010, pp. 2–3. 4 J. MacHarg and T. Seacord, Desalination & Water Reuse, 2008. 5 P. Dickie, WWF, 2007. 6 A. Goreno, J. A. Redondo and F. Reverberi, Desalination, 2005, 178, 247–260. 7 L. Addams, G. Boccaletti, M. Kerlin and M. Stuchtey, Charting Our Water Future: Economic Frameworks to Inform Decision-making, W. R. Group and McKinsey and Company, 2009. 8 S. T. Oyama and S. M. Stagg-Williams, Inorganic, Polymeric and Composite Membranes, Elsevier, 2011. 9 S. C. O'Hern, C. A. Stewart, M. S. H. Boutilier, J.-C. Idrobo, S. Bhaviripudi, S. K. Das, J. Kong, T. Laoui, M. Atieh and R. Karnik, ACS Nano, 2012, 6, 10130–10138. 10 D. Cohen-Tanugi and J. C. Grossman, Nano Lett., 2012, 12, 3602–3608. 11 F. Fornasiero, H. G. Park, J. K. Holt, M. Stadermann, C. P. Grigoropoulos, A. Noy and O. Bakajin, Proc. Natl. Acad. Sci. U. S. A., 2008, 105, 17250–17255. 12 H. Y. Yang, Z. J. Han, S. F. Yu, K. L. Pey, K. Ostrikov and R. Karnik, Nat. Commun., 2013, 4, 2220. 13 C. Y. Tang, Y. Zhao, R. Wang, C. Hélix-Nielsen and A. G. Fane, Desalination, 2013, 308, 34–40. 14 S. Lin and M. J. Buehler, Nanoscale, 2013, 5, 11801–11807. 15 K. P. Lee, T. C. Arnot and D. Mattia, Science, 2011, 370, 1–22. 16 L. Song, J. Y. Hu, S. L. Ong, W. J. Ng, M. Elimelech and M. Wilf, J. Membr. Sci., 2003, 214, 239–244. 17 A. Zhu, A. Rahardianto, P. D. Christodes and Y. Cohen, Desalin. Water Treat., 2010, 15, 256–266. 18 M. Elimelech and W. A. Phillip, Science, 2011, 333, 712–717. 19 Z. Dorsey, WateReuse Association Desalination Committee, 2011. 20 J. Johnson and M. Busch, Desalin. Water Treat., 2010, 15, 236–248. 21 Dow Water Process Solutions, http://www.dowwater andprocess.com. 22 B. Sessions, W.-Y. Shih, J. MacHarg, S. Dundorf and J. A. Arroyo, Texas Water Development Board, Report 0804830845, 2011. 23 D. Konatham, J. Yu, T. A. Ho and A. Striolo, Langmuir, 2013, 29, 11884–11897. 24 S. S. Sablani, M. Goosen, R. Al-Belushi and M. Wilf, Desalination, 2001, 141, 269–289. 25 K. Spiegler and O. Kedem, Desalination, 1966, 1, 311–326. Energy Environ. Sci. View Article Online Open Access Article. Published on 04 February 2014. Downloaded on 15/02/2014 14:29:53. This article is licensed under a Creative Commons Attribution-NonCommercial 3.0 Unported Licence. Energy & Environmental Science 26 P. Brian, Ind. Eng. Chem. Fundam., 1965, 4, 439–445. 27 E. Hoek, A. S. Kim and M. Elimelech, Environ. Eng. Sci., 2002, 19, 357–372. 28 A. Zhu, P. D. Christodes and Y. Cohen, J. Am. Chem. Soc., 2009, 48, 6010–6021. 29 K. H. Mistry, R. K. McGovern, G. P. Thiel, E. K. Summers, S. M. Zubair and J. H. Lienhard, Entropy, 2011, 13, 1829– 1864. Energy Environ. Sci. Paper 30 M. E. Williams, A review of reverse osmosis theory, 2003. 31 J. C. van Dijk, Drinking water treatment technology, 2007. 32 C. Bartels, R. Franks and K. Andes, Singapore International Water Week, Singapore, 2010. 33 http://www.Desaldata.com, Global Water Intelligence, 2013. 34 F. Banat, From Red Sea to Dead Sea – Water and Energy Conference, Geneva, 2007. 35 Z. Amjad, Reverse osmosis, Chapman & Hall, 1993. This journal is © The Royal Society of Chemistry 2014
Download