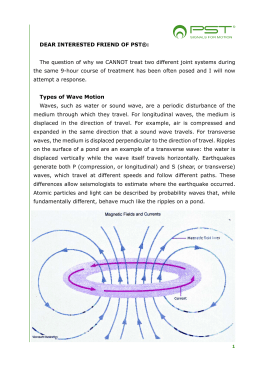
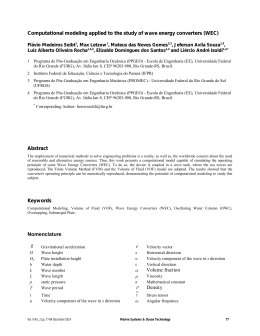
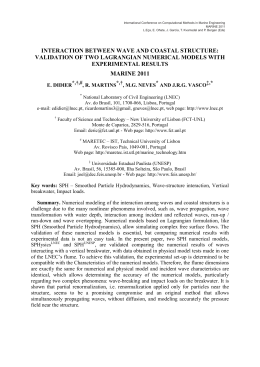
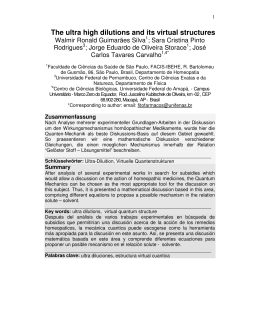
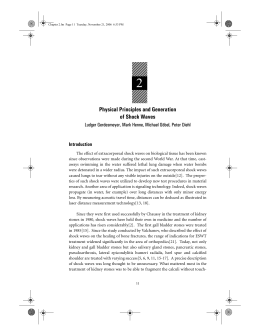
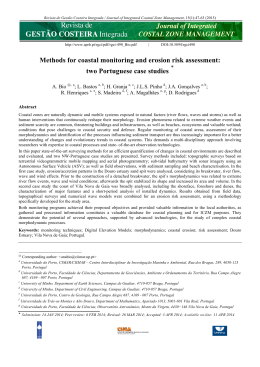
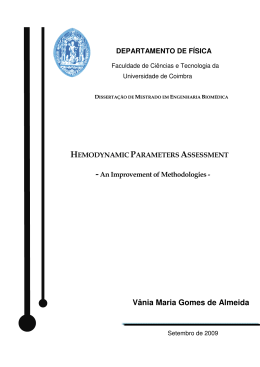
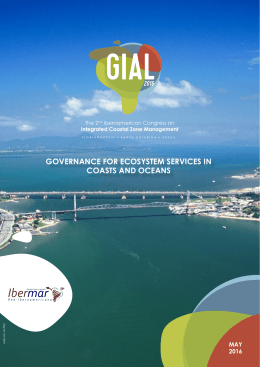
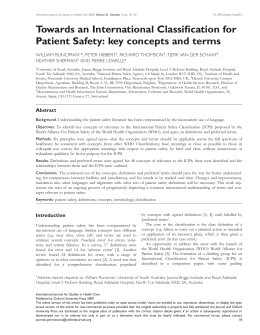
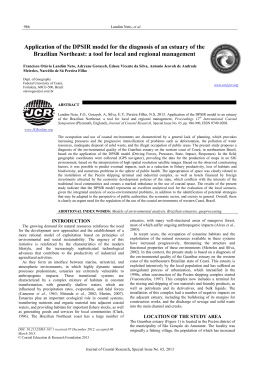
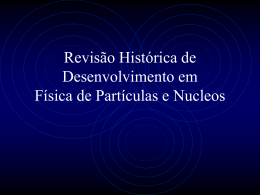
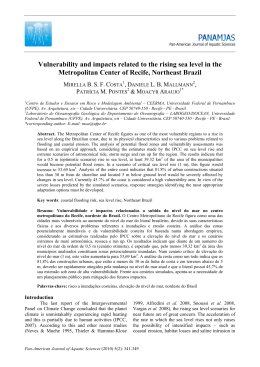
Journal
Journalof
ofCoastal
CoastalResearch
Research
SI 64
pg -- pg
1179
1183
ICS2011
ICS2011 (Proceedings)
Poland
ISSN 0749-0208
Determining the Nearshore Wave Climate between Galinhos and
Guamaré – Brazil
A. C. Scudelari† , C.J.E.M. Fortes‡ and C.F. Neves∞
†Civil Departament,
Federal University of
Rio Grande do Norte,
Natal,
59072-970, Brazil
[email protected]
‡ DHA – NPE,
LNEC
Lisboa,
1700-066,
Portugal
[email protected]
∞ Ocean Engineering
Program,
COPPE/UFRJ,
Rio de Janeiro,
21949-900,
Brazil
[email protected]
ABSTRACT
SCUDELARI, A. C.; FORTES, C.J.E.M. and Neves, C.F., 2011. Determining the nearshore wave climate between
Gainhos and Guamaré - Brazil. Journal of Coastal Research, SI 64 (Proceedings of the 11th International Coastal
Symposium), 1179 – 1183. Szczecin, Poland, ISSN 0749-0208
This paper applies two numerical models, REFDIF and SWAN, to characterize the wave climate near the coastal
stretch between Galinhos and Guamaré, Brazil. This region is exposed both to incoming swell from North
Atlantic Ocean and to local seas generated by steady SE Trade Winds, tidal currents are strong, and beach
morphology is very dynamic. Both models were applied to the propagation of different wave conditions, from
offshore to the coastline of Galinhos-Guamaré. The following incident wave conditions were considered: periods
between T=5 s and 13 s, deep water heights between H=0.8 m and 2.4 m, and off-shore directions between N-60W (60º) and N-60-E (60º). A total of 1053 simulations were performed for the incident wave conditions for each
model. The results consist on the wave heights and wave directions of study area. It is also analyzed the results at
points over the bathymetric line of -8 m (CD). A comparative analysis of the results obtained with each model
permit to assess their suitability for this area and evaluate their limitations and potentialities.
ADDITIONAL INDEX WORDS: wave refraction, wave diffraction, REFDIF, SWAN,
INTRODUCTION
The region of Galinhos-Guamaré, located at the northern coast
of the state of Rio Grande do Norte, Brazil (Figure 1) is a very
scenic area with high touristic potential. However, oil exploitation
and transportation, both offshore and in coastal locations, salt
ponds and fish farms are the main economic activities in this
region, leading to high environmental risks.
The area presents a diversified morphology (estuaries, tidal
flats, river-marine terraces, bars and sand dunes) continuously
shaped by the joint action of several factors (currents, waves,
wind, etc.), thus vulnerable to sea level and climate changes. Local
bathymetry is very complex, characterized by a gentle slope with
submerged linear longshore dunes.
For these reasons, the area has been the focus of several
environmental studies and monitoring programs, which contribute
to the understanding of coastal processes and evolution.
Castro et al. (2009), Vital et al. (2006, 2010), Stattegger et al.
(2004), Grigio et al. (2006), among others, have pointed out to the
need of better knowledge on waves, tides and winds, as well as on
the hydrodynamic circulation at the area of study. As a matter of
fact, the complex bathymetry and tidal circulation make wave
propagation not a trivial exercise and the correct estimate of the
wave field becomes of fundamental importance for sediment
dynamics, coastal morphodynamic studies, and coastal
engineering design.
However, existing information regarding the waves and their
propagation in the Galinhos-Guamaré region are insufficient as a
basis for any study of coastal and port engineering. To overcome
this problem, numerical models of wave propagation constitute a
viable alternative for estimating the wave climate.
REFDIF (Dalrymple and Kirby, 1991) and SWAN (Booij et al.,
1999) are two examples of wave propagation models that can
simulate the nearshore wave climate. REFDIF propagates regular
waves in mild slope areas, taking into account the effects of
refraction and diffraction, wave dissipation energy (by friction or
by wave breaking) and the presence of currents. It is a phaseresolving model based on the parabolic approximation of the mild
slope equation. It is essentially adapted to model coastal areas
with dimensions on the order of tens of kilometers.
The SWAN model is a nonlinear spectral model that includes
wave generation, propagation and dissipation effects. It is a phaseaveraged model, based on the conservation of the wave action
equation. This model allows for the generation of waves by wind
and considers various phenomena involved in the propagation of
waves and directional spread - refraction, diffraction, wave
breaking and generation of harmonics (non-linear wave-wave
interaction). It is adequate for large coastal areas (hundreds of
kilometers). However, since it is a phase-averaged model, it
cannot describe the wave shape transformation, especially in
shallow depths. Moreover, due to computational limitations, the
Journal of Coastal Research, Special Issue 64, 2011
1179
Galinhos and Guamaré Wave Climate
MODEL’S APPLICATION
The REFDIF and SWAN models were applied to study the
propagation of waves along the maritime area between Galinhos
and Guamaré (Figure 2). The preparation of data, execution and
display of the results of the models were made with the tool
SOPRO (Fortes et al., 2006, 2007). The next sections present the
adopted computational conditions and the results obtained from
both models at the Galinhos-Guamaré coastal area.
Computational conditions for REFDIF model
discretization of the studied area is coarse and does not represent
well the bottom bathymetry. This leads to unrealistic changes in
wave propagation, mainly in shallow water where diffraction
becomes more relevant.
In the present study, the behavior of these two models is
analyzed and their results (wave heights and direction) are
compared to each other for several wave conditions, offshore
Galinhos-Guamaré. Results at selected points along the
bathymetric contour of -8 m (Chart Datum) are also analyzed.
From this comparative analysis it is possible to assess the models’
suitability for this area.
After this introduction, a brief characterization of the existing
wave climate and tide level is made. It follows a description of
REFDIF and SWAN models and their applicability conditions.
Next, the results are compared, and finally the discussion and
conclusions are presented.
STUDY AREA, WAVE CLIMATE AND TIDAL
LEVEL
The target area extends over approximately 15 km. The
continental shelf is wide, average width of 40 km, with a sandy
bottom. The bathymetry is very complex, large areas with gentle
slope but also submerged shore parallel dunes may exist.
Due to the lack of wave measurements at that region, significant
wave periods and heights were obtained from the Global Wave
Statistics (Hogben, 1986). Such information should be used very
carefully since it corresponds to observations made by different
sources (ships, buoys, wave buoys, visual observation) at different
points in a much wider area that includes for instance Natal
region, 140km away, where the shoreline runs North-South
(Figure 1). Moreover, wave directions are inferred from data and
observations of local winds.
The incident wave conditions considered correspond to wave
periods (T) between 5 s and 13 s, wave heights (H) between 0.8 m
and 2.4 m and wave directions between N-60º-W (-60°) and N60º-E (60º). Tidal level information was obtained from the
Brazilian Hydrographic Service (DHN), and corresponds to +1.3
m in relation to chart datum (CD) for both models.
Table 1. Grid dimensions for the meshes and number of nodes.
spacing
D1
domain
Figure 1. Location of the study area.
The following incident wave conditions were selected in the
calculations with the model REFDIF:
1. direction: from N-60°-W (-60º) to N-60°-E (60º), spaced by 10°
(13 directions);
2. period: T=5 s to 13 s, spaced by 1 s (9 periods);
3. height: H0= 0.8 to 2.4 m, spaced by 0.2 m (9 heights).
These conditions total 1,053 simulations (9 periods × 13 directions
× 9 heights).
The grid used for the calculations is shown in Figures 2 and 3.
Three different domains (D1, D2, D3) were used by REFDIF,
according to the incident wave directions (-60° to 60°), so that the
wave propagation direction should not exceed ± 45º of the
incident wave condition anywhere within the domain. For each
domain, three different meshes (M1, M2, M3) were created,
(Figure 2) whose dimensions and number of nodes are given in
Table 1. The 1st mesh of each domain was extended until the deep
water limit for the longest period and the 3rd mesh included the
area of interest. The grid spacing was set to ensure a minimum of
5 points per wavelength for the chosen wave condition, taking into
account the computational capacity available (Workstation AMD
Athlon ™ Dual Core Opteron 1.7GHz with 2.00GB of RAM).
For each area, the extreme incident directions are also shown in
Figure 3. Since the REFDIF model is based on the mild slope
equation, the bathymetry in the zone between 0 and -20 m was
smoothed, in order to avoid computational instabilities.
D2
D3
M1
6m
mesh
M2
3m
M3
3m
25,920m×33,600m 25,920m×24,000m 25,920m×16,080m
4,320×5,600 nodes 4,320×8,000 nodes 4,320×5,360 nodes
12,960m×36,000m 12,960m×24,000m 12,960m×16,080m
2,160×6,000 nodes 2,160×8,000 nodes 2,160×5,360 nodes
12,960m×36,000m 12,960m×24,000m 12,960m×16,080m
2,160×6,000 nodes 2,160×8,000 nodes 2,160×5,360 nodes
along wave propagation × normal to wave propagation
The range of incident wave directions is for D1 (-60° to -20°),
for D2 (-20° to 20°) and for D3 (20° to 60°). Notice that in the
domains D1, D2 and D3, the mesh M1 is the most distant from the
area of interest and mesh M3 is the one which surrounds that area.
Computation conditions for SWAN model
The input data for the SWAN model is a directional spectrum.
Since no spectral data was available for the site, a JONSWAP
spectrum with a coefficient γ = 3.3 and a cosine directional spread
function was adopted. The peak period and main direction of the
spectrum were the same as those of the monochromatic waves
used for REFDIF. The spectral resolution consisted of 31 intervals
from 0.02 to 0.4 Hz, according to a logarithmic distribution. The
resolution in direction was 2º.
Journal of Coastal Research, Special Issue 64, 2011
1180
Scudelari et al.
Figure 2. Bathymetry of Galinhos-Guamaé region. REFDIF
domains (D1 to D3) and meshes. Representation of the range of
incident waves to be considered, at each domain.
For the definition of the domains and meshes, the same
bathymetry was used as for model REFDIF (Figure 2, Figure 3).
The first mesh covers the entire offshore region of Galinhos and
Guamaré with dimensions of 63 km by 57 km and spacing of 300
m. The 2nd mesh, a more refined one within the first one, had a
resolution of 150 m, a total of 12 km by 10.5 km. The 3rd mesh,
the most refined and embedded in the second one, had a resolution
of 25 m and dimension of 9 km by 9 km.
The offshore incident wave spectrum boundary conditions are
imposed on two sides of the 1st mesh, which depend on the
incident wave direction. The results of the global mesh provide the
boundary conditions for the 2nd mesh, and the results of that mesh
provide the boundary conditions for the 3rd mesh.
In the present calculations, neither currents nor winds were
considered. On the 1st mesh, only the variation of water depth
along the domain was considered. For the 2nd and 3rd meshes,
diffraction and nonlinear effects were included.
PRESENTATION AND DISCUSSION OF
RESULTS
Values of wave heights and wave directions for all 1,053
simulated conditions at were compared on the entire area along the
coastline between Galinhos and Guamaré and a limited area
centered on the area of interest, Figure 2 and 3. Results were also
obtained along the bathymetric contour of -8 m (line A), at 5
selected points about 800 m apart from each other.
Based on those results, the following figures were chosen:
• Wave characteristics (wave height and wave direction) in 3rd
mesh of the domain of calculation, for incident waves θ= -40°,
0º and 40°, T=7 s and H=2 m;
• Wave agitation characteristics (height and direction) along the
bathymetric contour of -8 m (CD), for incident waves with
θ ∈ [-60º, 60°], T=7 s and H=2 m.
Note that the wave condition, T=7 s and H= 2 m, as concluded
from the results, corresponds to the most frequent one.
Wave characteristics along the domain
From the analyses of wave characteristics along the domain, it
appears that, in general, with both models, the incident wave with
T=7 s and H=2 m, suffers a progressive rotation as the wave
propagates shoreward. The waves hit the coast with greater
Figure 3. SWAN model: Domain and meshes used.
Representation of the range of incident waves to be considered, at
the domain.
intensity as the incident wave directions turn from -40° to 0° or
40° to 0°. The changes occur both in wave height (increase or
decrease) and in wave direction, depending on the offshore wave
considered. Changes in wave height are more significant than the
ones in wave direction, especially for REFDIF model results.
For REFDIF model, there is more variability in the values of
wave height along the domain leading to areas of
convergence/divergence of wave energy. This variability is more
significant for the directions of -40° and 40°. For the SWAN
model, there are much less areas of convergence/divergence of
energy. The wave characteristics is maintained unchanged (less
variability in the values of wave height along the domain) or is
reduced slightly for directions between -40° to 40°.
The differences between results from the two models can be
explained by the much higher spatial resolution (3 m) of REFDIF
than that of SWAN model (25 m) at the 3rd mesh. Moreover,
REFDIF is a regular wave propagation model and does not
consider the scattering of waves in frequency and direction, as
SWAN does. These two differences lead to a smoother wave
height values by SWAN.
Wave properties along the contour -8m
Figures 4 to 6 present the SWAN and REFDIF results for wave
height and direction at 5 points along the bathymetric contour -8m
(CD), spaced by 800 m, for incident waves with T=7 s and H=2 m
and wave directions between -60º and 60º.
Regarding the variation of wave height with the incident wave
direction, it can be seen that, with the model REFDIF:
•For incident wave directions between 60º and 30º, wave heights
vary from 1.5 to 2.1 m, reaching the coast with a slight
reduction or without major changes in height;
•For the incident wave direction between -40° and -50°, wave
heights are always less than the deep water values, showing
greater variability over the bathymetric points;
•For the incident direction of -60°, wave heights increase, what
seems surprising because it is a very oblique incidence. It seems
that maybe the model REFDIF is used outside its domain of
validity.
With the SWAN model, it was observed that for all wave
directions, wave heights vary from 1.5 to 2.0m, reaching the coast
without significant changes. For most directions, there is no
Journal of Coastal Research, Special Issue 64, 2011
1181
Galinhos and Guamaré Wave Climate
a)
b)
Figure 4. – SWAN model. Significant wave height (a) and mean wave direction values (b) along the bathymetric line of -8 m (CD), for
incident waves of Tp= 7 s, HS= 2.0 m and θ=[-60o, 60º].
variability in the wave height values over the points of
bathymetric contour, except for wave directions of -10º and -20º.
Regarding the variation of local wave direction with the
incident wave direction, D0, one can see that, in general, with the
two models:
• There seems to be a linear relation between incident wave
directions and wave directions at points in the bathymetric
contour;
• For incident wave directions between 0° and 20º do not change
along the domain, which is expected since they are almost
parallel to the direction of the gradient of the bathymetry;
• For wave direction values higher than 20º the calculated values
of the wave direction near the coast are lower than the incident
wave (spin-wave to the left, to align with the gradient of the
bathymetry);
• For values below 0° the calculated values of the wave direction
near the coast are higher than the incident wave (spin-wave to
the right, to align the gradient of the bathymetry).
The differences between results from the two models are more
evident for wave height than for wave direction. Although the
bathymetries used in both models are similar in terms of the
orientation of the contour lines, there are significant differences in
shallow areas because of different grid spacings.
In addition, diffraction in the SWAN model is considered
approximately as a directional dispersion which is not the case of
REFDIF model. In the other way, REFDIF model only propagates
regular waves, and so does not take into account the spectral
dispersion (direction and frequency) and changes on the wave
period by transfer of energy between spectral components such as
a)
the model SWAN models. In addition, it was admitted that the
wave heights, periods and directions, resulting from calculations
with regular waves REFDIF model, are equivalent to the values of
significant wave heights, peak periods and peak directions of a
wave spectrum, which is also an approximation.
CONCLUSIONS
This paper presented the application of REFDIF (Dalrymple and
Kirby, 1991) and SWAN models (Booij et al. 1991) to the wave
propagation at the coastal zone between Guamaré and Galinhos,
Rio Grande do Norte, Brazil, for different incident wave
conditions. While REFDIF model is a phase-resolving model for
monochromatic waves, SWAN is a phase-averaged model that
propagates a wave spectrum.
Results from both models were compared at the entire domain
and along the bathymetric contour of -8 m (CD), showing similar
patterns. In fact, overall, for incident wave T=7 s and H=2 m,
there is a gradual rotation of the wave direction, adjusting to the
bathymetric contours (refraction effect). Changes in wave height,
either increase (convergence areas) or decrease (divergence areas),
depended on the incident wave direction. In general, higher waves
reach the shore as the incident wave direction turns from -60° to
0° or 60° to 0°. With both models, the wave direction at various
points is the result of combined refraction-diffraction and depends
on the incident wave direction. In general, incident waves with a
direction of about 0° and 20º suffer virtually no change in
direction, whereas waves with directions outside this range have
opposite variations.
b)
Figure 5. – REFDIF model. Significant wave height (a) and mean wave direction values (b) along the bathymetric line of -8 m (CD), for
incident waves of Tp= 7 s, HS= 2.0m and θ=[-60o, 60º]
Journal of Coastal Research, Special Issue 64, 2011
1182
Scudelari et al.
a)
b)
Figure 4. – Comparison of REFDIF and SWAN results. Wave height and direction values along the bathymetric line of -8 m (CD),
for incident waves of T= 7 s, HS= 2.0 m and θ=-40o, 0º and 60º.
Significant differences between both models have been found
with regard to wave height variation: SWAN results are smoother
than REFDIF ones, especially in the shallower depths. There is
greater variability in REFDIF wave height values along the
domain because of areas of convergence/divergence of wave
energy, which does not occur for SWAN. This may be partly due
to the much larger spatial resolution adopted for the 3rd
computational mesh used in the SWAN (25 m) compared to the
REFDIF (3 m), leading to smoother bathymetry, but also results
from the intrinsic mathematical models. Calculations should be
made for this test case with the SWAN model using meshes with
greater spatial resolution to obtain values closer to REFDIF.
In summary, both models showed to be appropriate for the
study area. While SWAN is simpler to be applied, especially in
regard to the preparation of the computational grids, it demanded
higher computational time in comparison to REFDIF. In addition,
SWAN can be applied to a larger region, but the resolution of the
computational grid, especially in smaller water depths, needs
special consideration since it may conduct to some mistakes in the
local wave field. Otherwise, REFDIF is a monochromatic wave
model and does not take into account the spectral dispersion (in
direction and in frequency), or the change on the wave period due
to energy transfer between spectral components, as it occurs in
Nature and is modeled by SWAN.
So, in large coastal areas, SWAN model is a good alternative
while for the propagation near the coast, where the bathymetry
changes more significantly, REFDIF should be used.
In other applications of these models, it is advisable to assess
what are the most important problems and, therefore, which model
best simulates them. It is important to remember that, in addition
to the physical phenomena that are decisive in choosing the
model, there are other aspects to take into account, such as the size
of the study area, the purpose of the study and the its urgency.
REFERENCES
BOOIJ, N., RIS, R. C. and HOLTHUIJSEN, L. H., 1999. A Thirdgeneration Wave Model for Coastal Regions, Part I, Model
Description and Validation. Jounal Geophysical Research,
104 (C4), pp. 7649-7666.
CASTRO, A. F. ; AMARO, V. E. ; C.F. de Souza ; GRIGIO,
A.M. 2009. Modeling and Development of a Computacional
System to Create Environmental Sensitivity Index Maps for
Oil Spill in High-Energy Coastal Enviroments. Journal of
Coastal Research , v. 56, p. 1474-1478.
DALRYMPLE, R. A. and KIRBY, J. T.; 1991. REFDIF 1,
Version
2.3,
Documentation
Manual.
Combined
Refraction/Difraction Model. CARC Report 91-91, University
of Delaware, January.
FORTES, C. J. E. M.; PINHEIRO, L.; PALHA, A.; 2007. O
pacote SOPRO: Evoluções recentes. 5ªs Jornadas Portuguesas
de Engenharia Costeira e Portuária” (JPECP), Lisboa,
Outubro.
FORTES, C. J. E. M.; PINHEIRO, L.; SANTOS, J. A.; NEVES,
M. G. O.; CAPITÃO, R., 2006. SOPRO – Pacote integrado de
modelos para avaliação dos efeitos das ondas em portos.
Revista da Tecnologia da Água, Edição I, Março de 2006.
GRIGIO, A. M., AMARO, V. E., VITAL, H., DIODATO, M. A.,
2005. A method for coastline evolution analysis using GIS and
Remote sensing - A case study from the guamare city,
Northeast Brazil. Journal of Coastal Research, Florida, USA,
v. 42, p. 412-421.
GRIGIO, A. M., SOUTO, M. V. S, CASTRO, A. F. de, AMARO,
V. E., VITAL, H., 2006. Use of remote sensing and
geographical information system in the determination of the
natural and environmental vulnerability of the Municipal
District of Guamaré - Rio Grande do Norte - Northeast of
Brazil. Journal of Coastal Research, Special Issue 39
(Proceedings of the 8th International Coastal Symposium). v.
39, p. 293-298.
HOGBEN, N.; ,1986. Global Wave Statistics.
STATTEGGER, K.; CALDAS, L. H. de O. and VITAL,H. , 2004.
Holocene coastal evolution of the northern Rio Grande do
Norte coast, NE Brazil. Journal of Coastal Research, SI39,
proc. ICS2004.
VITAL, H., GUEDES, I. M. G., 2006 . Erosion on areas of oil and
gas exploration along the coast of northeastern Brazil: The
Guamaré Hotspot. WIT Transactions on Ecology and The
Environment, Inglaterra, v. 88, p. 175-182.
VITAL, H. ; GOMES, M.P. ; TABOSA, W. F. ; FRAZAO, E. P. ;
PLÁCIDO JUNIOR, J. S. ; SANTOS, C. L. A. 2010.
Characterization of The Brazilian Continental Shelf Adjacent
to Rio Grande do Norte State, NE Brazil. Brazilian Journal of
Oceanography (Press) , v. 58, p. 43-54.
ACKNOWLEDGEMENTS
The first author thanks CAPES for a post-doctoral fellowship
through the project CAPES-GRICES 158/06, BEX2563/06-1
process. The authors thank Dr. A. B. Coli for the help in the
implementation of the SWAN model, and Eng. A. Palha, L.
Pinheiro, and L. Mendes for assistance in implementing SOPRO
package. They also acknowledge funding from FCT through the
projects PTDC/ECM/73145/2006, PTDC/AMB/67450/2006 and
PTDC/ECM/67411/2006.
Journal of Coastal Research, Special Issue 64, 2011
1183
Download