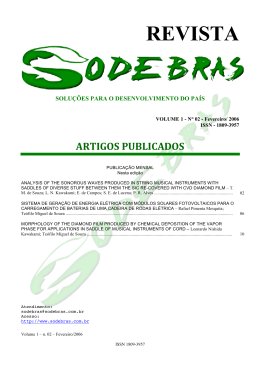
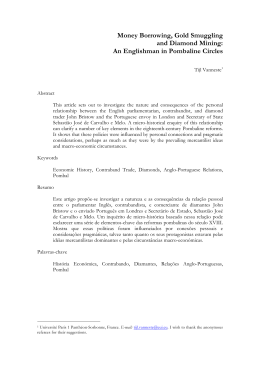
Os RELATÓRIOS CIENTÍFICOS E TÉCNICOS DO IPIMAR destinam-se a uma divulgação rápida de resultados preliminares de carácter científico e técnico, resultantes de actividades de investigação e de desenvolvimento e inovação tecnológica. Esta publicação é aberta à comunidade científica e aos utentes do sector, podendo os trabalhos serem escritos em português, em francês ou em inglês. A SÉRIE COOPERAÇÃO destina-se, primordialmente, à divulgação de trabalhos realizados com países terceiros no âmbito de programas de cooperação. A SÉRIE DIGITAL destina-se a promover uma Consulta mais diversificada e expedita dos trabalhos na área da investigação das pescas e do mar. Edição IPIMAR Avenida de Brasília 1449-006 LISBOA Portugal Corpo Editorial Francisco Ruano – Coordenador Aida Campos Irineu Batista Manuela Falcão Maria José Brogueira Maria Manuel Martins Rogélia Martins Edição Digital Anabela Farinha / Irineu Batista / Luís Catalan As instruções para os autores estão disponíveis no sítio web do IPIMAR http://ipimariniap.ipimar.pt/ ou podem ser solicitadas aos membros do Corpo Editorial desta publicação Capa Luís Catalan ISSN 1645-863x Todos os direitos reservados EFFECTS OF CHANGING THE EXPLOITATION PATTERN OF NORWAY LOBSTER (NEPHROPS NORVEGICUS) FISHERY IN ALENTEJO AND ALGARVE. Fátima Cardador; Paulo Fonseca; Cristina Silva; Aida Campos INSTITUTO NACIONAL RECURSOS BIOLÓGICOS I.P. – L. IPIMAR – U I-REMS Recebido em 2008.09.10 Aceite em 2009.10.21. ABSTRACT The effects of different changes in the exploitation pattern were simulated for the Norway lobster, Nephrops norvegicus, stock exploited by trawl fishery in Alentejo and Algarve (ICES Functional Units 28 and 29) off the Portuguese coast. Current mesh size was assumed to be 55 mm (diamond) and several simulations were carried out considering increases in codend mesh size and change in codend mesh configuration (diamond and square), separately and combined with sorting grids of different mesh size. Short and medium term effects and respective confidence intervals were estimated in terms of spawning stock biomass and landings. It is concluded that the adoption of square mesh codends would be the most beneficial for the stock although immediate losses in the landed weight may be high. Keywords: Norway lobster, Portuguese Alentejo and Algarve functional units, trawl mesh size, mesh configuration (diamond and square), sorting grids, spawning stock biomass, landings. RESUMO Título: Efeitos de alterações ao padrão de exploração no stock de lagostim, Nephrops norvegicus, nas costas do Alentejo e Algarve. Neste estudo, foram simulados os efeitos de alterações ao padrão de exploração no stock de lagostim, Nephrops norvegicus, explorado pela pescaria de arrasto para crustáceos na costa portuguesa, nas Unidades Funcionais 28 (Alentejo) e 29 (Algarve) do CIEM. Considerando que a malhagem utilizada no saco corresponde a 55 mm (losangular), simulou-se a adopção de diferentes malhagens e dois tipos de configuração da malha (losangular e quadrada), utilizadas separadamente e combinadas com grelhas separadoras de malhagens diferentes. Foram estimados os efeitos, a curto e a médio prazo, decorrentes das diferentes opções, na biomassa do stock reprodutor e nos desembarques, e calculados os respectivos intervalos de confiança. Concluiu-se que a utilização de malha quadrada no saco produz os maiores benefícios no stock, embora as quebras imediatas nas capturas possam ser elevadas. Palavras-chave: Lagostim, unidades funcionais Alentejo e Algarve, malhagem do arrasto, configuração da malha (losango e quadrada), grelhas de separação, biomassa reprodutora. ___________________________________________________________________________ REFERÊNCIA BIBLIOGRÁFICA CARDADOR, F.; FONSECA, P.; SILVA, C.; CAMPOS, A., 2009. Effects of changing the exploitation pattern of Norway lobster (Nephrops norvegicus) fishery in Alentejo and Algarve. Relat. Cient. Tec. IPIMAR, Série Digital (http://ipimar-iniap.ipimar.pt) nº 48.25pp. 3 INTRODUCTION The Norway lobster (Nephrops norvegicus) distributes along the Portuguese coast, at depths ranging from 200 to 800 m, approximately. The main fishing grounds are located off the southwestern and southern coasts, Alentejo and Algarve, respectively. Nephrops is exploited together with rose shrimp (Parapenaeus longirostris) and other deep-water shrimp species in a multi-species trawl fishery. Norway lobster and rose shrimp constitute the bulk of the catches and according to their relative abundance and market value the fleet may re-direct the fishing effort preferentially to one of them, as it becomes apparent the existence of two distinct landing profiles in the fishery (Campos et al., 2007, Abad et al., 2007) Although landings from this fishery are low in weight when compared to fish trawl landings, they are highly valuable. In 2005, 40% of a total of 807 tonnes landed were constituted by Norway lobster corresponding to a first sale value of 6 millions euros and representing 60% of total landed crustacean value (INE, 2006). The main commercial by-catch fish species landed are hake (Merluccius merluccius) and anglerfish (Lophius spp.). However, in 2004 and 2005 the blue whiting (Micromesistius poutassou) became the first by-catch species landed. Hake and blue whiting are also among the most important species discarded (Fernandes et. al, 2007). In 2005, a total of 32 crustacean trawlers with an overall length ranging between 23-32 meters, gross tonnage of 96241 tonnes and engine power of 316-577 kW, were in operation. These vessels were licensed for two mesh-sizes classes, 55 mm for shrimp species and 70 mm for Nephrops. There were also a few demersal fish trawlers (4 out of 70 vessels licensed for mesh-sizes above 65 mm) targeting Nephrops1 in 25 to 50% of their trips. The Minimum Landing Size (MLS) established by the Council Regulation (EC) No. 850/98 for Nephrops in this region is 20 mm of carapace length (CL). Nephrops was assessed in the ICES Working Group on Nephrops stocks (WGNEPH) up to 2003, moving to the Working Group on the Assessment of Southern Shelf Stocks of Hake, Monk and Megrim (WGHMM) in 2004. Due to its benthic characteristics, Nephrops is assessed in smaller subdivisions of the ICES Management Areas, the so-called Functional Units (FU). The ICES Division IXa is constituted by five FUs: West Galicia (FU 26), North Portugal (FU 27), Alentejo or Southwest Portugal (FU 28), Algarve or southern Portugal (FU 29) and Gulf of Cadiz (FU30). Due to difficulties in having landings by FU, FUs 26 and 27 1 C. Silva, 2007, unpublished, data source: General Directorate of Fisheries and Aquaculture. 4 are assessed together as well as FUs 28 and 29. The five FUs are managed with one TAC value for the entire area (ICES, 2006c) Up to 1992, landings from FUs 28 and 29 fluctuated between 450 and 530 t and declined sharply afterwards to a minimum of 132 t in 1996. Although landings from 1997 to 2005 increased to the levels observed during the early 1990s, they have never attained the 1980s levels. Males dominate the landings being the most exploited component of the stock, thus constituting the reference for its state of exploitation. Females and males reach the first maturity around 30 and 28 mm of carapace length respectively (ICES, 2006a); it is assumed that 25% of the individuals at age 2 are mature (ICES, 2006b) Results from the 2006 assessment (ICES, 2006b) indicated that fishing mortality for both males and females steadily increased since 1998. Males spawning stock biomass (SSB) had a declining trend in the period 1989-95, increased in 1996-2001 and is fluctuating around the long-term average since then. Females SSB shows a similar but less pronounced pattern and has increased in the last two years. Recruitment levels showed a clear increase in recent years, after a period of stability at low levels. Although the absolute recruitment values are not considered due to the retrospective pattern, this increase is in agreement with the trends observed in the research surveys. A reduction in TAC has been recommended since 1997 (ICES, 1997) and a 0-TAC or the implementation of a recovery plan since 2002 (ICES, 2002). A Sub-Group on Management Objectives (SGMOS) of the Scientific, Technical and Economical Committee for Fisheries (STECF) was created in 2003 to address the topic of a recovery plan for southern hake and Iberian Nephrops stocks. Simulations were carried out to evaluate the effects in stock biomass of different scenarios, combining two variables, recruitment and fishing mortality strategy. The final proposal set the level of F0.1 (0.15) as the recovery plan target for hake and recommended a yearly 10% reduction in fishing mortality relative to the preceding year. Under this strategy, the hake stock is expected to be rebuilt within 10 years. Considering that the Nephrops stocks were in worse condition, a similar reduction in fishing mortality was proposed complemented by the permanent closure of five boxes to trawl and creel fishing (STECF/SGMOS, 2004). In December 2005, the recovery plan for the southern stock of hake and the Iberian Nephrops stocks was approved to start in January 2006. In addition, to further reduce fishing mortality of Nephrops, a 3 and 4-month closed areas in the peak of the fishing season were introduced 5 in FU 26 (West Galicia) and FU 28 (Alentejo), respectively (Council Regulation (EC) No. 2166/2005) (Figure 1). 12.0 45.0 º 11.0 10.0 9.0 8.0 7.0 6.0 5.0 6.0º 5.0º 44.0 º VIIIc 43.0 º Box 1 42.0 º Latitude (N) 41.0 º 40.0 º IXa 39.0 º 38.0 º Box 2 37.0 º 1000 m 36.0 º 12.0º 11.0º 10.0º 9.0º 8.0º 20 0 7.0º m Longitude (W) Figure 1. Temporarily closed areas for Nephrops (Council Regulation (EC) No. 2166/2005): Box 1(Spanish waters) from 1 June to 31 August Box 2 (Portuguese waters) from 1 May to 31 August. Additional technical measures, including modifications in fishing gears, were discussed within the recovery plans, but were not considered at the time. Studies both on size (Fonseca et al., 2007) and species-selectivity (Campos and Fonseca, 2004; Fonseca et al., 2005, Fonseca et al., in press) were carried out in commercial vessels confirming their potential benefits in improving the exploitation pattern. These included changes in cod-end mesh size and mesh configuration, as well as estimation of the selectivity in trawls equipped with separator mesh panels and square mesh windows, and sorting grids (see Figure 2). 6 Figure 2 – Examples of a square mesh size configuration and sorting grid. The aim of the present study is to assess the effects, on landings and on the spawning biomass, of a number of gear modifications, namely: a) alterations to cod-end mesh size and mesh shape, separately considered; and b) these alterations combined with changes in trawl design, by using a particular type of grid made in square mesh (GCRUST3, Fonseca et al., in press) to exclude immature Nephrops. These topics were addressed for the Nephrops Case Study within the project EFIMAS (Operational Evaluation Tools for Fisheries Management Options) in cooperation with the project NECESSITY (NEphrops and Cetacean Species Selection Information and TechnologY), both EU projects financed by the 6th Framework Programme. MATERIAL AND METHODS The management advice for Nephrops stocks from the southwest and southern of Portugal is dependent of the level of exploitation for males, which due to their emergent behaviour are subject to higher fishing pressure than females. Under this consideration, in the present study, the evaluation of the effects of changing the mesh size and/or mesh configuration was carried out on the male population. 7 Stock Input Data The data source was the output derived from the assessment performed in 2006 and presented in the report of the ICES Working Group of Hake, Monkfish and Megrim (WGHMM) in 2006 (ICES, 2006b). Stock numbers-at-age 2-8+, in 2006, were those estimated by XSA (Extended Survivors Analysis) assessment: the population at age 2 (recruitment) adopted was the geometric mean for 1984-2003 population estimates (10272). Population at age 3 was estimated from the age 2 survivors in 2005 which were replaced by the same geometric mean. Fishing mortality-atage at the starting year was considered as the average fishing mortality for the period 20032005 estimated from the 2006 assessment. The values of the biological parameters adopted were those used in the assessment (ICES, 2006b), namely: (i) natural mortality constant for all ages and equal to 0.3; (ii) weight-at-age data from both catches and stock, constant and estimated as the average weight-at-age for the period 2003-2005 and equal to 15g, 26 g, 45 g, 66 g, 88 g, 108 g and 144 g respectively for ages 2 to 8; and (iii) proportion of mature at-age was set constant for all the projected years and equal to 0.25 for age 2 and 1.00 for the older ages. According to the information provided by the Portuguese discards programme on board crustacean trawlers, the trawl codend mesh size of 55 mm is the most used by the Portuguese crustacean fleet. This is the legal mesh size to catch rose shrimp (Parapenaeus longirostris). Selectivity data The selection curves parameters used herein were obtained during different surveys aiming the characterization of crustacean trawls size- and species-selectivity, onboard commercial vessels fishing off the Portuguese continental southern coast. The selectivity data for PET double-twine 55, 70 and 80 mm mesh size codends resulted from 93 valid hauls carried out on board the F/V “Porto Bravo”, from Autumn 1998 to Summer 1999. The data have been modelled by Fonseca et al. (2007), the L50 being found to vary with mesh size and twine material while the selection range was constant. Selectivity parameters for those mesh sizes, and additionally for 60 and 65 mm codends were estimated by using the model described by Fonseca et al. 2007 (Table 1). Data for the square mesh codend are from an experiment carried out on board the F/V ‘Saturno’, in August 20062, within the project “NECESSITY” using an ‘Euroline Premium 2 Experiments carried out under projects NECESSITY (EU-FP6, SSP8-CT-2003-501605) and MARE – Fishing Technologies’(QCAIII 22-05-01-FDR00014) 8 Plus’ 3.5 mm single twine codend with a mesh size of 60 mm (30 mm bar length). A logistic model was adjusted by Maximum Likelihood (ML) to the pooled data. Extrapolation to mesh sizes of 55 and 60 mm was carried out assuming that both the selection range (SR) and the selection factor (SF) are constant. These are mild assumptions since square meshes maintain their shape during the entire haul and thus no change in the escape pattern of Norway lobster is expected as mesh size increases. The information on grid selectivity was also collected at the scope of the project “NECESSITY”, on board the F/V ‘Gemini’, between 26 October and 11 November 2005, where a total of 27 hauls were carried out with a grid equipped with a selective section made of 60 mm square mesh (30 mm bar length). The square mesh section selected small Norway lobsters which crossed the grid escaping through an opening in the bottom panel, while the remaining catch was guided to the upper grid section entering the codend (Fonseca et al., in press). The methodological procedure in estimating the selection curve followed that used for the square mesh codend, and so did the extrapolations for mesh sizes of 65 and 70 mm. For the purpose of simulation, an overall gear selection curve was determined as the product of the single selection curves estimated for the grid and codend. Simulation The evaluation of the impacts on the spawning stock biomass (SSB) and on the landings resulting from an increase in mesh size or a change in mesh configuration was carried out using a simulation package (CP2) developed in R (Jardim and Azevedo, pers. comm, 2006, in annex). When running CP2, 500 resamples were performed, with a controlled seed in the random number generator. The projection period was 10 years starting at 2006. The starting numbers for projections were sampled from a normal distribution with mean equal to the estimated stock numbers-at-age and coefficient of variation (CV) of 0.4 for ages 2 and 3 and 0.2 for the following age. Recruitment at age 2 was considered constant with a Gaussian error and a CV of 0.4. The CV values adopted in this study are in the range of those values usually accepted taking into account the uncertainties of the assessment. Fishing mortality-at-age at the starting year was sampled from a log-normal distribution with the mean equal to the average fishing mortality for the period 2003-2005 and CV of 0.2 for all ages. Uncertainties in natural mortality, maturity-at-age, mean weight-at-age in the stock and in the landings were not taken into account in this process. 9 As referred above, the current trawl codend mesh size3 in use by the Portuguese trawl fleet was considered to be 55 mm, with a selectivity-at-age denoted as s55,a . Selectivity-at-age was estimated from selectivity-at-length by applying the slicing technique to convert length to age groups and averaging the percentage of retention for the lengths belonging to each age group. The von Bertalanffy growth parameters used in the slicing were L∞ = 70 mm of carapace length and K =0.2 year -1 (ICES, 2006b). Selectivity-at-age was considered not to be subject to variation. It was assumed that changes in mesh size took place in the beginning of year 2006; consequently, the F-at-age in 2006 was estimated as being proportional to the new selectivityat-age (proportion retained), which we denote by snew,a : F2006 new,a=F200655,a*snew,a/s55,a. The following scenarios were considered: Increase in diamond mesh size to 70 and 80 mm Adoption of square mesh sizes of 45, 50, 55 and 60 mm Use of sorting grids with 60, 65 and 70 mm (30.0, 32.5 and 35.0 mm distance between bars) square mesh panels mounted, along with diamond codends of 55, 60 and 65 mm mesh sizes, in a total of 9 cases. For each scenario the percentiles of 10%, 25%, 50%, 75% and 90% for the spawning stock biomass, landings in weight and in number were estimated for the 2006-2016 period. Mean weight in the landings was calculated dividing the landings in weight by the total number in landings, using the 50% percentile values of both. This value can be considered as a proxy for changes in revenue as the price per kg increases with the individual weight. The effects in spawning stock biomass (SSB) and landings (in weight) were estimated for each scenario and by year and expressed in percentage of change relative to the current values. These percentages were estimated with the values corresponding to the 50% percentiles. RESULTS Selectivity-at-age Selectivity-at-age of Nephrops males estimated for the current codend mesh size (55 mm), 70 and 80 mm diamond are presented in Figure 3. 3 For a targeted fishery for Nephrops the legislation enforces a trawl minimum mesh size of 70 mm. 10 The increase in mesh size from 55 mm to 70 and 80 mm has a potential high impact in the proportions retained at age-groups 1 and 2. However, age-group 1 is not landed so its effect is not evident. For age-group 2 the proportion retained is reduced by 34% and 64% when mesh sizes increase from 55 to 70 and 80 mm, respectively. The increase in mesh size from 55 to 80 mm also reduces in 20% the retention of age-group 3. 55D(current) 70D 80D proportion retained 1.00 0.75 0.50 0.25 0.00 1 2 3 4 5 6 7 8+ Age group Figure 3 - Trawl selectivity-at-age for Nephrops with diamond mesh codends (D) of different mesh sizes and the current diamond mesh codend 55D The adoption of a square mesh configuration in the codend substantially reduces the proportion of retained individuals at age groups 1 to 4. For example the 55 mm square mesh reduces in more than 50% the selectivity-at-ages 1 and 2, 64% and 55% respectively when compared with the retention of the 55 mm diamond mesh (Table 1). For age groups 3 and 4 the retentions decrease by 32% and 16 %, respectively. Table 1 - Trawl square mesh sizes (S) and current mesh size (55D): proportion retained at age Age group 1 2 3 4 5 6 7 8+ 55D 0.54 0.89 0.99 1.00 1.00 1.00 1.00 1.00 45S 50S 0.34 0.59 0.82 0.92 0.96 0.98 0.99 0.99 0.26 0.50 0.75 0.89 0.94 0.97 0.98 0.99 55S 0.19 0.40 0.67 0.84 0.92 0.95 0.97 0.99 60S 0.14 0.32 0.58 0.78 0.88 0.93 0.96 0.98 The proportions retained at age, when using the sorting grids with the diamond mesh sizes of 55, 60 and 65 mm, are presented in Figures 4, 5 and 6. The use of the grid decreases the 11 retention of the individuals at ages 1-3. For example, if a 55 mm diamond codend is used with the three different square mesh section grids, the retention is reduced, by 61 to 77 % at age 1, by 26 to 43 % at age 2 and by 6 to 13% at age 3 when compared with the same 55 mm diamond codend used alone. The effects of using the three different grid dimensions with the same diamond mesh are small but visible at age-groups 1 and 2. At age-group 3 the effect is negligible. Grid 60 mm 55D 60D 65D 55D(current) Proportion retained 1.00 0.75 0.50 0.25 0.00 1 2 3 4 5 6 7 8+ Age group Figure 4 - Trawl selectivity-at-age for Nephrops with sorting grid equipped with 60 mm square mesh plus diamond mesh codends 55D (current mesh size), 60D and 65D Grid 65 mm 55D 60D 65D 55D(current) Proportion retained 1.00 0.75 0.50 0.25 0.00 1 2 3 4 5 6 7 8+ Age group Figure 5 – Trawl selectivity-at-age for Nephrops with sorting grid equipped with 65 mm square mesh plus diamond mesh codends 55D (current mesh size), 60D and 65D 12 Grid 70 mm 55D 60D 65D 55D(current) Proportion retained 1.00 0.75 0.50 0.25 0.00 1 2 3 4 5 6 7 8+ Age Group Figure 6 – Trawl selectivity-at-age for Nephrops with sorting grid equipped with 70 mm square mesh plus diamond mesh codends 55D (current mesh size), 60D and 65D and 55D (no grid) Fishing mortality-at-age Fishing mortality-at-age in 2006 for the current codend mesh size was estimated as described in the methodology section. Figure 7 shows the expected values of fishing mortality-at-age group when codend mesh size increases from 55 to 70 and 80 mm diamond mesh. Fishing mortality-at-age for group 2 is reduced by 34% and 64% if 70 and 80 mm mesh sizes are used, respectively; for age group 3 decreases by 6 % and 20% and for age group 4 the reduction is negligible for 70 mm and around 4% for 80 mm. 55D(current) 70D 80D 0.70 0.60 0.50 F 0.40 0.30 0.20 0.10 0.00 2 3 4 5 6 7 8+ Age group Figure 7 - Fishing mortality at-age for Nephrops – Diamond mesh size The use of square mesh codends considerably reduces the fishing mortality at ages 2 to 4 (Figure 8) when compared with the current mesh size of 55 mm (diamond). For example, the use of 55 mm square mesh codend reduces in more than 50% and more than 30% the Fs-atage 2 and 3, respectively; F-at-ages 4 and 5 are reduced by 16% and 8%, respectively. For 60 13 mm square mesh codend, the reductions on F are around 65, 40, 20 and 12% for ages 2, 3, 4 and 5 respectively. 45S 50S 55S 60S 55D 0.70 0.60 0.50 F 0.40 0.30 0.20 0.10 0.00 2 3 4 5 6 7 8+ Age group Figure 8 - Fishing mortality at-age for Nephrops – Square mesh codends (S) and currently used diamond mesh codend (55D) Fishing mortality-at-age resulting from the simultaneous use of sorting grids and diamond mesh codends of 55, 60 and 65 mm are shown in Figures 9, 10 and 11. The use of grids decreases the F at ages 2-3. The F is reduced is by 26 to 43% at age 2 and by 6 to 13% at age 3 if the current 55 mm diamond codend is used with progressive increase of the mesh grids. The effects of changing grid mesh size while keeping the same codend is very small. Grid 60 mm 55D 60D 65D 55D(current) 0.70 0.60 0.50 F 0.40 0.30 0.20 0.10 0.00 2 3 4 5 Age group 6 7 8+ Figure 9 - Fishing mortality at-age for Nephrops with sorting grid (60 mm) plus diamond codends, including current codend (55D) 14 Grid 65 mm 55D 60D 65D 55D (current) 0.70 0.60 0.50 F 0.40 0.30 0.20 0.10 0.00 2 3 4 5 6 7 8+ Age group Figure 10 - Fishing mortality at-age for Nephrops with sorting grid (65 mm) plus diamond codends, including current codend (55D) Grid 70 mm 55D 60D 65D 55D (current) 0.70 0.60 0.50 F 0.40 0.30 0.20 0.10 0.00 2 3 4 5 6 7 8+ Age group Figure 11 - Fishing mortality at-age for Nephrops with sorting grid (70 mm) plus diamond codends, including current codend (55D) Short and long-term effects in landings and in SSB with the current codend mesh size of 55mm In status quo conditions, e.g., keeping the current fishing mortality and mesh size, the predictions (percentiles) on landings and SSB are illustrated in figures 12 and 13 for the 20062016 period. Both predictions show a decrease in the first four years remaining relatively stable in the subsequent period. The 2006 predictions estimates are 226 t (50% percentile) for landings and 645 t for SSB. These estimates are very similar to those indicated in the assessment for the year 2005, e.g., 230 t and 675 t, for landings and SSB, respectively (ICES, 2006b). 15 Tables 2 and 3 summarize landings and spawning stock biomass changes, from the first until the fifth year, and in the long-term, relative to the first year (2006). The results indicate a 50% probability that a decrease of 14% in landings and 15% in spawning stock biomass will occur in the long-term. 10% 25% 50% 75% 90% 300 Landings (t) 250 200 150 100 50 2016 2015 2014 2013 2012 2011 2010 2009 2008 2007 2006 0 Year Figure 12 – Landings percentiles with the current codend mesh size (55 mm) for male Nephrops 10% 25% 50% 75% 90% Spawning Stock Biomassa (t) 800 700 600 500 400 300 200 100 2016 2015 2014 2013 2012 2011 2010 2009 2008 2007 2006 0 Year Figure 13 – Spawning stock biomass percentiles with the current codend mesh size (55 mm) for male Nephrops 16 Table 2 – Status quo: Short, intermediate and long-term effects in the landings relative to the first year in male Nephrops (SW and S of Portugal) Percentiles Second year Third year Forth year Fifth year Long-term 2016 50% -2.4 -8.0 -11.3 -11.3 -14.0 Table 3 – Status quo: Short, intermediate and long-term effects in the spawning stock biomass relative to the first year in male Nephrops (SW and S of Portugal) Percentiles Second year Third year Forth year Fifth year Long-term 2016 50% -5.1 -9.8 -13.1 -13.9 -15.2 Effects of increase in mesh size and in mesh configuration Table 4 shows the effects of increasing codend mesh size from 55 mm (diamond) to 70 and 80 mm and of using square mesh codends of 45, 50, 55 and 60 mm. The immediate losses in landings vary from 4% to 9%, if mesh size increases to 70 and 80 mm diamond, respectively. The use of square mesh codends produces higher immediate losses than an increase in diamond mesh size. The losses in landings in the first year vary from 8% to 21%, depending on the increase in mesh size. However after the third year, increases in landings will occur for all mesh sizes. Higher long-term gains in landings and in SSB are estimated to be obtained with the 60 mm square mesh with increases of 4% and 29%, respectively. When using the minimum legal mesh size for targeted Nephrops fishing (70 mm) the expected increase in the long-term landings is 1% and in SSB is 6%. If the 55 mm mesh size change from diamond to square the long-term gain in SSB is 22%. 17 Table 4 – Short, intermediate and long-term effects in the landings and long-term effects in the spawning stock biomass (%) relative to status quo (55mm diamond) in the corresponding year, for male Nephrops (SW and S of Portugal) Landings ( % change) Mesh size (mm) – shape 70 – Diamond 80 – Diamond 45 – Square 50 – Square 55 – Square 60 – Square First year -3.5 -9.1 -8.3 -11.8 -16.0 -21.2 Second year -1.8 -5.1 -4.1 -6.1 -8.8 -12 Third year -0.4 -1.9 -1.6 -2.3 -3.4 -4.7 Fourth year 0.6 1.3 0.4 0.5 0.5 0.4 Longterm (2016) 1.4 3.5 2.1 2.5 3.3 4.3 Long-term SSB (2016) (% change) 6.2 15.3 11.5 16.1 22.0 28.9 Effects of using sorting grids combined with diamond mesh codends The effects in landings and in SSB resulting from changing the current 55 mm diamond mesh codend to the combined use of sorting grids and diamond mesh codends are shown in Table 5. The immediate losses in landings are higher when using the 70 mm sorting grid. The effects of using different mesh codends are of the same level of magnitude (7-8%). As expected, the long-term SSB is higher when using the 70 mm sorting grid with 65 mm diamond mesh codend. This corresponds to a 50% probability that SSB in the long-term increases by 13% when compared to the status quo. Table 5 – Short, intermediate and long-term effects in the landings and long-term effects in the spawning stock biomass (%) relative to status quo (55mm diamond) in the corresponding year, for male Nephrops (SW and S of Portugal) Landings (% change) Grid - mesh size (mm) - shape G60_ _ G65_ _ G70_ 55_Diamond 60_Diamond First year -3.4 -3.9 Second year -1.7 -2.1 Third year -0.4 -0.4 Fourth year 0.4 0.6 Longterm (2016) 1.1 1.4 65_Diamond 55_Diamond 60_Diamond 65_Diamond 55_Diamond 60_Diamond 65_Diamond -4.9 -4.7 -5.2 -6.0 -6.5 -6.8 -7.8 -2.6 -2.4 -2.7 -3.2 -3.3 -3.7 -4.2 -0.6 -0.4 -0.5 -0.8 -1.0 -1.1 -1.4 0.7 0.6 0.7 0.9 0.8 0.8 1.0 2.0 1.7 2.0 2.1 2.2 2.5 3.0 Long-term SSB (2016) (% change) 5.4 6.6 8.4 7.6 8.8 10.2 10.4 11.1 12.7 The use of the sorting grids combined with the current codend mesh size of 55 mm produces immediate losses of 3%, 5% and 7 %, according to the increase in the grid mesh. The longterm increase in SSB is the highest (10%) for 70 mm sorting grid. 18 Effects in the mean weight in the landings As mentioned in the methodology section, the mean weight of the landings may be viewed as a proxy for the expected changes in revenue. The analysis of this parameter was investigated for each simulation and the results, expressed in percentage relative to the mean weight of the landings with the current mesh size, are shown in tables 6 and 7. An increase in the mean weight of the individuals landed in the first year is expected, being higher with the use of 80 mm diamond mesh (10% increases) and with 60 mm square mesh codend (13% increase). In the long-term, the mean weight will be higher if 55 or 60 mm square mesh codends are adopted (18 and 25% increase respectively). Table 6 – Change in the mean weight relative to status quo (55 mm diamond) in the corresponding year, for male Nephrops (SW and S of Portugal) Mean weight (% change) Mesh size (mm) - shape First year Second year Third year Fourth year Longterm (2016) 70 – Diamond 3.9 4.4 5.7 5.4 5.2 80 – Diamond 9.7 11.1 11.9 13.5 14.8 45 – Square 4.7 6.1 8.0 8.5 8.9 50 – Square 7.1 8.5 11.6 11.9 12.7 55 – Square 9.5 11.4 14.7 16.1 17.9 60 – Square 12.7 15.2 19.4 21.8 24.9 When using sorting grids with diamond mesh sizes, mean weight is expected to attain the highest value with 70 mm grid combined with 65 mm diamond mesh codend. In the first year the increase is around 8% and 12% in the long-term. 19 Table 7 – Change in the mean weight relative to status quo (55 mm diamond) in the corresponding year, for male Norway lobster (SW and S of Portugal) Mean weight (% change) Grid - mesh size (mm) - shape G60 G65 G70 First year Second year Third year Fourth year Long-term (2016) 55 Diamond 3.1 3.4 4.7 4.6 4.5 60 Diamond 3.9 4.3 5.6 5.6 5.4 65 Diamond 5.3 5.6 7.4 7.1 7.4 55 Diamond 4.1 4.8 6.5 6.2 6.2 60 Diamond 5.2 5.6 7.7 7.2 7.5 65 Diamond 6.2 7.2 8.3 8.8 9.0 55 Diamond 5.7 6.8 8.4 8.6 8.7 60 Diamond 6.4 7.4 8.9 9.4 9.8 65 Diamond 7.7 8.4 9.9 10.9 11.7 CONCLUSIONS The long-term yield and biomass estimated in the present study are lower then those obtained by Cardador (1993) by increasing codend mesh size to 70 and 80 mm (diamond). In the former study the long-term benefits estimated were 12% and 18% for landings and 31% and 57% for SSB, respectively, with diamond mesh codends of 70 and 80 mm. These differences are mainly due to the reference year and to the methodology used. In Cardador (1993) the reference year corresponded to the average for the period 1984-1990 and the method applied was the length cohort analysis. Although the values were different the same conclusion was drawn, the improvement in the exploitation pattern provide benefits both in the yield and in the stock biomass of Nephrops. According to the results of the present study it is clear that the adoption of a square mesh would be more beneficial for the stock, although the immediate losses in landings are high. Future simulations should consider the joint effect of fishing effort reductions and technical measures taking into account the multispecies context resulting from the fact that Nephrops is part of a multispecies crustacean fishery where some fish species constitute a valuable byproduct. 20 Acknowledgments: This study was performed under the Sixth Framework Programme (6FP), Priority 8, EFIMAS Project - Operational Evaluation Tools for Fisheries Management Options and NECESSITY NEphrops and Cetacean Species Selection Information and TechnologY. References Abad, E., Artetxe, I., Cardador, F., Casto, J., Duarte, R., Garcia, D., Hernández, C., Marín, M., Murta, A., Punzón, A., Quincoces, I., Santurtún, M.,Cilva, C. and Silva, L. 2007. Identification and Segmentation of Mixed-Species Fisheries Operating in the Atlantic Iberian Peninsula waters (IBERMIX project). Final Report. Contract Ref.: FISH/2004/0333, 220 p. Campos, A., Fonseca, P., 2004. The use of separator panels and square mesh windows for bycatch reduction in the crustacean trawl fishery off the Algarve (South Portugal). Fish. Res. 69, 147–156. Campos, A., Fonseca, P., Fonseca, T., Parente, J., 2007. Definition of fleet components in the Portuguese bottom trawl fishery. Fish. Res. 83, 185-191. Cardador, F. 1993. Norway lobster (Nephrops norvegicus) from the Southwest and South of Portugal - estimation of the effects of changing trawl mesh size and fishing effort by length cohort analysis. Fish. Res. 17: 259-271. Fernandes, A.C., Barbosa, S., Silva, D., Pestana G., 2007. Composição dos desembarques e das rejeições por espécie da frota portuguesa de arrasto de fundo. Relat. Cient. Téc. IPIMAR, Série digital (http://ipimar-iniap.ipimar.pt), nº 46, 38 pp + anexos. Fonseca, P., Campos, A., Mendes, B., Fonseca, T. (in press). Desenvolvimento de grelhas selectivas no arrasto para crustáceos: um contributo para a pesca responsável. X Jornadas Técnicas de Engenharia Naval, Novembro de 2006. Fonseca, P., Campos, A., Millar, R. B., 2007. Codend selection in the deep-water crustacean trawl fishery in Portuguese southern waters, Fish. Res. 85, 49-60. Fonseca, P., Campos, A.,Larsen, R.B., Borges T.C., Erzini, K., 2005. Using a modified Nordmøre grid for by-catch reduction in the Portuguese crustacean-trawl fishery. Fish. Res. 71, 223–239. 21 ICES, 1997. Report of the ICES Advisory Committee on Fishery Management 1997. ICES Coop. Res. Rep., 223. ICES, 2002. Report of the ICES Advisory Committee on Fishery Management, ICES Coop. Res. Rep., 255. ICES, 2006a. Report of the Workshop on Nephrops Stocks (WKNEPH). ICES CM 2006/ACFM:12, 81p. ICES, 2006b. Report of the Working Group on the Assessment of Southern Shelf Stocks of Hake, Monk and Megrim (WGHMM). Bilbao, Spain, 9 - 18 May 2006. ICES CM 2006/ACFM:29, 800 p. ICES, 2006c. Report of the ICES Advisory Committee on Fishery Management, Advisory Committee on the Marine Environment and Advisory Committee on Ecosystems, 2006. Book 7 - Bay of Biscay and Iberian Seas. ICES ADVICE 2006. INE, 2006. Estatísticas de Pesca 2005. Instituto Nacional de Estatística, Lisboa. STECF/SGMOS, 2004. Recovery plans of Southern hake and Iberian Norway lobster stocks. Lisbon, 9 – 13 June, 2003. SEC(2004) 178 pp. 22 ANNEX – CP 2 – PACKAGE IN R #===================================================================== # Function: cp2 # Date: 21/Sep/2005, 17/Jan/2007 # Version: 0.6beta # Authors: Ernesto Jardim ([email protected])&Manuela Azevedo ([email protected]) # License: GPL2 (http://www.gnu.org/licenses/info/GPLv2.html) # Short description: function for stochastic projections # # Data: output from VPA # # Parameters: ToDo # # Flags: ToDo # # Results: Stochastic quantiles of SSB, Y, F, R and B # # References (bibtex): # # Function Arguments # data A data.frame with the following columns: # N population numbers # CVN N coeficient of variation # f fishing mortality # CVf f coeficient of variation # m natural mortality # om maturity ogive # wmeds stock weigth at age on the stock # wmedc catch weigth at age on the catch # year0 input data year # seed seed for randomization # nsim number of simulations # ysim number of years to project (excluding year 0) # frange age range for Fbar estimate (in vectors cells not in absolute age) # fmult vector of F multipliers that define the F strategy (it is applied to F status quo) # Rbar Recruitment # Rcv Recruitment variation in CV # CVf F variation in CV (vector at age) # CVN N variation in CV (vector at age) # ATTENTION #1: The f vector can not have 0 values due to log-transform, replace 0 by a small figure like # 0.001. # 2: CVN > 0.5 can cause negative values for the population due to assumed Gaussian randomisation. #3: frange must be defined by the age index in the vector, p.e. for Hake frange=c(3:6) since the age range is from ages 0 to 8 and Fbar is from ages 2 to 5. #============================================================= cp2 <- function(data, frange, fmult, Rbar, f=data$f, sim.ctl, st.ctl) { names(data) <- c("N","CVN","f","CVf","m","om","wbars","wbarc") ddata <- dim(data) #N N <- data$N Ncv <- st.ctl$N$CV Nrfun <- st.ctl$N$rfun Ntr <- eval(call(st.ctl$N$trans, N)) Nrnd.call <- call(Nrfun, ddata[1], Ntr, abs(Ntr*Ncv)) #f f <- f fcv <- st.ctl$f$CV 23 frfun <- st.ctl$f$rfun ftr <- eval(call(st.ctl$f$trans, f)) frnd.call <- call(frfun, ddata[1], ftr, abs(ftr*fcv)) #R R <- Rbar Rcv <- st.ctl$R$CV Rrfun <- st.ctl$R$rfun Rtr <- eval(call(st.ctl$R$trans, R)) Rrnd.call <- call(Rrfun, 1, Rtr, abs(Rtr*Rcv)) #m m <- data$m if(!is.null(st.ctl$m$rfun)){ mcv <- st.ctl$m$CV mrfun <- st.ctl$m$rfun mtr <- eval(call(st.ctl$m$trans, m)) mrnd.call <- call(mrfun, ddata[1], mtr, abs(mtr*mcv)) } else { mrnd.call <- call("c", m) } # om om <- data$om if(!is.null(st.ctl$om$rfun)){ omcv <- st.ctl$om$CV omrfun <- st.ctl$om$rfun omtr <- eval(call(st.ctl$om$trans, om)) omrnd.call <- call(omrfun, ddata[1], omtr, abs(omtr*omcv)) } else { omrnd.call <- call("c", om) } # wbars ws <- data$wbars if(!is.null(st.ctl$ws$rfun)){ wscv <- st.ctl$ws$CV wsrfun <- st.ctl$ws$rfun wstr <- eval(call(st.ctl$ws$trans, ws)) wsrnd.call <- call(wsrfun, ddata[1], wstr, abs(wstr*wscv)) } else { wsrnd.call <- call("c", ws) } # wbarc wc <- data$wbarc if(!is.null(st.ctl$wc$rfun)){ wccv <- st.ctl$wc$CV wcrfun <- st.ctl$wc$rfun wctr <- eval(call(st.ctl$wc$trans, wc)) wcrnd.call <- call(wcrfun, ddata[1], wctr, abs(wctr*wccv)) } else { wcrnd.call <- call("c", wc) } # "***** init simulation *****" seed <- sim.ctl$seed nsim <- sim.ctl$nsim ysim <- sim.ctl$ysim year0 <- sim.ctl$year0 sq.res <- array(NA, dimnames=list(stockquant=c("B", "SSB", "R", "Y", "F"), year=(year0):(year0+ysim-1), sim=1:nsim), dim=c(5,ysim,nsim)) np.res <- array(NA, dimnames=list(ages=rownames(data), year=(year0):(year0+ysim-1), sim=1:nsim), dim=c(ddata[1],ysim,nsim)) # catch in number 24 cn.res <- array(NA, dimnames=list(ages=rownames(data), year=(year0):(year0+ysim-1), sim=1:nsim), dim=c(ddata[1],ysim,nsim)) for(i in 1:nsim) { # allows control over simulations set.seed(seed*i) # randomize N nrnd <- eval(Nrnd.call) # randomize f frnd <- eval(frnd.call) # randomize m mrnd <- eval(mrnd.call) # randomize om omrnd <- eval(omrnd.call) # randomize ws wsrnd <- eval(wsrnd.call) # randomize wc wcrnd <- eval(wcrnd.call) for(j in 1:ysim) { # f strategy frnd <- frnd*fmult[j] # projection np <- cproj(nrnd, frnd, mrnd) # SSB & Co Y <- np$Yend %*% wcrnd B <- np$Nstart %*% wsrnd SSB <- np$Nstart %*% (omrnd * wsrnd) # Results sq.res[,j,i] <- c(B, SSB, nrnd[1], Y, mean(frnd[frange])) np.res[,j,i] <- np$Nstart cn.res[,j,i] <- np$Yend # next year parameters nrnd <- np$Nnext # randomize R Rrnd <- eval(Rrnd.call) nrnd[1] <- Rrnd } } ssb <- apply(sq.res["SSB",,], 1, quantile, probs=c(0.1,0.25,0.5,0.75,0.9)) y <- apply(sq.res["Y",,], 1, quantile, probs=c(0.1,0.25,0.5,0.75,0.9)) b <- apply(sq.res["B",,], 1, quantile, probs=c(0.1,0.25,0.5,0.75,0.9)) f <- apply(sq.res["F",,], 1, quantile, probs=c(0.1,0.25,0.5,0.75,0.9)) R <- apply(sq.res["R",,], 1, quantile, probs=c(0.1,0.25,0.5,0.75,0.9)) Ctot <- apply(apply(cn.res,c(2,3),sum),1, quantile, probs=c(0.1,0.25,0.5,0.75,0.9)) Cmed <- apply(cn.res,c(1,2),median) # ysim=sim.ctl$ysim-1 lst <- list(data=data, sim=sim.ctl, st.ctl=st.ctl, sq=sq.res, np=np.res, cn=cn.res, year0=sim.ctl$year0, ysim=sim.ctl$ysim-1, fmult=fmult, Rbar=Rbar, y=y, ssb=ssb, b=b, f=f, R=R, Cmed=Cmed, Ctot=Ctot) class(lst) <- "cp" lst } cproj <- function(N, f, m, R=N[1]){ # cohort projection nages <- length(N) # project Nend <- vector("numeric", nages) 25 vec <- N * exp(-(f+m)) # cumulate last age Nend[2:(nages-1)] <- vec[1:(nages-2)] Nend[nages] <- sum(vec[(nages-1):nages]) # N start next time lag Nnext <- Nend Nnext[1] <- R # yield Y <- f/(f+m) * N * (1 - exp(-(f+m))) # results list(Nstart=N, f=f, z=f+m, Nend=Nend, Yend=Y, Nnext=Nnext) } # stock precision control object st.ctl <- function( nrfun="rnorm", ncv, ntrans="I", frfun="rlnorm", fcv, ftrans="log", Rrfun="rnorm", Rcv, Rtrans="I", mrfun=NULL, mcv=NULL, mtrans=NULL, omrfun=NULL, omcv=NULL, omtrans=NULL, wsrfun=NULL, wscv=NULL, wstrans=NULL, wcrfun=NULL, wccv=NULL, wctrans=NULL){ lst <- list() lst$N$rfun <- nrfun lst$N$CV <- ncv lst$N$trans <- ntrans lst$f$rfun <- frfun lst$f$CV <- fcv lst$f$trans <- ftrans lst$R$rfun <- Rrfun lst$R$CV <- Rcv lst$R$trans <- Rtrans lst$m$rfun <- mrfun lst$m$CV <- mcv lst$m$trans <- mtrans lst$om$rfun <- omrfun lst$om$CV <- omcv lst$om$trans <- omtrans lst$ws$rfun <- wsrfun lst$ws$CV <- wscv lst$ws$trans <- wstrans lst$wc$rfun <- wcrfun lst$wc$CV <- wccv lst$wc$trans <- wctrans lst } # simulation control object sim.ctl <- function(year0, ysim, nsim, seed){ lst <- list() lst$year0 <- year0 lst$ysim <- ysim lst$nsim <- nsim lst$seed <- seed lst }
Download