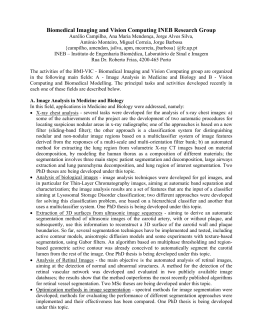
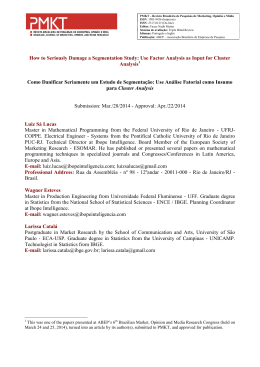
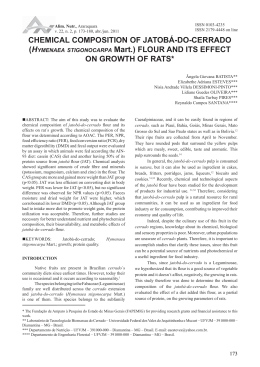
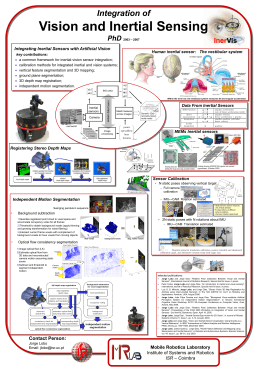
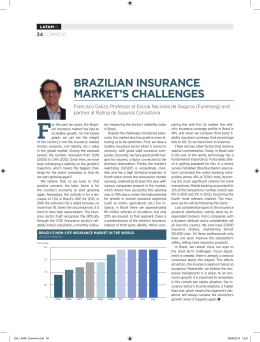
CaS: Collection-aware Segmentation
Raquel Costa
Manuel J. Fonseca
Alfredo Ferreira
INESC-ID/IST/Technical University of Lisbon
Lisboa
[email protected]
{mjf,alfredo.ferreira}@inesc-id.pt
Abstract
Ao longo dos tempos, a segmentação tem provado ser um desafio devido à sua subjectividade. A segmentação
depende não apenas do domı́nio em causa mas acima de tudo da interpretação que os humanos fazem do
objecto. Para cada contexto, diversas soluções especı́ficas foram propostas com diferentes objectivos, limitações e
vantagens. Neste trabalho propomos ultrapassar algumas dessas limitações usando o algoritmo de segmentação
Collection-aware Segmentation (CaS). Este algoritmo identifica segmentos de objectos em colecções baseados na
sua individualidade nessa colecção. Para esse efeito realizámos um conjunto de testes para compreender como
as pessoas segmentam objectos numa colecção. A partir dos resultados destes testes desenvolvemos os algoritmos
Adaped-CaS e Geons-augmented CaS. Avaliações experimentais com utilizadores mostraram que a abordagem
proposta produz segmentações com significado para os humanos.
Abstract
Segmentation has always proven to be a challenge because of its subjectiveness. It depends not only of the
application domain but also most on the human interpretation. To each context, several specific solutions were
proposed with different goals, limitations and advantages. With this work we propose to overcome some of those
limitations by improving the Collection-aware Segmentation algorithm (CaS). This algorithm identifies segments
of objects in collections based on their individuality among the collection in which the objects belong. To that end
we performed a set of tests to understand how humans segment a collection of objects. From the results of these
tests we developed the Adaped-CaS and the Geons-augmented CaS algorithms. Experimental evaluation with users
revealed that our approach produces a segmentation that is meaningful for humans.
Keywords
3D Object Segmentation, 3D Object Collections, Automatic Segmentation, Similarity Estimation
1. Introduction
Each human being interprets the environment from his own
point of view. This generates an huge range of possible interpretations of the world, and his components. Thus, segmentation of objects may vary from individual to individual. Indeed, it and has been subject of studies in different
areas, from mathematics to philosophy.
Over the past decades object segmentation has been also
tackled within the computer graphics domain, as a result
of the growing number of 3D objects in digital format and
the widespread of applications that use them. Many computer graphics applications, as animation, collision detection, object indexing and retrieval use the segmentation approaches as a stage of the core process. However, most of
the existing object segmentation techniques are domain or
context dependent. These perform well in the domain and
context for which they were designed for, but not so good
in other domains or contexts.
To overcome this limitation we adopt a different approach
that extends the Collection Aware Segmentation (CaS)
method. This was originally proposed in [Ferreira 09] embedded in a solution for indexing and retrieval of 3D objects. In this paper we extend CaS to make it a stand-alone
segmentation technique that produces meaningful results
to the users, independently of the object domain.
With the present work we isolated the CaS approach
of the indexing and retrieval application, thus creating a segmentation algorithm that is application independent.
As the original CaS approach, the
Adapted CaS is based on the Hierarchical Fitting Primitives [Falcidieno 06] algorithm and uses Spherical Harmonics shape descriptor [Kazhdan 03]. By adding geon
analysis [Biederman 87], we improved the algorithm,
achieving better segmentation, closer to human perception.
To evaluate the proposed approach, we conducted an experimental evaluation where several tests were performed.
The first test focusing on understanding how humans segment 3D objects. From the results of this test we devel-
Figure 1. Two different types of segmentation: a) Part Based Segmentation; b) Surface Based Segmentation. (Figure taken
from [Shamir 08])
oped and refined our approach. Then, to evaluate the efficacy and effectiveness of the approach we executed performance tests to study execution time and memory requirements. Finally, to validate the quality of the segmentation, we organized a test where users where asked to compare the results of manual segmentation made by humans
with results produced automatically by segmentation algorithms.
In the remaining of this document we start with a brief presentation of related work on three-dimensional object segmentation. Then we describe the original Collection Aware
Segmentation algorithm, followed by its evolution and the
explanation on detail of how these work. On section 4 we
describe the evaluation tests and discuss the corresponding
results. In the last section, we present the conclusions of
this work and reflect on future research paths on this topic.
2
2.1
Related Work
Categorization of segmentation approaches
Some authors [Agathos 07, Shamir 08] classify the segmentation techniques in two categories depending on the
kind of segmentation accomplished, represented in Figure 1. The part based segmentation is closer to user perception and divides the object into sub-components, while the
surface based segmentation are accomplished by analysing
the surface shape features.
Among these two types, the 3D object segmentation has
been widely studied and different solutions that uses distinct approaches have been proposed. Some of the existing
and more relevant are presented next.
2.2
Region Growing and Clustering
The region growing methodology follows a exploratory approach that starts by visiting a seed (a face of the mesh),
then agglomerates the adjacent faces by transversing the
mesh and it stops when it reaches a stop condition. Such
Figure 2. Hierarchical decomposition with
fuzzy area represented in red. (Figure taken
from [Katz 03])
condition can be the segment convexity. Then the process
is restarted using a non visited face as a new seed. The
approach proposed by Zuckerberger on [Zuckerberger 02],
uses a depth first or breadth first search to transverse a
graph that represents the mesh and the seed where it starts
is a node of this graph. From this transverse is creates a
segment and then, it restarts transversing on an unvisited
node of the graph forming a new segment.
In a similar way, Attene et al. [Falcidieno 06] approach
also agglomerates faces, but instead of creating patch by
patch, it creates all patches simultaneously. These are organized as an hierarchical tree in which the leafs are the
mesh triangles and the root is the entire object. This tree
is built bottom to top and clusters adjacent faces with the
minimum merging cost that can be calculated on different
ways. Attene et al. uses primitives by fitting them to the
resultant cluster.
Previously, Katz and Tal [Katz 03] had proposed to generate, in an iterative clustering, various results of segmentation given a number of clusters, and then chooses which is
the best segmentation. It starts by creating a representative
group of clusters and then each adjacent face is clustered
until it reaches a ray r between the seed and the limit of
the patch. This is used to agglomerate the faces that have
more probability of belonging to a given segment, thus creating fuzzy areas, illustrated Figure 2. Lastly it is needed
to transform the fuzzy decomposition in a final decomposition by refining the limits.
2.3
Skeleton Based
This approach uses the skeleton of the object to determine the segmentation. The most used method to extract
the skeleton is the Reeb Graph. For instance, Tierny et
al. [Tierny 07] extract an enhanced topological skeleton by
finding feature points located on object extremities using
the geodesic distances. These are used to create a function
that indicates the distance from a given point of the mesh to
each feature point of the mesh and from there is built the
Reeb graph. After having the skeleton, the object is seg-
mented in the areas where each skeleton node corresponds
to a segment of the object.
2.4
Geometry and Structure-Based
The Taylor and Plumber algorithms, by Mortara
et.al. [Mortara 03] uses the object shape to perform
segmentation based on geometry and structure. These
algorithms detects tubular features by blowing bubbles
that starts on a seed that is predefined and stops blowing
when it finds an abrupt change on the object shape, such
as a bifurcation. Later, Mortara et al. [Mortara 06] used
the Plumber approach to find the tubular zones in objects
that represents the human body.
2.5
Feature Points and Core Extraction
In an attempt to overcome the pose invariant limitation a
new approach arises called Feature Points and Core Extraction that was proposed by Katz et al. in [Katz 05]. This
initially creates a pose invariant representation of the object, then extracts the feature points and the core. After
finding the core it is necessary to extract the rest of the
segments which is done by matching each part to the feature points. In the end, it reverse the initial process so the
object can come back to the same shape.
2.6
SDF
A different approach was proposed by Shapira et al.
in [Shapira 08]. They use the shape diameter function
(SDF) for segmenting objects. In short, this gives the diameter of an object in a neighbour of a point and is used to
merge points that have the same or close diameter values
using a histogram.
2.7
Automatic Segmentation of 3D Collections
The above referred approaches, as most existing approaches, segment 3D objects individually. The segmentation is performed object by object individually, instead of
segmenting various objects simultaneously. Indeed, this is
a relatively recent concept: to accomplish automatic simultaneous segmentation of sets of objects. The approaches
that use the automatic segmentation of 3D collections use
the information of similar objects to improve the results.
The group of Thomas Funkhouser in Priceton is one of the
groups that is already studying this subject. They presented
an algorithm [Golovinskiy 09] that builds a graph whose
nodes represents the mesh faces and the edges represents
the edges of the mesh that connects adjacent faces of the
same object. They also represent the correspondence between the faces of different meshes. In the next step the
algorithm executes a hierarchical clustering of the graph,
were the adjacent faces of the same model, and the correspondent faces of different models are going to probably
belong to the same segment.
2.8
Discussion
Several segmentation approaches have emerged as decomposition of 3D objects as is used in many different applications in distinct domains that require different segmentations. This also makes the task of evaluating the approaches hard to perform, due due the large number of
approaches. Nevertheless, Funckhouser and his team defined a benchmark for 3D mesh segmentation [Chen 09],
compared seven mesh segmentation algorithms and draw
some interesting conclusions.
However, a common limitation is the need of inputs provided by the users in order to decompose the objects. Some
need to predefine the seeds like in Region Growing and Iterative Clustering Approaches. Others to select the level
of the hierarchy generated by the segmentation approach,
these are all the approaches that produce a hierarchical segmentation. The result of the segmentation has more segments that it should have producing over segmented result.
Some approaches try to overcome this limitation by using
post-processing stage that removes the extra segments by
merging them to others or by initially predefining a maximum number of segments.
The individual segmentation of objects can be considered
a limitation if we consider segmenting a collection of objects. If the segmentation decomposes object by object as
it is in the major approaches, then it can take more time to
decompose the entire collection than if segmentation was
performed simultaneously.
In order to overcome the limitations highlighted above, we
propose a different solution based on the CaS algorithm,
presented in the next section. This is a segmentation approach that will be application independent.
3
Collection-aware Segmentation
In this section we present a distinct approach for segmenting 3D objects whose main goal is to overcome some
limitations found on existing approaches. We extracted
the Collection-aware Segmentation (CaS) algorithm from
the indexing and retrieval context where it was embedded [Ferreira 09], as a step of a complete solution, and
extended it to a fully fledged 3D object segmentation algorithm. This led to the original CaS and to the evolution
for Geons-Augmented CaS.
3.1
Original CaS for Retrieval
The original CaS, integrated in a retrieval solution, did not
indeed produced any object segmentation per se. Instead, it
decomposes all objects in a collection and stores their subparts in a shape pool, used then for indexing the collection.
This approach, depicted in Figure 3 has two main stages:
the initialization stage and the iteration stage. In the first
stage the foundations of the segmentation are computed
and loaded into memory, while in the following stage the
objects of the collection are iteratively segmented into subparts.
The initialization starts by generating, for each object on the collection the respective hierarchical segmented mesh (HSM) using the Hierarchical Fitting Primitives (HFP) as proposed by Attene et al. [Falcidieno 06].
This approach consists on merging clusters and then fitting
them to primitives to create the final clusters. Next it saves
the resulting HSM on the HSM Set, producing a set of segmented meshes. Then is computed for each mesh, the ob-
Observing figure 6 is possible to visualize that after adding
theexecution,
HSM nodesthe
to iteration
the NDL the
initialization
stage
ends, so
During the
stage
traverses the
HSMs,
it passes to the next stage, the iteration stage. This will use
level by level, that is, each new iteration corresponds to a
all the structures previously built.
level on the hierarchy. In order to support the segmentation,
the iteration
stage
uses the NDL.
In practice,
each iteration
During
the execution,
the iteration
stage traverses
the HSMs,
of the stage
anlevel,
iteration
to each
the NDL.
So, thiscorresponds
stage starts
levelisby
that is,
new iteration
to a
on the first
of the NDL
and to
verifies
if the
is decomposlevelelement
on the hierarchy.
In order
support
segmentation,
the iteration stage uses the NDL. In practice, each iteration
able or not.
of the stage is an iteration to the NDL. So, this stage starts
mbedded
the first element
of the
the CaS/HFP
NDL and verifies
if is the
decomposa step of Like was on
previously
referred,
segments
obable
or
not.
egmenta- jects based on the collection where they belong. The figure 7
l solution represents the steps for labeling a segment as decomposable
Like was previously referred, the CaS/HFP segments the obor not. It
first
verifies
has reached
triangle
jects
based
on theifcollection
wherethe
theyminimal
belong. The
figure 7
count byrepresents
calculating
the minimal
number
of triangles
bethe steps
for labeling
a segment
as decomposable
egmenta- tween both
childIt nodes
and compares
this the
minimal
with
a
or not.
first verifies
if has reached
minimal
triangle
nderstand previously
defined
value the minimum
triangle
in thisbecount
by calculating
the minimal
numbercount,
of triangles
essary to case thistween
child nodes
compares
this minimal
with a
valueboth
is three,
if the and
minimal
is bellow
the minince one of mum triangle
previously
defined
value theisminimum
triangleifcount,
in this
count
the segment
decomposable
is above
age (CaS)
this value
is three,
if the
minimal is bellow
minithen the case
segment
is labled
as non
decomposable.
Thisthe
step
and also
mum triangle count the segment is decomposable if is above
prevents from reaching the triangles of the mesh.
se of the
then the segment is labled as non decomposable. This step
Figure
4: Overall
architecture
of of
the
original
CaS,
prevents
reaching
the triangles
the
mesh.
s that are
Figure
3. from
Overall
architecture
of
the
original
casethe
of the
being
no, it passes
to
the
next step
with
tworesult
stages
(Initialization
and
Iteration).
ose of the In the
CaS,
with thethe
two
main
stages:
initialization
the
K-Within
(K-WR).
Thisstep
In execution
the case of of
result
being no,Range
it passes
to the next
ments re- that is the
and
iteration.
algorithm
is
used
to
verify
if
a
segment
is
singular,
for that
that
is
the
execution
of
the
K-Within
Range
(K-WR).
This
and other
it
was
previously
defined
two
thresholds,
the
similarity
and
algorithm
is
used
to
verify
if
a
segment
is
singular,
for
that
rent, this
stages,
thethresholds.
initialization
stage
where
the inputs
oftothe
iterit was
previously
defined
two
thresholds,
similarity
and
similar
count
The
first
threshold
is the
used
verify
ation
stageare
are similar
computed
and
saved
thenthe
passes
toverify
the
similar
count
thresholds.
The
threshold
is
used
to
if two
objects
or not,
tofirst
be and
similar
distance
iteration
where
segmentation
is actually
executed.
if twostage
objects
are
similar
or not,
tospace
be
similar
ject
signature
thethe
spherical
harmonics
shape
descripof two
objects
onusing
the
multidimensional
has
tothe
bedistance
less
has reached the end of the NDL and the NSL is empty,
meaning that there are no more segments to be decomposed.
So, the approach ends by returning the entire collection of
decomposed objects.
Figure 4. Overall architecture of Adapted
Figure
Overall
architecture
adapted
CaS, with
CaS,5:with
the new
NDL andof
NSL
structures.
the
two
stages(Initialization
and
Iteration).
Figure 5: Overall architecture of adapted CaS, with
the two stages(Initialization and Iteration).
Model
Collection
Model
Collection
Initialization
Initialization
HSMs
HSMs
Signatures
Signatures
NDL
NDL
Iteration
Iteration
of two objects on the multidimensional space has to be less
tor (SHA)
introduced
by Kazhdan
et al. [Kazhdan
03].segThe
similar
threshold,
this is computed
using the
d in 4 the themAsthe
them the similar
threshold,
computed Decomposer
using the segrepresented
on figures
5 and this
6 theisCaS/HFP
resulting
signatures
are
stored
in
the
shape
pool
for
further
ments
signatures
and
the
distance
between
them.
Then,
on where
signatures
thecollection
distance of
between
startsments
by receiving
theand
entire
objectsthem.
on theThen,
inisecond
is used so
when
comparing a segment
and loaded. the processing.
thethreshold
second
used
so when
a segment
tialization
stage.threshold
On thisisstage
for
each comparing
object it computes
all respective
the segments
that are
onare
theonshape
pool,
it the
cannot
f the col- withthe
all the
segments
that
the
shape
pool,
it cannot
Hierarchical
Segmented
Mesh
using
Hierthewith
iteration
stage,
each
signature
on
thecount
shape
pool
is
haveIn
more
similar
segments
than
the
similar
threshhave
more
similar
segments
than
the
similar
count
thresharchical
Fitting
Primitives
this
generates
a
binary
tree
that
verified
for
its
uniqueness,
thus
being
flagged
for
decomold.this
With
this
it
is going
to verify
if the
segment
old. isWith
result
itresult
is It
going
toonverify
if the
segment
is is
built
bottom
to top.
starts
the
leafs
that
represents
position.
This
means
thatnumber
ifthen
the number
number
similar
elements
singular,
to
be
the
ofofsimilar
to be
singular
the
of each
similar
segments
hashas
el Collec- singular,
the triangles
of
thesingular
mesh,
for
pairs
ofsegments
neighbors
to be
above
the similar
count,
ifisisconsidered
that
the case,
then
the
HSM) us- to be
isitbelow
athe
pre-defined
threshold,
itthat
as
unique,
above
similar
count,
if is This
the case,
then
theby
calculates
the
merging
cost.
cost
is calculated
segment
is
labeled
as
decomposable.
If
not,
it
labels
as
not
approach segment
is alabeled
as (cylinder,
decomposable.
Ifisnot,
it labels
astonot
thus
decomposable.
This similarity
computed
using
the
fitting
primitive
cone, sphere
and
plane)
the
decomposable.
them to decomposable.
resulting cluster,
then
it compares
the values and clusters
differences
between
object
signatures.
the HSM
the pairs
less
cost. being
This new
cluster generated
If thethat
resulthave
is the
segment
decomposable,
then it is
Iffrom
the
object
is decomposable,
then
it is
decomposed
by
exsignature If the
result
istothe
segment
being
decomposable,
then
itclusis
the clustering
are saved
a parent
node
these
going
decompose
it,
forasthat,
it goes
to ofthe
respective
resents a going
ploring
the
corresponding
HSM
on
the
HSM
Set
and
getters,
in
theand
tree.
It
repeats
the
process
until
it
reaches
the
to HSM
decompose
it,
for
that,
it
goes
to
the
respective
get his child nodes. After having the child nodes,
ject with HSM
top
ofit the
three
where
it
is saved
the
entire
object.
This
tree
and
get
hisnodes,
child
nodes.
After
having
the
child
nodes,
ting
its
child
computing
their
signatures
and
adding
calculates
their
respective
signatures,
adds
them
to
the
will be
during
the
iteration
stage
and Segmented
contains
signature
pool
and
insert
both
nodes
on
the
Non
it calculates
their
respective
signatures,
them
to the
them
to transversed
the
Shape
Pool.
If the
object
isadds
not
decomposable,
segments
arelist
going
to bethe
important
for
theare
List
(NSL),
this
contains
segments
that
going
signature
pool
and
insert
both
nodes
on
the Non
Segmented
itthe
passes
to
thethat
next
element
on the
shape
pool.
Theresult.
iterwhere for
tocomputing
bethis
processed
on the
next
iteration
and
removes
the
proAfter
these
trees,
the
initialization
stagegoing
saves
Listation
(NSL),
list
contains
the
segments
that
are
stage
finishes
whenthe
there
arepassing
no more
fy if it is
cessed
element
from
NDL
to decomposable
the next
on the
HSM
to bethem
processed
on
theSet.
next iteration
and removes
the element
pros unique,
segments
onNDL
the shape
pool
the algorithm
re-of
on the
that also
willand
be processed.
Also ends
in theby
case
cessed element from the NDL passing to the next element
m on the
thedecomposition
result
being
notalgorithm
the
decomposable
it
passes
to
the next
As
the
is
based
on
the
singularity
turning
the
entire
shape
pool.
Indeed,
it
does
not
produce
NDL thatonalso
processed. Also in the case of
the will
NDL.be step
ted using on the
of anelement
object.
The
second
of the
initialization
segmented
versions
ofdecomposable
the objects
in itthe
modeltocollection.
being
not
the
passes
thestage
nextis
cts. If the the result
to compute the SHA signatures of each object. These are
on the
NDL.ends when it reaches the end of the NDL but
iteration
going to element
shapeAn
descriptors,
thatfor
is, Decomposition
a numerical representation of the
3.2
Adapted
CaS
the iteration stage may ended or not. This depends on the
the child
object in a multidimensional space. Using these represenNSL,ends
if the
NSL is it
notreaches
empty
itthe
means
that
are new
segments
iteration
when
endin
ofa the
NDL
but
putes the An To
produce
segmentations
for between
objects
collection,
we
tations
makes
the comparison
segments
easier
and
to be stage
processed.
So,
it appends
allThis
the elements
onon
thethe
NDL,
iteration
may
ended
or
not.
depends
air on the the adapted
this comparison
is used
a segment asAs
decomposable
the original
CaSto
forlabel
decomposition.
in the origthe NSL is
not empty
it means finishes
that arebeing
new segments
it passes NSL,orifnot.
when
each consists
signatures
computed,
inal, theAlso
Adapted
CaS
on two main
stages:
the
So,
it
appends
all pool.
the elements on the NDL,
ion stage to beitprocessed.
saves
them
on
the
signature
initialization
and
the
iteration.
These
stages
have
similar
ments on
purpose
to the
those
CaS,
are slightly
the entire
One of the
main
goalsonofthe
thisoriginal
Adapted
CaSbut
technique
is to
different
and
comprise
new
data
structures,
as
in
the final
present the collection of objects decomposed, it depicted
is no longer
Figure
4. to have the Shape Pool, instead this adapted apnecessary
proah uses a Signature Pool, so it is only necessary to visit
The
Adapted CaS decomposer receives as input the entire
sition
this set to label a segment as decomposable or not. This is
collection
on the
stage.
Onwhere
this
also one ofoftheobjects
differences
on initialization
the initialization
stage,
S we now
stage,
forofeach
object,
it computes
therespective
corresponding
HSM
instead
saving
the object
with the
signature
on
ain stages
the shape
saves thea signature
onthat
the is
Signature
Pool
the iterausing
HFP.pool,
This itgenerates
binary tree
built bottom
and
also
without
poolrepresents
there no longer
exists the
me stages
to
top.
It starts
onthe
the shape
leafs that
the triangles
of
second HSM built during the iteration stage instead is used
purpose.
the mesh, then for each pair of neighbours it calculates the
to lists, the Non Segmented List (NDL), that has the next
merging
cost. This
cost
is calculated
by fitting
a primitive
next segments
to be
processed
and the
segments
that are
e figure 6
(cylinder,
sphere and plane)
to the
cluster,
ows both
labeled ascone,
not decomposable
and the
Nonresulting
Segmented
List
then it compares the values and clusters the pairs that have
less cost. This new cluster generated from the clustering
are saved as a parent node of these clusters, in the tree.
It repeats the process until it reaches the top of the three
Decomposed
Decomposed
Object
Object
End
End
Figure6:
6:5.High
High
fluxogram
of of
Adapted
CaSCaS
Figure
level
fluxogram
Adapted
Figure
Highlevel
level
fluxogram
of Adapted
CaS.
3.3 Geons-augmented
Geons-augmented CaS/HFP
Decomposer
3.3
CaS/HFP
Decomposer
During the execution of the Manual Segmentation Test Us-
During
theOne
execution
of the Manual
Test Using HFP.
of the complains
of the Segmentation
users was that some
ingobjects
HFP. were
One over
of the
complains
the users
was that
segment.
Thisofhappens
because
it wassome
where
itwere
isHFP
saved
the
entire
object.
These
stored
in
objects
over
segment.
This
happens
because
it was
used the
approach.
After
executing
the trees,
adapted
CaS
used
the HFP
approach.
After executing
adapted
CaS
approach
withwill
different
similarity
and
similar
count
threshthe
HSM
set,
be transversed
during
thethe
iteration
stage
we notice
that
this similarity
problem
still
this threshap- an
approach
with
andhappens
similar5on
count
toolds
produce
thedifferent
decomposed
objects.
Figure
presents
proach,
so, to overcome
this
limitation
ithappens
was introduced
a
olds
we
notice
that
this
problem
still
on
this
high
level fluxogram
of the decomposition
process.if an apnew feature.
introduction
of the geons
to verify
proach,
so, to The
overcome
this limitation
it was
introduced a
objectthe
is decomposable
or not.
Since
decomposition
algorithm
is based
singunew
feature.
The introduction
of the
geons on
to the
verify
if an
larity of
an
object, the second
step of the initialization stage
object
is
decomposable
or
not.
The geons are simple 3D objects, like cylinders, cones, cubes.
isThe
to compute
the SHA
signaturesonof[4]each
object.
These
theory proposed
by Bieldman
called
”Recogni-
The
geons
are
simpleTheory”
3D
objects,
likethat
cylinders,
cones,
cubes.
are
shape
descriptors,
that
is,defends
a numerical
of
tion
by Components
likerepresentation
English
words
The
theory
Bieldman
on [4]
called
”Recognithat
are constituted
byby
a number
of
phonetics,complex
obthe
object
inproposed
a multidimensional
space.
Using
these
reprejects
also be composed
by these
simpler
objects,
that
tion
bycan
Components
defends
that3D
like
English
words
sentations
makesthese
theTheory”
comparison
between
segments
easier
is, by
objects
we get these simpler obthat
aresegmenting
constituted
bycomplex
a number
of phonetics,complex
and
this also
comparison
is used to label a segment as decomobjects
jects
can (Figure
be 8).
composed by these simpler 3D objects, that
posable
or
not.
Thus,
computed
signature
is stored
on
is, by segmenting theseeach
complex
objects
we get these
simpler
the
signature
pool
for
later
use.
objects (Figure 8).
The main goal of this Adapted CaS technique is to present
the collection of objects decomposed. Thus the shape poll
is no longer necessary to and was replaced by the Signature
Pool. It is only necessary to visit this set to label a segment
as decomposable or not. Without the shape pool, no longer
exists a second HSM build during the iteration stage. Instead two lists are used: the Non Segmented List (NDL),
that contains the segments to be processed and the segments that are not labeled as decomposable and the Non
Segmented List (NSL) that contains the segments that are
going to be processed on the next iteration. So, at the end
of the initialization stage, the NDL contains all the objects
in the collection.
During its execution, the iteration stage traverses the
HSMs, level by level, that is, each new iteration corre-
NDL
Element
Minimal TriCount
Reached?
K-WR
Singular?
Yes
NO
NO
Yes
Element
Not
Decomposable
End
Element
Decomposable
Figure
7: Decomposition
fluxogram
of adaptedofCaS
Figure
6. Decomposition
fluxogram
Adapted CaS.
sponds to
the hierarchy.
In order to Cone
support the
Archa level onBarrel
Cylinder
segmentation, the iteration stage uses the NDL. In practice,
each iteration of the stage is an iteration to the NDL. So,
this stage starts on the first element of the NDL and verifies
if is decomposable
or not.
Handle
Cube
Ex-Cylinder
Ex-Handle
To segment the objects based on the collection where they
belong, it is necessary to compare each sub-part with all
other sub-parts. Figure 6 illustrates the steps for labelling
Pyramid
Ex-Pyramidas decomposable
Wedge
a segment
or Plan
not. It first verifies
if has
reached the minimal triangle count by calculating the numFigure
8: Example
of both
group
of nodes
geonsand
used
on the
ber
of triangles
between
child
compares
Geons-augmented approach
this with a previously defined value - the minimum triangle count. If the triangle count is below this threshold, the
segment
is flagged
as uses
non-decomposable.
This
step pre-to
As the CaS
approach
the HFP that uses
primitives
vents
from
reaching
the
triangles
of
the
mesh.
calculate the cost of merging clusters and there are some
of case
the Geons
that aretriangle
the same
as have
thesenot
primitives
so, usIn
the minimum
count
been reached,
ing these objects can helps to stop the segmentation when
the element passes to the next step in the decomposition
it find a geon. The Figure 9 represents the decomposition
process.
This
consiststoonthe
thefigure
execution
a K-Withinof
fluxogram
andstep
is similar
7 andofdescription
Range
(K-WR)
search.
This
algorithm
returns
firstcomKsection 3.2 being the main difference after thethefirst
parison, ifwhose
the minimal
triangle
count of
the child nodes
elements
signatures
are within
a predefined
rangeis
above
count predefined,
it comand
is the
usedminimum
to verifytriangle
if a segment
is singular.then
For
that
parestwo
thethresholds
segmentedwere
withpreviously
the entiredefined:
collection
geons by
end,
theofsimilarity
comparing the signature of the segment with each geon sigand similar count thresholds. The first threshold is used to
nature. Then, if it is not similar, it proceeds as the previous
verify
if twothat
objects
similar
not, toInbe
description,
is, it are
executes
theorK-WR.
thesimilar
case ofthe
bedistance
of two
objects
the multidimensional
has
ing similar
to any
of theongeons,
then the segmentspace
is libeled
to
them the similar threshold, this is computed usas be
notless
decomposable.
ing the segments signatures and the distance between them.
Then, the second threshold is used when comparing a segment with all the segmentsNOthat are onNOthe signature pool,
it
Yes
Similar to
NDL
Minimal TriCount
Singular?
Geon?
Element have more
Reached?
cannot
similar segments
than K-WR
the similar
count
threshold. With this result it is
is
NO
Yes verified if the segment
Yes
singular, to be singular the number of similar segments has
Element
to be above the similar
count, if is that the case, then the
Not
Decomposable
segment is labelled as decomposable. If not, it labels as
not decomposable.
Element
End
Decomposable
If the result is the segment being decomposable, then it
is going to decompose it, for that, it goes to the respecFigure
Decomposition
fluxogram
of geons
augtive
HSM9:and
get his child nodes.
After having
the child
mented
CaS
nodes,
it calculates
their respective signatures, adds them
to the signature pool and insert both nodes on the Non Segmented List (NSL), this list contains the segments that are
going to be processed on the next iteration and removes the
processed element from the NDL passing to the next ele-
In order to compare the segments to the geons it is necessary to predefine the best similar values between them.
So, the best values for the similarity thresholds between the
segments and the geons where studied. To compare objects
it is used, as was already referred, the Spherical Harmonics
(SHA). One is that they are not scale invariant, that is, it
takes into account the scale when comparing to objects, using the difference between signatures. So, it was not only
necessary to discover the best similarity threshold for the
usual geons but also a profound study about the different
scales and different smooth variations on the geons to really
overcome this problem of scale invariance.
To overcome this limitation a study was performed on the
cylinder, for that, is was used several different types of cylinders. In Figure 10 are represented the different variations
of cylinders, the first row are the cylinders that are closed
both on the top as on the bottom. The middle row are the
Figure 7. Group of geons used on the Geonscylinders with a hole in the cross the object from one side
augmented
CaS.
(top)
to the other
(bottom) but still has some thickness on
the sides. The last row has the cylinders that are totally
open, without a base or a top. Also the not scale invariance is shown on Figre 10. As this study was only about
ment
on the NDL
will be processed.
Also
in the
the cylinders,
the that
samealso
is necessary
to do for the
remaining
case
of the result being not the decomposable it passes to
geons.
the next element on the NDL.
As one of the primitives used on the HFP is the plane, this
An
iteration
ends
when
reaches
end ofBut
the still
NDLthis
butis
primitive
was
added
to it
the
group the
of geons.
the
iteration
stage
may
ended
or
not.
This
depends
on
one of the main problems of using HFP, using planes, the
this
NSL,
theresults
NSL is
empty it means
that
are new
segmakesifthe
of not
segmentation
in plane
instead
of volume
as it should
be, meaning
the geons
cube does
ments
to be processed.
So,that
it appends
alllike
the the
elements
on
notNDL,
work on
this approach.
a good
to follow
the
remove
them fromThus,
the NSL
andpath
restarts
a newin
the future is to use another hierarchical technique instead of
iteration
by vising again the first element on the NDL.
HFP and make a deeper study of these thresholds.
The iteration stage and the entire algorithm ends when it
has reached the end of the NDL and the NSL is empty,
meaning that there are no more segments to be decomposed. So, the approach ends by returning the entire collection of decomposed objects.
3.3
Cylinder 1
Cylinder 2
Cylinder 3
Geons-augmented CaS Decomposer
During the execution of the manual segmentation test using HFP, one of the complains of the users was that some
objects wereCylinder
over
segment.
This happens
because it was
4
Cylinder 5
Cylinder 6
Cylinder 7
Cylinder 8
used the HFP approach. After executing the adapted CaS
approach with different similarity and similar count thresholds we notice that this problem still happens on this approach, so, to overcome this limitation it was introduced a
new feature. The introduction of the geons to verify if an
object is decomposable
or Cylinder
not.11 Cylinder 12
Cylinder 9 Cylinder 10
The geons are simple 3D objects, like cylinders,
cones, cubes.
The theory proposed by Biederman
on [Biederman 87] called ”Recognition by Components”
Figure
10:like
SetEnglish
of cylinders
usedare
toconstituted
stop fromby
over
states
that,
words that
a
segmenting
number of phonetics, complex objects can also be composed by these simpler 3D objects, that is, by segmenting
4. EXPERIMENTAL EVALUATION
complex
objects we get these simpler objects. Thus we
After completing the approach implementation, it was necadded
a
set
of geons,
partially depicted
in Figureof7,the
to imessary to verify
the efficiency
and effectiveness
algoprove
according
to human
perceprithm decomposition
and refine the results
approach.
So, several
tests were
exetion.
Since the CaS approach uses the HFP that uses primitives
to calculate the cost of merging clusters and there are some
of the geons that are the same as these primitives, using
comparing the signature of the segment with each geon sighas a linear growing and comparatively, the geon augmented
nature. Then, if it is not similar, it proceeds as the previous
Cylinder 4
Cylinder 5
Cylinder 6
Cylinder 7
Cylinder 8
description, that is, it executes the K-WR. In the case ofCaS
be- presents better results than the original CaS. It was also
ing similar to any of the geons, then the segment is libeled
possible to observe that the signatures computation is time
as not decomposable.
NDL
Element
Minimal TriCount
Reached?
NO
Similar to
Geon?
Yes
Yes
NO
K-WR
Singular?
Yes
NO
Element
Not
Decomposable
End
Time (thousand seconds)
consuming and is where most of the time is spent.
12
10
Cylinder 9
Cylinder 10
Cylinder 11
Execution of
Original CaS
Cylinder 12
8
6
4
Execution of
Geons
Figure2 10: Set of cylinders used to stop Augmented
from over
0
segmenting
CaS
Element
Decomposable
4.
60
210
410
610
853
Collection size
EXPERIMENTAL
EVALUATION
After completing the approach implementation, it was necFigure
9: Decomposition
fluxogram
of geonsfor
augessary to verify the efficiency and effectiveness of the algoFigure
8. Decomposition
fluxogram
mented CaS
andGraphic
refine
the approach.
So, several
exeFigure
9. Execution
for tests
bothwere
Figurerithm
11:
with times
the
results
ofap-both
Geons-Augmented CaS.
ap-
regarding collection size
proachesproaches
time test
700
5.2 Memory
requirements
m performance
to Figure
tests 8with
usersthewhere
it
geontests
is found.
represents
decomposition
flux600
CaS
A
similar
study
was
performed to the memoryOriginal
requirements,
sample group
of
twenty
human
beings.
ogram for the Geons-augmented CaS. The process is sim500
as shown in Figure
12 it is used more memory on the geons
400
ilar to the one described in previous section and illustrated
300 than on the original CaS. This happens beaugmented
CaS
in
Figure
6.
The
main
difference
lays
after
the
first
comGeons
NUAL SEGMENTATION
TEST USING
200
parison. If the minimal triangle count of the child nodes
cause it is used
more lists in order to reduceAugmented
the execution
100
CaS
is above the minimum triangle count predefined, then segtime. The memory
is now a days a cheap resource and has
0
are compared
the setbeing
of geons.
This is donebeen
by
was used to ments
understand
thewith
human
inter60 the
210 years.
410
610 having
853
increased over
So,
to spend more
the signaturehow
of thehuman
segment beings
with each precomf an object,comparing
more precisely,
Executed
memory but as a result we
getTesta approach faster and with
puted
geon signature.
if it is not
similar,
e objects. To
execute
this testThen,
collection
used
de-it proceeds
better results to the users is a good trade off between this
as
the
previous
description,
that
is,
it
executes
composed by objects of the Engineering Shape the K-WR
two important
measures.
the case of being similar to any of the geons,
Figure
10. Memory
requirements
for both
Figure 12:
Graphic
with
the results
ofap-both ap(ESB) andsearch.
whereIn randomly
chosen. Where it
then the segment is labelled as not decomposable.
proaches wrt collection size.
proaches memory tests
e to conclude that familar objects are easier to
Memory (MB)
these objects can helps to stop the segmentation when a
4
Experimental Evaluation
6.
CAS EVALUATION WITH USERS
4
2
0
60
210
410
610
853
Execution of
Geons
Augmented
CaS
Amount of user choices
In order to prove the resutls quality, it was performed a test
To validate and evaluate the proposed approach implemen6.0.1users
Original
CaShad
versus
Geons-augmented
that
were
developed
by
implementing
both
approaches.
ItCaS
with
where
they
to compare
pairs
of results.
tation,
we
verified
the
efficiency
and
effectiveness
of
the
this information it was possible to refine the apwas used
of objects
with different
of of the
The users
werecollections
asked first
to compare
theamounts
results
Thus,
teststhe
weresimilarity
organized, from peralso make italgorithm.
automatic
byseveral
defining
objects. It is possible
to conclude
by observing
Figure
9original
geons
augmented
with
the
ones
produced
by
the
formance
tests
to
tests
with
users
which
involved
a
sample
count thresholds. In order to accomplish that,
that
the
time
has
a
linear
growing
and
comparatively,
the
group of twenty people.
CaS. On this test the results produced by Geons-augmented
of the manual segmentation were compared to
geon-augmented CaS presents better results than the origiCaS approach
proved to be more meaningful to the user
4.1 the
Manual
Segmentation Tests
produced by
Geons-augmented
CaS using
nal CaS. It was also possible to observe that the signatures
as
is
shown
on
Figure 13 where most of user chosen both
resholds byThis
comparing
the tonumber
of the
segments
computation is time consuming and is where most of the
test was used
understand
human interpretaresults
or
the
CaS
time is spent. approaches. As shown in Figure 14 the
tion of antoobject,
more precisely,
ng a classification
the results.
The how
test humans
that segment
segmentation result os object 18 produced by the original
the objects.
thatthe
endresult
we used
a small
ave the better
results To
was
that
usedset of ran4.3 Memory requirements
CaS approach
have three more segments than the results
objects
of the
Engineering
Shape Benchty thresholddomly
valuechosen
equals
to 0.58
and
the similar
A
similar
study
was performed
to the
require- result
shown
on
Figure
15 that
represents
thememory
segmentation
mark (ESB) [S.Jayanti 06]. A preliminary conclusion we
1.
ments,
as
shown
in
Figure
10
it
is
used
more
memory
on These
made from this test was that familiar objects are easierofto object 18 using Geons-augmented CaS approach.
the
geons
augmented
CaS
than
on
the
original
CaS.
This
decompose than those people see for the first time. Other
three more segments produce an over-segmentation for the
is used more lists in order to reduce the
cution Time
conclusion was that users segment objects consistently.
user so,happens
this isbecause
one ofit the
objects that all users have chosen
execution
time.
The
memory is nowadays a cheap resource
such conclusions
was not the
the primary
the Geons-augmented CaS
f execution But
wasdraw
obtained
by executing
geons goal of the
approach.
and has been increased over the years. So, having to spend
testsoriginal
and further
studies
should be that
made were
to validate such
CaS and the
CaS
prototypes
more memory but as a result we get a approach faster and
observations.
by implementig
both apporaches. It was used
With this
is users
prove
Geons-augmented
withinformation
better results toitthe
is that
a goodthe
trade
off between
Based different
on the results
obtainedofin objects.
these tests It
it was possiof objects with
amounts
CaS approach,
according
to the users, produces better rethese two important
measures.
refine the approach
andthat
also make
it automatic by
o conclude ble
by toobserving
Figure 11
the time
sults then the original CaS approach.
4.4 Evaluation with users
defining
the
similarity
and
similar
count
thresholds.
In orgrowing and comparatively, the geon augmented
der to accomplish that, the results of the manual segmentaTo prove the results quality, it was performed a test with
ts better results than the original CaS. It was also
120
tion were compared to the results produced by the Geonsusers where they had to compare pairs of results.
observe that
the
signatures
computation
is
time
augmented CaS using different thresholds by comparing
100 were asked first to compare the results of the
and is where
ofofthe
time is
The users
themost
number
segments
andspent.
assigning a classification to
Original CaS
geons 80
augmented with the ones produced by the
original
the results.
CaS. On this test the results produced by Geons-augmented
12
4.2 Execution time
60
CaS approach
proved to be more meaningful toBoth
the user as
10
Execution of
is shown on Figure 11 where most of user chosen both reThe time of execution was
obtained
by executing the
8
Original
CaS
40
6
sults or the geons augmented approaches but Geons
rarely only
Geons-augmented CaS and the original CaS prototypes
20
Augmented
CaS
0
Collection size
Figure 13: Results of comparing original CaS with
d
0
CaS
80
60
Both
40
Geons
Augmented
CaS
Amount of user choices
20
Original CaS
7.
Amount of user choices
of
Amount of user choices
of
S
Amount of user choices
the Geons-augmented
CaS
as is shown on Figure
13 approach.
where most of user chosen both This analysis allow us to conclude that besides having some
segments
have chosen or both results or the geon Augmented CaS. As
duced results.
results
or
the
CaS
approaches.
As shown in Figure 14 the
test that
shown
in Figure
17 the segmentation
os object
proGeons-augmen
objects
where
the segmentation
is result
not the
best18for
the user,
It
segmentation
result
os
object
18
produced
by
the
original
duced by of
thethe
the collection
manual segmentation
has
the same
result
more memory.
that used
With this information it is prove that the Geons-augmented
the
majority
objects
results
have
been
chofer
CaS approach have three more segments than the results
the shown on Figure 18 that represents the segmentation
meaningful res
he similar
CaS approach,
according
to the users,
producesresult
bettersen
re-byasthe
user
as
the
same
or
better
than
the
one
he
chose.
ch
shown on Figure
15 that represents
the segmentation
result of object 18 using Geons-augmented CaS approach.
sults then
the 18
original
CaS approach.
of object
using Geons-augmented
CaS approach. These Proving
quality
approach
results.
Thisthe
is object
hasofin the
particular
nine users
choosing both
Taking into va
ac
three more segments produce an over-segmentation for the
results, five prefered their results and six have chosen the
is necessary ge
on
user so, this is one of the objects that all users have chosen
Geons-augmented CaS approach.
other hierarch
th
120
the geons
from HFP.
the Geons-augmented
CaS approach.
Amout
of
user
choises
that were
This analysis allow us to conclude that besides having some
100
100where the segmentation is not the best for the user,
was used
objects
It seems also
Inp
With this
information it is prove that the Geons-augmented
Original CaS
the majority of the collection objects results have been choferent from to
th
bjects. It
CaS approach,
according
to
the
users,
produces
better
re80
sen by80
the user as the same or better than the one he chose.
characteristics
t the time
sults then the original CaS approach.
sit
Proving the quality of the approach results.
variant, so it i
ugmented
Both
User
60
60
geons as the o
It was also
Both
120
the same geon
on is time
40
40
Geons Aumented CaS
Amout of user choises
Geons
100
.
Augmented
20
0
In the future [w
to be a robust
sition of 3D ob
100
80
60
User
Both
Geons Aumented CaS
7. REFER
[1] A. Agath[
Figure
16:
Results
of
comparing
Current
CaS with
20
11. Users
choice of best
segmensegmentaFigure Figure
13: Results
of comparing
original
CaS with Figure 13. Users choice of best
and P. Az
0
users
segmentation
tation between
original CaS and Geons0
tion between
men-made segmentation and
methodol
Geons Augmented
CaS
augmented CaS.
Design an
Geons-augmented CaS.
[2] M. Atten[
Figure 16: Results of comparing Current CaS with
Figure 13: Results of comparing original CaS with
both ap-
20
Geons Augmented CaS
40
users segmentation
[3]
Figure 14: Object 18
Figure 15: Object 18
uirements,
Figure 18: Object 18
[4]
Figure 17: Object 18
with
a
segmentation
with15:
a segmentation
the geons
Figure 14: Object 18
Figure
Object 18
with
a
segmentation
reFigure
12.
Segmentation
of
an
object
with
the
Figure
18:
Object
18
with
a
segmentation
17: Object 18
ppens besegmentation
with
a segmentation
resultwith
of athe
execuresult
of the execu- Figure
with
a segmentation
result
of
Figure
14.
Segmentation
of the
an execution
object
original
CaSexecu(left) and the geons-augmented
segmentation
resultwith
of athe
execuexecution
result
of the
result
of
the
execu[5]
tion
of
the
original
tion
of
the
Geonssult
of the
execution of
result
of
the
executhe
Geons-augmented
made
humans (left)the
and Geons-augmented
through geonse and has
CaS
tion
of(right).
the original
thebymanual
tion of the Geons- tion of
of the manual
CaS approach
augmented
ap- tion
end more
CaS
approach
CaS approach
augmented
CaS CaS
ap- segmentation
augmented CaS (right).CaS
approach
segmentation
and with
proach
proach
[6]
tween this
the original CaS. As shown in Figure 12 the segmentation
6.0.2 User Segmentation versus Geons Augmented
6.1 of
Conclusion
and Future
WorkWe also improved
the experimental
evaluation.
of an Segmentation
object produced byversus
the original
CaS approach
6.0.2result
User
Geons
Augmented
6.1 results
Conclusion
Future
Work
We
have presented anand
algorithm
that segments
a collection of
CaS
S
time
complexity
comparatively
to thesegments
original
Addi- [7]
has three more segments than the segmentation result using We have
3D
objects
simultaneously.
The
algorithm
produces CaS.
aameanpresented
an
algorithm
that
collection
of
Then
it was asked for the users to compare the results promed a test
CaS
ingful
segmentation
according
to
the
results
of
the
experitionally, the proposed algorithm avoids over-segmentation
Geons-augmented CaS approach. These three more seg-
sults.
duced by the geons augmented CaS with the objects they 3D objects simultaneously. The algorithm produces a meanThen ments
it
wasproduce
asked for
the users to compare
thetoresults
pro-bymental
Also has improved in time and results
usingevaluation.
geons as primitives.
an over-segmentation
according
user’s ingful
segmentation
according to the results of the experi[8]
ducedperception.
by the geons augmented CaS with the objects they comparatively to the original CaS. Finally, the algorithm
From these results we conclude that the Geons-augmented
CaS approach, according to the users, produces better results than the original CaS approach.
Additionally, we asked users to compare the results produced by the geons-augmented CaS with objects manually segmented by humans in a previous test. As shown
in Figure 13, half of the users have chosen their results
while the other half have chosen both results or the geonsaugmented CaS. Indeed, as shown in Figure 14 the segmentation of an object produced by the the manual segmentation has very similar results when performed with
geons-augmented CaS approach.
This analysis allow us to conclude that besides having
some objects where the segmentation is not the best for
the user, the majority of the collection objects results have
been chosen by the user as the same or better than the one
he chose. We can then conclude that manual segmentation
prevails over the automatic segmentation algorithm, but often results are quite similar.
5
Conclusion and Future Work
We presented an extension of the CaS algorithm that segments a collection of 3D objects simultaneously in an automatic manner. The algorithm produces a meaningful segmentation regarding human perception, according to the
mental
evaluation.
Also
has
intest
time
results
avoids
over-segmentation
usingimproved
theingeons.
Different
tests were
performed
order to
theand
efficacy
comparatively
to
the
original
CaS.
Finally,
the
algorithm
and effectiveness of the approach and the quality of the
In order to segment the collection of objects, this algorithm
avoids
over-segmentation
using
the we
geons.
produced
these
have
uses the results.
similarityFrom
between
thetests
segments
that concluded
are on the that [9]
same
collection.
the geons-augmented is faster than the original CaS but
In order
to more
segment
the collection
objects,
this
algorithm
spends
memory.
It was alsoof
clear
that the
presented
The architecture developed is also an important contribuuses solution
the
similarity
between
the
segments
that
are
on the
results
that areapplication
meaningful
for humans.
[10]
tion. In produces
order to make
the approach
independent
sameHowever,
collection.
we consider
that using
a basis
for the defirst was generated
the adapted
CaSHFP
thatas
with
the changes
has make the
approach
faster and then
with
Geons- on
composition
might
be a limitation.
Thus,
it isthe
necessary
augmented approach
it was overcomed
over-segmentation
[11]
The future
architecture
developed
is also the
an
important
contribuwork
to
study
the
possibility
of
using
other
hierarlimitation.
tion.chical
In order
tosegmentation
make the approach
application independent
based
approaches.
first was generated the adapted CaS that with the changes
seemsthe
alsoapproach
promisingfaster
to experiment
otherwith
signature
behas It
make
and then
the Geonssides
the
rotation
invariant
spherical
harmonics
shape
deaugmented approach it was overcomed the over-segmentation
scriptor.
Also,
as
one
of
the
characteristics
of
these
delimitation.
scriptors is that are not scale invariant, it is necessary to
perform a deeper study on the geons to avoid having to use
multiple geons on different scales.
In the future we believe that the proposed approach might
be improved to develop into a robust, stable and scalable
solution for the automatic decomposition of 3D object collections.
6. Acknowledgements
The work described in this paper was partially supported
by the Portuguese Foundation for Science and Technology
(FCT) through the project 3DORuS, reference PTDC/EIAEIA/102930/2008 and by the INESC-ID multiannual fund-
Hierarchi
primitives
M. Atten
B. Falcidi
shapes fo[
Forum, 27
I. Biederm
of human
[
94:115–14
A. Ferreir
M. Spagn
Thesauru
matching
A. Golovi
[
segmenta
(Shape M
June 2009
S. Katz, G
using feat
[
Computer
S. Katz a
using fuzz
ACM SIG
[
York, NY
M. Morta
and J. Ro
analysis a
Algorithm
[
M. Morta
geometric
Computer
G. Reeb.
completem
[1
[1
ing, through the PIDDAC Program funds.
[Mortara 03]
M. Mortara, G. Patane, M. Spagnuolo,
B. Falcidieno, and J. Rossignac. Blowing bubbles for multi-scale analysis
and decomposition of triangle meshes.
Algorithmica, 38(1):227–248, 2003.
[Mortara 06]
M. Mortara, G. Patane, and M. Spagnuolo. From geometric to semantic
human body models. Computers &
Graphics, 30(2):185–196, 2006.
[Shamir 08]
A. Shamir. A survey on mesh segmentation techniques. Computer Graphics
Forum, 27(6):1539–1556, 2008.
[Shapira 08]
L. Shapira, A. Shamir, and D. CohenOr. Consistent mesh partitioning and
skeletonization using the shape diameter function. The Visual Computer,
24(4):249–259, 2008.
[S.Jayanti 06]
S.Jayanti, Y. Kalyanaraman, N. Iyer,
and K. Ramani. Developing an engineering shape benchmark for cad
models.
Computer-Aided Design,
38(9):939–953, 2006.
[Tierny 07]
J. Tierny, J.-P. Vandeborre, and
M. Daoudi.
Topology driven 3d
mesh hierarchical segmentation. In
International Conference on Shape
Modeling and Applications, pages
215–220, 2007.
References
[Agathos 07]
A. Agathos, I. Pratikakis, S. Perantonis, N. Sapidis, and P. Azariadis. 3d
mesh segmentation methodologies for
cad applications. Computer-Aided Design and Applications, 4(6):827–841,
2007.
[Biederman 87]
I. Biederman.
Recognition-bycomponents: A theory of human
image understanding. Psychological
Review, 94:115–147, 1987.
[Chen 09]
Xiaobai Chen, Aleksey Golovinskiy,
and Thomas Funkhouser. A benchmark for 3D mesh segmentation. ACM
Transactions on Graphics (Proc. SIGGRAPH), 28(3), August 2009.
[Falcidieno 06]
M. Atteneand B. Falcidieno and
M. Spagnuolo. Hierarchical mesh segmentation based on fitting primitives.
Visual Computer, 22(3):181–193,
2006.
[Ferreira 09]
A. Ferreira, S. Marini, M. Fonseca
M. Attene, M. Spagnuolo, J. Jorge, and
B. Falcidieno. Thesaurus-based 3d object retrieval with part-in-whole matching. International Journal of Computer
Vision, 2009.
[Golovinskiy 09] A. Golovinskiy and T. Funkhouser.
Consistent segmentation of 3d models.
Computers & Graphics, 33(3):262–
269, 2009.
[Katz 03]
S. Katz and A. Tal. Hierarchical mesh
decomposition using fuzzy clustering
and cuts. In ACM SIGGRAPH 2003
papers, pages 954–961, NY, USA,
2003. ACM.
[Katz 05]
S. Katz, G. Leifman, and A. Tal. Mesh
segmentation using feature point and
core extraction. The Visual Computer,
21(8–10):649–658, 2005.
[Kazhdan 03]
Michael
Kazhdan,
Thomas
Funkhouser,
and
Szymon
Rusinkiewicz.
Rotation invariant
spherical harmonic representation of
3d shape descriptors. In Proceedings of the 2003 Eurographics/ACM
SIGGRAPH symposium on Geometry
processing, SGP ’03, pages 156–164,
Aire-la-Ville, Switzerland, Switzerland, 2003. Eurographics Association.
[Zuckerberger 02] E. Zuckerberger.
Polyhedral surface decomposition with applications.
Computers and Graphics, 26(5):733–
743, 2002.
Download