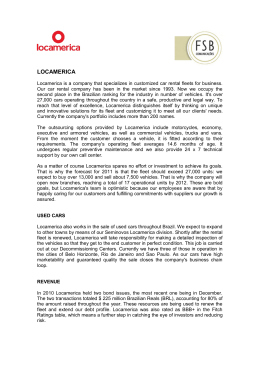
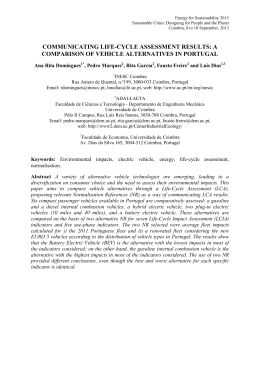
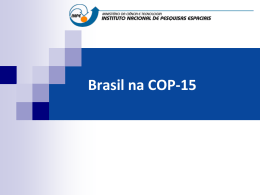
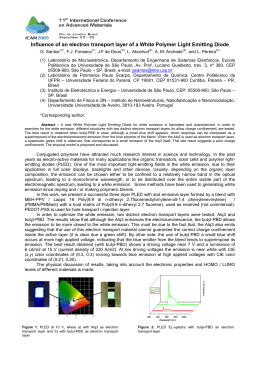
Proceedings of ENCIT 2010 Copyright © 2010 by ABCM 13th Brazilian Congress of Thermal Sciences and Engineering December 05-10, 2010, Uberlandia, MG, Brazil MATHEMATICAL MODELING OF THE EFFECT OF URBAN FLEET SIZE ON AUTOMOTIVE VEHICLES EMISSIONS Marcelo Risso Errera, [email protected] César Augusto Marin, [email protected] Environmental Engineering Department, Federal University of Paraná, CP 19011, Curitiba, Paraná, 81.531-990 Brazil George Stanescu, [email protected] Mechanical Engineering Department, Federal University of Paraná, CP 19011, Curitiba, Paraná, 81.531-990 Brazil Abstract. This paper addresses the effects of fleet size on overall automotive vehicles emissions in urban areas. The main goal was to determine the magnitude of congestion effects and how the introduction of zero emission vehicles (ZEVs) will impact the overall yearly emissions (TYE). A mathematical model was developed to take into account the composition of the fleet, emission factors of each kind of vehicle and the annual increase of the fleet. When only ZEVs are introduced, TYE still increases due systemic effect on traffic. Results showed that in order to stabilize TYE with reference of a given year when only ZEVs is recruited in the fleet, an additional amount of conventional vehicles would have to be replaced by ZEVs in order to compensate marginal effects. This model is promising and illustrates that mean travelling speed should be considered together with low emission technologies in order to reduce vehicular pollutant emissions, and it confirms that a macro scale traffic urban planning shall be addressed before fleet improvement. Keywords: automotive vehicle emissions, zero emission vehicles, mathematical model, traffic model 1. INTRODUCTION Urban air quality has been the subject of the studies, policies and actions worldwide (e.g., EPC, 2008; UNEP-PFCV, 2010; WHO, 2000; USEPA, 2010b). There are several factors that determine the air quality in the cities, namely, urban planning, infrastructure, routes conditions, congestion episodes, traffic operation, degree of traffic saturation, fleet state (technology, maintenance, driver behavior), fuels and local air dispersion capabilities (e.g., Smit, 2006). In most of the large cities around the globe, one of the main factor of deterioration of air quality is the fast growth rate of fleet size for a slow pace of infrastructure (e.g., roads, automation) enhancement, that is, the depletion of free flow traffic conditions. That leads to traffic saturation and congestion episodes, the daily phenomenon most of us face in large cities. According to Brazilian National Motor-Vehicles Agency (DENATRAN, 2010) the national urban fleet has dramatically increased in last decade, namely, 29.424.946 to 60.262.443 vehicles. Despite efforts to introduce new clean technologies for car engines with emission abatement devices, enhance traffic conditions as well as fuel improvement, air pollutants in urban areas are still at considerable “poor” levels (CETESB, 2010). This paper addresses the effects of fleet size on the overall automotive vehicles emissions in urban areas. The main goal was to determine how the introduction of zero emission vehicles (ZEVs) would affect the overall emissions of air pollutants. The focus of this paper relies on emissions of Carbon Monoxide (CO) and Nitrogen Oxides (NOx) on yearly basis (total yearly emission - TYE). Pollutant emissions and air quality are directly connected but have two different meanings. In short, air quality is the result of emissions and the dispersion capability of the surrounding atmosphere compared to the effects the pollutants may have on health (mainly) or on the environment as whole (e.g., Seinfeld and Pandys, 1997). Traffic simulation is a broad field of study in the realm of “traffic science” but it is not the subject of this work. The study of vehicle emissions is also another field and usually considers detailed functioning of the automobiles engines that determine pollutant emissions. For further reading one may address to Khisty and Lall (2003), Taylor (2002), Barceló (2010) and Hall (2002). In this work a mathematical model that captures the direct and systemic emission contributions of the elements of the fleet was devised. Each element (vehicle) is represented by a respective emission factors given by empirical correlations that were based on lab tests. Urban traffic conditions are represented by the annual expected distance travelled per vehicle - also known as kilometrage or mileage in countries that use the Imperial units, and also by the so called “free travel speed” and “travel mean speed”. The study considered the scenario in which fleet expansion can take place solely by zero emissions vehicles. It was showed that such measure would not be enough to stabilize total yearly emissions since ZEV generates a marginal increase of TYE by systemic effects on the traffic flow of the entire fleet. In addition, the amount of regular vehicles that would be necessary to be further replaced by ZEVs to overcome such marginal increase was estimated. Results of this paper may be used to feed the debate on how to stabilize or reduce urban emissions. 13th Brazilian Congress of Thermal Sciences and Engineering December 05-10, 2010, Uberlandia, MG, Brazil Proceedings of ENCIT 2010 Copyright © 2010 by ABCM 2. MATHEMATICAL MODEL At least two separate models are necessary to estimate overall emissions of an urban fleet since one needs to compute traffic flow performance to then calculate the emissions associated with. The relation among the two is quite complex. An overview on traffic flow can be found in a recent compendium (Barceló, 2010). Traffic flow models can be macroscopic, mesoscopic or microscopic, probabilistic (stochastic) or deterministic. The mechanics of the traffic can be modeled as waves (such as solitons or continuum mechanics as in fluid mechanics) or automatons, yet some are hybrids others are simply empirical (e.g., Taylor, 2002). The roots of all models go back to 50’s of the 20th century by the seminal work by Lighthill and Whithman, that was further improved by Richards, when some claim was the very beginning of the “Traffic Science” (c.f. Hall, 2002). That model, now known as LWR, is based on the kinematics of a wave on continuum medium. Further details on the history and the models developed so far can be found in Taylor (2002) and Smit et al (2008). Hall (2002) also points out that traffic models may consider spatial distribution or routes and networks. A successful attempt to include empirical relations was introduced in Helbing (1997) and later by Treiber, Hennecke and Helbing (1999). Those models related the data of a singular vehicle with respect to speed, flow density and velocity variance. In some way almost all the models mentioned above make use of the parameters typically used for operation, optimization and planning to explain the traffic. Such parameters were vehicle density, mean speed and vehicle flow rate that vary with time and one of the spatial dimension (Zhang e Lin, 2002). Worth noting are the models based on the concept of solitons as presented by Kurtze e Hong (1995) and models based on automatons developed in Brazil recently presented in Lima, E.B. and Leal-Toledo R.C. (2008). Air pollutant emissions of urban fleet comes at a second step in completely separate part of the full model. Those emissions are formed mainly in the engine due to combustion process but one can also consider non-combustion origins such as frigorific fluids . Vehicle emissions are correlated by “emission factors” (EF) for each kind of engine & fuel, pollutant abatement technology, vehicle types and also by the way engines are operated. Usually EFs are determined in benchmark tests under controlled situations that associates torque and rotation that are prescribed in standards and norms. Depletion of engines and of abatement devices as well as traffic control also play an important role since fleet ages and wears down. Since policy makers and regulators do need estimates, today one may find simulation softwares such as COPERT 4, MOBILE6, QGEPA, EMFAC, MOVES, TRANSYT and VERSIT+. Some of those simulators also consider environmental, behavioral and economic matters. Models and simulators must be validated and used with caution. They are useful decision making tool even when they miss in accuracy but well capture trends. For the purposes established in this paper, the model adopted in this study is schematically shown in Fig. 1. It falls on the category of macroscopic, deterministic and hybrid since it makes use of empirical correlations obtained from lab tests and field data. Details are shown next. Traffic data Fleet size (N) Mean Speed (v) f(n) Lab tests Emission Factors (FE) g(v) C ( N i ∑ α j FE kj x j ) i Yearly emissions j =1 Fleet composition (α) Average yearly mileage (x) Figure 1. Schematic view of the mathematical model of Total yearly emissions (TYE) 2.1. Proposed traffic model The traffic flow model used in this study was inspired in Smit (2006), and it relies on the fleet mean travelling speed ( v , [km/h]) with respect to degree of traffic saturation, k, ( which in turn is given by the fleet size (n) in number of the 13th Brazilian Congress of Thermal Sciences and Engineering December 05-10, 2010, Uberlandia, MG, Brazil Proceedings of ENCIT 2010 Copyright © 2010 by ABCM vehicles per single lane linear extension (Lm) of the whole urban road network of a given city, [km]) and also depend on the free transit speed (vlivre , [km/h]) in arterial routes in the following way: n k = vlivre 1 − [km / h] v = vlivre 1 − k L k s m s and also v k = 1 − vlivre k s (1) The fleet mean travelling speed, vlivre is the speed performed when the average number of vehicles do not interfere the free flow regime that in turn is determined by traffic regulations, the city shape, the quality of infrastructure (pavements, etc.) and operational measures of traffic control. Traffic saturation, ks, is defined as the threshold when the flow becomes forced (stop-and-go or congested), a little similar with saturation condition of the Webster method – widely used by transport engineers. It also roughly expresses a given perennial overall conditions of traffic of the city. It evolves almost yearly - it can either increase or decrease after interventions. This work considered traffic data from the City of São Paulo (CET, 2007) and it was developed a linear regression between average travel speed, v , and traffic saturation, k , with good agreement (R2 = 0.97). The result of that is illustrated in Fig. (2) and shown in Eq. (2). In view of Eq. (1) and Fig. (2), one can find that the traffic saturation parameter, ks, is nearly 1.1 millions of vehicles per km of route (when v tends to be null) and the free travel speed, vlivre = 30.725 km/h (when k goes to zero). It is worth noting that the free travel speed is not the speed limit of the urban routes since the traffic stream is subject to other constraints such as traffic lights and crossroads. 30 A fter data fro m CET, 2007 20 15 10 V mean (km/h) 25 v = -0,0277(k) + 30,725 R 2 = 0,9703 5 0 0 100 200 300 400 500 k (ve hicle s / k m ) Figure 2. Linear fitting for mean travel speed with respect to traffic saturation for the City of São Paulo (CET, 2007) Equation (1) fits the needs for the discussion covered in this work. Mathematical simulations could indeed be readily replaced by actual traffic flow data, namely, density, speed, type of vehicle, fuel or flow regime (e.g., USDT, 2009), but that matter was well discussed in Smit et al (2008). Another important parameter that shall be considered is the yearly mean travelled distance by each vehicle of the fleet, which is named as mean kilometrage (or mileage), xj [km]. In a given city, it varies mostly with the type of vehicle and driver’s profile. Next model to estimate vehicle and overall fleet emissions is presented. 2.2. Vehicle emissions model Vehicle emissions can be determined in lab tests under standardized conditions and procedures and later extended to traffic conditions, or measured directly on real traffic conditions with on-board probes and then extended to the whole fleet. On-site measurements of air quality are not enough for the purposes of the present work since it represents and overall emission under a dispersion condition (Coldberg, 2005). The need for estimations of air pollutant emissions due to urban mobility as a whole and for health care planning lead to substantial investments to develop simulators. Among those attention is drawn to the MOBILE6 Vehicle Emission Modeling Software from the United States Environmental Protection Agency (USEPA, 2009). MOBILE6 provides emissions estimates of hydrocarbons (HC), carbon monoxide (CO) and nitrogen oxides (NOx) of cars, trucks, motorcycles under diverse conditions of traffic flow. The software also estimates particulate matter emitted and specific toxic gases. It takes into account de cold and hot running regime, features and state of the fleet, volatile emissions, catalyst devices performance, fuel quality and corrections for temperature and speed regime. The 13th Brazilian Congress of Thermal Sciences and Engineering December 05-10, 2010, Uberlandia, MG, Brazil Proceedings of ENCIT 2010 Copyright © 2010 by ABCM model considers standards and regulations, behavioral aspects of drivers and even air conditioning of the cockpit. The softwares was developed in FORTRAN e it is available at no cost in USEPA web-site. European countries make use of COPERT4 (EEA, 2009). It also estimates emissions of most common pollutants (CO, NOx, COV, MP, NH3, SO2, heavy metals) for different vehicle types (passenger car, trucks, motorcycles, etc.) and greenhouse gases (CO2, N2O e CH4). It even considers particulate emissions due to tires and breaks and evaporation of fuels. The software comes with a comprehensive database and it is also available at no cost for download. Models to estimate vehicle emissions were recent reviewed in Smit (2006). For the purposes established in this study, it was used empirical correlations of emission factors (EF) with mean travelling speed. They were based on data presented in IPEA (1998). After curve fitting, emission factors for passenger cars are given by Eqs. (2)-(4). 727 (2) EFCO = −4,51 + + 1,34 ×10⁻³ v 2 v (3) EFNOx = 1,03 + 7,477 × 10 −5 v 2 1 v In turn, emission factors (EF) for duty vehicles are shown in Eqs.(5)-(8). EFHC = −0,28 + 62,48 (4) EFCO = 43,34 − 8,98 ln v EFNOx = 37,21 − 6,46 ln v (5) EFHC = 14,14 − 3,67 ln v (7) EFMP = 1,74 − 0,32 ln v (8) (6) Emission factors are given in [mg] of pollutant by [km] travelled, xj, while de mean travel speed v is estimated by Eq.(1). Since Eqs. (2)-(8) are empirical, their shape have no specific meaning and they hold only in a reasonable range of mean traveling speed. Other vehicles such as motorcycles and variations of passenger cars and of light and heavy duties vehicles are not considered in this paper, whereas electric cars will be considered in the simulations. In the CMME model, full electric cars emit no pollutant while in traffic. The next information required by models are fleet composition, i.e., the amount of vehicle nj of different types (j = 1 to C). Each category is associated to emission factor and mean annual distance travelled (or quilometrage). They represent technological levels and fuel categories. i ETa ,k (in a given city at the ith year) can then be estimated The total annual air emissions of a given pollutant (k), by Eq. (9), where aj is the relative proportion of the vehicle category j, and N the size of the whole fleet (nj / N) at ith year. C ( ) C ( ) C ( i k ETa =∑ n j FE kj x j = N i ∑ α j FE kj x j , k = ∑ Ea , j j =1 i j =1 i ) i (9) j =1 In few words, each category j emits a total of Eak, j of metric tones of pollutant k due to the travelled distance xj in year i. The size of whole fleet may vary as well as the fleet composition along the years thus providing time evolution of overall emissions. The core of the model is schematically shown in Fig. 1 and the set of Eqs.(1)-(9). The model will be called CMME thereof (Marin and Errera, 2007). In the next two sections two simulations of special interest are carried out. The first case provides estimates of the marginal pollution of systemic traffic effects (deterioration of travel conditions and thus mean travel speed decrease) provided by the gradual increase of the fleet with none, or no, substantial change of infra-structure. The second set of simulation verify the extent of how zero emission vehicles (ZEVs) can reduce overall emissions. 3. FLEET SIZE EFFECT ON THE OVERALL YEARLY URBAN EMISSIONS This simulation deals with the effect of fleet size on the overall yearly emissions of carbon monoxide (CO) and nitrogen oxides (NOx). A scenario based on Eqs.(1)-(9) and data of the City of Curitiba was set. Emission factors given by Eqs. (2)-(8) remained unaltered. Pure ethanol (E100) or “flex fuel” cars were not considered due to lack of proper emission factor correlations. This simulation considered the size and composition of the fleet published in reports of DETRAN-PR (department of motor vehicles of the State of Paraná) of the year 2005 (Tab. 1). For the sake of conciseness, vehicles were further sorted according to the fuel type burnt (Otto or Diesel cycles). Table 2 summarizes fleet composition the adopted yearly quilometrage (mileage) of both categories. 13th Brazilian Congress of Thermal Sciences and Engineering December 05-10, 2010, Uberlandia, MG, Brazil Proceedings of ENCIT 2010 Copyright © 2010 by ABCM Table 1. Typical fleet composition (1996-2005 average) and size of registered fleet to Curitiba in 2005. Categories Typical composition, aj [%] Fleet size, nj [vehicles] Motorcycle 7.35 66691 Passenger car 74.55 676269 Bus 1.00 9077 Trucks 17.06 154772 Others 0.04 345 Total 100.00 907,154 Adapted from: (DENTRAN-PR, 2009). Table 2. Fleet composition with respective quilometrage adopted for the simulations Yearly quilometrage xj , km/year Grouped categories composition, aj [%] Passenger cars (otto) Bus + trucks (diesel) Others Total 82.84 17.16 0 100.00 12,000 80,000 - The simulation scenario is completed with the free travel speed vlivre = 40 km/h and the single lane linear extension Lm = 4,381 km of the whole urban road network of Curitiba (IPPUC, 2007). The saturation parameter ks, as parameter of Eq.(1) was thus calculated. In the lack of accurate estimates for Curitiba, a correction factor was introduced to use the same trend of the curve v × k shown in Fig. 2, obtained for the City of São Paulo; hence, f = 40/30.725. The corrected expression of how the mean travel speed varies with the fleet size is presented in Eq. (10). N [km / h] v = 40.01 − 901.84Lm (10) The simulation carried out provided estimates of the marginal pollution of systemic effects on the overall traffic, that is, the decrease of the mean travel speed of the fleet and the resulting increase in emissions. Calculations considered yearly gradual increase of the fleet starting from a reference and abstract value of N = 0 at year i = 0 up to six million vehicles with the same composition of Tab. 2 and with little, or none, substantial change of infra-structure and traffic operation measures. i Figure 3 shows the evolution of the total overall yearly emissions, ETa , of CO and NOx with respect to the ,k gradual increase of the fleet size (solid line). The recruitment (introduction of new vehicles is considered to be recruitment because it is considered a mobility need of a given urban environment) on the fleet lead to a reduction of travel mean speed v given by Eq.(1) thus increasing the individual emission factor, EFk, calculated by Eqs.(2)-(8). To i illustrate the systemic effect of the traffic flow, it was also plotted, in dashed line, what would be the ETa if the ,k recruitment had no impact on the traffic flow, i.e., if the mean travel speed remained constant at a given reference level (e.g., free travel speed v = vlivre). Emissions would increase linearly with the fleet size since FEs remain constant. One can clearly notice a progressive jump from one case to the other. In Fig. 3 one can also notice that carbon monoxide emissions are more sensitive to the deterioration of traffic conditions. An alternative and direct way of presenting the effects of traffic congestion is to plot the relative increase of the emissions, in other words, the marginal increment. This is shown in Fig. (4), where δETa ,k / δN by N for CO and for NOx were plotted (with and without systemic effect on traffic). When no congestion effects take place (dashed lines) the marginal effect is constant, solely given by the contribution of each one of new vehicle recruited (fleet size independent). 13th Brazilian Congress of Thermal Sciences and Engineering December 05-10, 2010, Uberlandia, MG, Brazil Proceedings of ENCIT 2010 Copyright © 2010 by ABCM 3500000 ____ with congestion effects - - - - without congestion effects ETa,CO , ETa,NOx [ ton / year ] 3000000 2500000 2000000 CO 1500000 1000000 NOx 500000 0 0,0 0,5 1,0 1,5 2,0 2,5 3,0 fle et size, Ni in ve hicles [ millions ] Figure 3. Evolution of the total yearly emission of CO and NOx with respect to the fleet size, N. Overall, given the assumptions of the CMME model, one can have a sense of magnitude of the effects. Figure 3 shows that congestion will progressively aggravate pollutant emissions. In turn, Figure 4 presents variation for each thousand vehicles recruited in the proportions of Tab. 2, it shows that technological efforts to reduce emissions (engines, fuels and abatement) might easily be overrun by congestion. The next section presents a scenario in which technology and economy of non-pollutant vehicles are ready. Those vehicles are otherwise known as zero emissions vehicles (ZEV), such as electric or hydrogen fuel-cell cars. In addition, this scenario considers that all passenger cars recruited in the fleet be ZEV. Can that alone be a solution to reduce emissions ? 4. CAN ZEVs ALONE REDUCE OVERALL URBAN VEHICLES EMISSIONS ? Let us consider a scenario in which the fleet size of a given city grows only by recruiting passenger cars. Follow some regulation or policy, only zero emission vehicles are allowed to run in the urban area. Such measure is expected to result in a overall emission reduction or stabilization despite fleet expansion. CMME model is now used to verify whether such expectation would be fulfilled. One more time, data from the city of Curitiba is used with the following assumptions: i. only vehicles of the new category ZEV can be recruited; ii. the fleet of buses and trucks remain the same (quantitatively and qualitatively); iii. only three categories of vehicles are considered, namely, C = 3 ( j = 1, gasoline; j = 2 diesel, j = 3 ZEV); iv. the fleet composition will vary from the starting point of section 3 at i = 0; v. n1 and n2 remain constant in time, thus n1 + n2 = N0 ; vi. mean travel distance of ZEVs is the same as the gasoline fueled vehicles, i.e., x3 = x1; vii. other assumptions follow the scenario of Curitiba presented in section 3; viii. With regard to Fig. (3), just carbon monoxide (CO) was chosen to guide the test; ix. conventional passenger cars are not replaced; According to DETRAN-PR (DETRAN, 2009), Curitiba’s fleet reached the figure of 1,121,897 vehicles with active licenses. Therefore the estimates will begin with the fleet size at N0 = 1,000,000 figure and the corresponding emission 0 , which must, at least, be stabilized. This constraint is expressed through Eq.(10) derived from Eq. (9). level, ETa ,CO 13th Brazilian Congress of Thermal Sciences and Engineering December 05-10, 2010, Uberlandia, MG, Brazil Proceedings of ENCIT 2010 Copyright © 2010 by ABCM 4000 dETa,k / dN [ ton / 1000 veh. ] 3500 ____ with congestion effects - - - - without congestion effects 3000 2500 CO 2000 1500 1000 NOx 500 0 0,0 0,5 1,0 1,5 2,0 2,5 3,0 fleet size, Ni in vehicles [ millions ] Figure 4. Specific rate of increase of emissions due to fleet expansion. C ( ) ETa0 ,CO = ∑ EaCO = constant ,j i (11) j =1 Simulations show that even with the introduction of ZEVs there is an increase of overall emission due to the increase of emissions of the conventional passenger cars (gasoline) that begin to face more flow congestion: first the mean travel speed v decreases (Eq.(10), then the emission factors EF for individual vehicles raises. Indeed, the model CMME states that overall emissions shall not decrease if the fleet size of each polluting category, ni, remains constant (stated at assumption v). Moreover it states that emissions will definitely increase due to congestion (Fig.(3)). The answer to the theme question of this section is then “it depends”. It will depends on the rate convention (polluting) passenger cars is also replaced by aging while only ZEVs are recruited. So let us consider that the flow congestion effects on emissions are immediately compensated by replacing part of the conventional cars such that the 0 overall emission level remains constant at ETa . Numerically, the task is to calculate dn1 that vanishes the marginal ,CO i impact of the fleet expansion (δNi =Ni – Ni-1), that is, δETa = 0. Hence the number of recruited ZEVs at the ith year , CO will be δNi + dnC , where dnC = dn1 in way that overall emissions do not alter from the initial year. That is mathematically expressed for the general case by Eq.(12) derived analytically for the task in hand. 3 3 δETai ,k = ( N 0 + δN i )∑ (α sj FE kj x j ) − ( N 0 )∑ (α j FE kj x j ) = 0 i j =1 where 0 (12) j =1 α sj is the composition the fleet must have after the replacement of vehicles of category (1) by ones from category (3) for compensation purposes. Under the assumptions (i)-(ix) and their algebraic representation, one can obtain the analytical expression given by Eq. (13) to determine how many conventional vehicles must be replaced by ZEVs (pollutant indices omitted). δnc = −δn1 = δn3 = N0 α1 x1 FE1s − FE10 + α 2 x2 FE2s − FE20 x1 FE1s [ ( ) ( )] (13) where FE sj is emission factor estimated with the up-to-date fleet size but with altered composition by the regular recruitment of ZEVs added to the compensation replacement ZEVs; and FE 0j is emission factor estimated with the reference composition of the fleet. Simulations were carried out with increments of δNi = 20,000 new ZEVs each year and the respective dnC calculation by Eq.(13). 13th Brazilian Congress of Thermal Sciences and Engineering December 05-10, 2010, Uberlandia, MG, Brazil Proceedings of ENCIT 2010 Copyright © 2010 by ABCM First results show a linear correlation (one can demonstrate by pure algebra or by plotting it) between the compensation replacement dnCi and the size of the fleet Ni. Numerically speaking, for instance, when additional 1,000,000 ZEVs are introduced into the fleet, the compensatory replacement would be of 325,000 (32%). Another interesting feature is illustrate by the curve of Fig.(5), where the relative compensatory replacement (dnC / N ) against the relative expansion of the fleet based on its initial size (dN / N0) was plotted. There is a clear trend of saturation, that is, the relative compensatory replacement tend to remove all conventional vehicles (category 1) by ZEVs until the only polluting vehicles are the trucks and buses of category 3. Expansion dN may occur in any period of time. This helps show the MCME model is correct for the purposes assigned. relative amount of zero emission vehicles for compensation 20% Overall emission constant at the level of 1,000,000 conventional vehicles 18% 16% 14% 12% 10% 8% 6% 4% 2% 0% 0,0 0,1 0,2 0,3 0,4 0,5 0,6 0,7 0,8 0,9 1,0 1,1 1,2 relative recruitment of ZEVs to the fleet Figure 5. Variation of relative compensatory replacement (dnC / N ) with respect to the relative fleet expansion (dN / N0 ), both in ZEVs. Figure 6 presents the evolution of the fleet composition for the scenario established (reminding that overall emission is stabilized at the first year, i = 0). Starting from the 1,000,000 million vehicles fleet size, conventional passenger cars are replaced by ZEVs in a more than linear rate due the compensatory replacement. The size of the fleet of the diesel cycle category (j=3), n3 is held constant while the expansion takes place. One of the main conclusion one can draw from this simulation is that even 100% of the passenger cars being ZEV, there will be a moment when the congestion will be so intense that category 3 alone will emit as much as the whole fleet at the initial state - that had no ZEV whatsoever in the fleet. Back to the main question, indeed solely expanding the fleet by ZEVs will not solve the problem of urban automotive emissions. 13th Brazilian Congress of Thermal Sciences and Engineering December 05-10, 2010, Uberlandia, MG, Brazil Proceedings of ENCIT 2010 Copyright © 2010 by ABCM 90% 80% conventional (1) fleet composition, a j 70% 60% ZEV (2) 50% 40% 30% 20% diesel (3) 10% 0% 0,0 0,5 1,0 1,5 2,0 2,5 Fleet size , N [millions of vehicles ] Figure 6. Evolution of fleet composition with yearly ZEVs recruitment and stabilized TYE 5. CLOSURE In this paper a simple model to estimate overall automobile emissions in a given city was devised. The model falls on the category of macroscopic, deterministic and hybrid. The simulator can be analytical or numerical depending upon the goals and scenarios. The main inputs for the traffic condition are the mean free speed, saturation traffic parameter and correlation between saturation level and mean travel speed. Pollutant emissions are calculated by emission factors. Both blocks can be improved with little change on the model. The first example studied the marginal pollution of systemic traffic effects generated by the gradual increase of the fleet with none, or no, substantial change of infra-structure. CMME model provided a sense of magnitude of such effects. The second set of simulation verified the extent of how zero emission vehicles can reduce overall emissions. CMME model showed that even when fleet expansion happens solely with ZEVs (passenger cars) there will be the need to replace conventional vehicles up to the point that traffic congestion will be so intense that 100% of the passenger cars will be ZEVs and the emissions will be generated by diesel trucks and buses. That point forth, emissions will inevitably increase. Conclusions are related to both cases only. The CMME model is in its early stage compared to world wide simulators available and it does need validation and calibration if it is used to more detailed applications. Nevertheless for the cases presented in this paper it agrees qualitatively with COPERT. In sum, this model is promising and illustrates quantitatively how efforts in reducing mean travelling speed can be more effective than incentives in ZEVs. The model is versatile in regard to the goals. It may be an addition to the set of simulations already available. 6. AKNOWLEDGEMENTS Authors gratefully acknowledge the support of AGROGÁS II / FINEP/PETROBRAS/SPIRAXSARCO/TBG/COMPAGAS (Ref. FINEP 0435/04) and CAPES for the scholarship in the PPGERHA graduate program. 7. REFERENCES Barceló, J., 2010, “Fundamentals of Traffic Simulation” (International Series in Operations Research & Management Science). Springer, 472 pages. CET ,2007, “Relatório de Desempenho – Velocidades”, (Companhia de Engenharia de Tráfego/CET da Prefeitura Municipal de São Paulo), abril (eletrônico). Proceedings of ENCIT 2010 Copyright © 2010 by ABCM 13th Brazilian Congress of Thermal Sciences and Engineering December 05-10, 2010, Uberlandia, MG, Brazil CETESB, 2010, “BOLETIM 08/07/2003, 15h / RMSP” and “BOLETIM 08/07/2009, 15h / RMSP” http://www.cetesb.sp.gov.br/Ar/ar_boletim_mensal.asp visited at 12/09/2010. Colberg, C. A., Tonab, B., Stahelb, W. A., Meierc, M. and Staehelina, J., 2005, “Comparison of a road traffic emission model (HBEFA) with emissions derived from measurements in the Gubrist road tunnel, Switzerland”, Atmospheric Environment 39, pp. 4703–4714. DENATRAN, 2010, “Frota de veículos, por tipo e com placa, segundo as Grandes Regiões e Unidades da Federação ABR/2010” and “Frota de veículos, por tipo e com placa, segundo as Grandes Regiões e Unidades da Federação 2000”, available at http://www.denatran.gov.br/frota.htm (visited at 12/09/2010). D’errico, G., Ferrari, G., Onorati, A., 2003, “Modeling the exhaust emission reduction from a spark ignition engine by secondary air injection”. Proceedings of ECOS 2003, Copenhagen, Denmark June 30–July 2, 2003, p. 405-412. EEA, 2009, COPERT4. European Environmental Agency. http://www.eea.europa.eu/ e http://lat.eng.auth.gr/copert/ (set/2009) COPERT: A European Road Transport Emission Inventory Model, Springer, ISSN1863-5520. Egami, C. Y. ; Setti, J. R. and Rilett, L. R., 2004, “Algoritmo genético para calibração automática de um modelo de simulação de tráfego em rodovias de pista simples”. Transportes (Rio de Janeiro), v. 12, p. 5-14. EPC - European Parliament, Council, 2008, Directive 2008/50/EC of the European Parliament and of the Council of 21 May 2008 on ambient air quality and cleaner air for Europe. Errera, M. R. and Marin, C. A., 2009, “Modelo matemático para efeito do tamanho da frota urbana de veículos automotores na emissão de poluentes atmosféricos”. Presented in 17o Congresso Brasileiro de Transporte e Trânsito - ANTP, 2009, Curitiba, PR. Anais do 17o Congresso Brasileiro de Transporte e Trânsito - ANTP. Hall, R.W. (ed.), 2002, “Handbook of transportation science”, 2nd. Ed., vol. 32 (1) Interfaces archive, pp. 97-99. Kluwers. Helbing, D., 1997, “Empirical traffic data and their implications for traffic modeling”, Physical Review E, vol. 55 (1), pp.25-28. IPPUC, 2007, “PMC/SGM, IPPUC/Geoprocessamento”, Instituto de Pesquisa de Planejamento Urbano de Curitiba Banco de dados. Khisty, C.J. and Lall, B.K., 2003, “Transportation Engineering: An Introduction” (3ª. ed.), Prentice Hall. Mannering, F.L. Kurtze, D.A. e Hong, D.C., 1995, “Traffic jams, granular flow, and soliton selection”, Physical Review E, vol. 52(1).pp. 218-221. Lima, E.B. e Leal-Toledo R.C., 2008,“Modelo de autômatos celulares para tráfego viário multi-faixas, com antecipação de movimento”, No XXXI Congresso Brasileiro de Matemática Aplicada e Computacional, pp.665-671. Marin C. and Errera, M.R., 2007, “Modelo matemático para efeito do tamanho da frota urbana de veículos automotores na emissão de poluentes atmosféricos”. Cadernos de resumo do XV EVINCI, UFPR-PR, Curitiba, Brazil. Seinfeld, J.H. and Pandys, S.N., 1997, “Atmospheric Chemistry and Physics: From Air Pollution to Climate Change”. Wiley-Interscience, 1326 pages. Smit, R., 2006, “An examination of congestion in road traffic emission models and their application to urban networks”, Doctoral Thesis, School of Environmental Planning, Faculty of Environmental Sciences, Griffith University, Australia. Smit, R., Brown, A.L. and Chan, Y.C., 2008, “Do air pollution emissions and fuel consumption models for roadways include the effects of congestion in the roadway traffic flow?”, Environmental Modelling & Software, Volume 23, Issues 10-11, October-November 2008, Pages 1262-1270. Taylor, M.A.P. (ed), 2002, “Transportation and traffic theory in the 21st century”, Pergamon Press. Treiber, M., Hennecke, A. e Helbing, D, 1999, “Derivation, properties, and simulation of a gas-kinetic-based, nonlocal traffic model”, Physical Review E, vol. 59 (1), pp.239-253. UNEP-Partnership for Clean Fuels and Vehicles, http://www.unep.org/transport/pcfv/ (visited in July 31, 2010). USEPA, 2009, MOBILE6.2 Vehicle Emission Modeling Software, http://www.epa.gov/OMS/m6.htm (set/09). USEPA, 2010a, http://www.epa.gov/ebtpages/airairpourbanairpollution.html (visite in July 31, 2010) USEPA, 2010b, “Technical Guidance on the Use of MOVES2010 for Emission Inventory Preparation in State Implementation Plans and Transportation Conformity”. http://www.epa.gov/otaq/models/moves/index.htm . WHO regional publications, 2000, “Air quality guidelines for Europe” ; second edition, European series; No. 91 Zhang, H.M and Lin, W-H, “Some recent developments in vehicular traffic flow theory”, in Taylor, M.A.P. opus cit. 8. RESPONSIBILITY NOTICE The authors are the only responsible for the printed material included in this paper.
Download