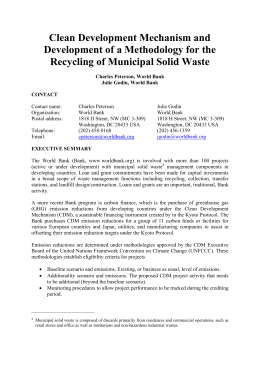
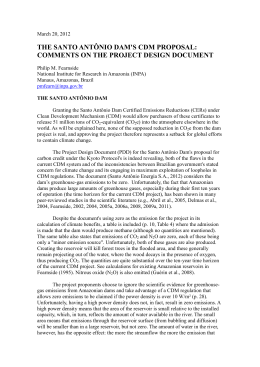
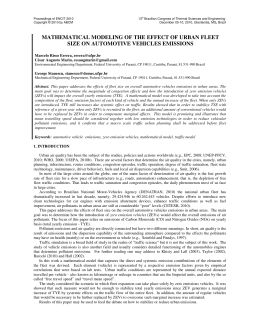
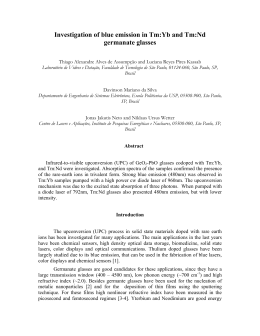
Sharing global CO2 emission reductions among one billion high emitters Shoibal Chakravartya, Ananth Chikkaturb,1, Heleen de Coninckc, Stephen Pacalaa,2, Robert Socolowa, and Massimo Tavonia,d aPrinceton Environmental Institute, Princeton University, Princeton, NJ 08540; bBelfer Center for Science and International Affairs, Harvard University, Cambridge, MA 02139; cEnergy Research Centre of the Netherlands, P.O. Box 1, 1755 ZG, Petten, The Netherlands; and dFondazione Eni Enrico Mattei, 20123 Milan, Italy We present a framework for allocating a global carbon reduction target among nations, in which the concept of ‘‘common but differentiated responsibilities’’ refers to the emissions of individuals instead of nations. We use the income distribution of a country to estimate how its fossil fuel CO2 emissions are distributed among its citizens, from which we build up a global CO2 distribution. We then propose a simple rule to derive a universal cap on global individual emissions and find corresponding limits on national aggregate emissions from this cap. All of the world’s high CO2emitting individuals are treated the same, regardless of where they live. Any future global emission goal (target and time frame) can be converted into national reduction targets, which are determined by ‘‘Business as Usual’’ projections of national carbon emissions and in-country income distributions. For example, reducing projected global emissions in 2030 by 13 GtCO2 would require the engagement of 1.13 billion high emitters, roughly equally distributed in 4 regions: the U.S., the OECD minus the U.S., China, and the non-OECD minus China. We also modify our methodology to place a floor on emissions of the world’s lowest CO2 emitters and demonstrate that climate mitigation and alleviation of extreme poverty are largely decoupled. climate change 兩 climate equity 兩 climate policy 兩 individual emissions 兩 inequality T he 1992 United Nations Framework Convention on Climate Change (UNFCCC) created a 2-tier world. It called upon the developed (‘‘Annex I’’) countries to ‘‘take the lead’’ in reducing carbon emissions, and, under the principle of ‘‘common but differentiated responsibilities,’’ established no time frame for developing countries to follow. However, a consensus is now emerging in favor of low stabilization targets. These targets cannot be achieved without the participation of developing countries, which today emit about half of global CO2 emissions and whose future emissions increase faster than the emissions of industrialized countries under ‘‘business as usual’’ scenarios (1). On what terms should developing countries participate? There are many proposals, each buttressed by some appeal to ‘‘fairness.’’ Per capita allocation is widely acknowledged to represent the only equitable goal in the long term, but intermediate steps are required in the short-to-medium term. Uniform percentage reductions in emissions across all countries are rightly rejected by all parties, on the grounds that industrialized countries must create headroom for developing countries. Here, we offer a different approach: An allocation of national targets for fossilfuel CO2 emissions derived from a fairness principle based on the ‘‘common but differentiated responsibilities’’ of individuals, rather than nations. Our proposal moves beyond per capita considerations to identify the world’s high-emitting individuals, who are present in all countries. Our approach is designed to blend parsimony, fairness, and pragmatism—treat equally those with the same emissions, wherever they live, and use only national income distributions and economy-wide carbon intensities. National responsibilities are www.pnas.org兾cgi兾doi兾10.1073兾pnas.0905232106 derived by summing the excess emissions of all ‘‘high emitter’’ individuals in a country—‘‘high emitters’’ are those whose emissions exceed a universal individual emission cap. The scheme does not specify how any nation meets its responsibilities. Our approach is restricted to future fossil-fuel CO2 emissions and focuses on the next 2 decades. We do not include biospheric CO2, other greenhouse gases, and aerosols, because they are not strongly correlated with personal expenditures and national carbon intensities. By imputing national emissions to individuals, we neglect embedded carbon in exports and imports, a component that is relevant for countries with large shares of trade in their economy. We also do not tackle historical responsibility. These are all important topics, and a complete scheme suitable for use in negotiations would need to take them into account. Baer et al. (2) uses a similar approach, but relies on high incomes rather than high emissions and on a fixed income cap at $7500 (PPP adjusted). In contrast, our scheme is based on individual emissions rather than income to reward improvements in national carbon intensity. Several others explore allocation regimes based on convergence of national average per capita emissions in the long-term, typically beyond 2050 (3–5), whereas our proposal specifies a transient path that can lead ultimately to long-term convergence. Individual Emission Distributions. We begin by obtaining a picture of how 26 GtCO2 of global emissions in 2003 were distributed across the world’s 6.2 billion people. We first construct national income distributions from World Bank data (6). We then convert these income distributions into individual CO2 emission distributions, assuming unitary elasticity* and anchoring means using country level emissions data. We use present and projected emissions data from the Energy Information Agency (EIA) (7), a freely available database with geographically disaggregated emissions projections to 2030. Fig. 1 shows how our method works for 2 representative countries, Australia and France. The upper and lower panels report the probability distributions for income and emissions, respectively. Despite having similar incomes, the emission distribution in Australia is shifted to the right of that of France, because Australia has a higher national carbon intensity. The Author contributions: S.C., S.P., R.S., and M.T. designed research; S.C., R.S., and M.T. performed research; and S.C., A.C., H.d.C., S.P., R.S., and M.T. wrote the paper. The authors declare no conflict of interest. Freely available online through the PNAS open access option. 1Present 2To address: ICF International, Fairfax, VA 22031. whom correspondence should be addressed. E-mail: [email protected]. *The SI Appendix presents data sources and categories, methodology, sensitivity analysis of the elasticity of emissions with income, and comments on the poverty emissions floor of 1 tCO2 per person per year. This article contains supporting information online at www.pnas.org/cgi/content/full/ 0905232106/DCSupplemental. PNAS Early Edition 兩 1 of 5 SUSTAINABILITY SCIENCE Contributed by Stephen Pacala, May 19, 2009 (sent for review March 16, 2009) 0.8 Australia France 0.6 0.4 0.2 0 0 20000 40000 60000 80000 GDP/capita (2000$ PPP) 100000 0.15 Australia France 0.1 0.05 0 0 5 10 15 20 25 30 Individual emissions (tCO2/yr) 35 40 Fig. 1. Income (Upper) and emissions (Lower) probability density functions for Australia and France in 2003. The triangles on the horizontal axis indicate the means of the distributions. plot shows that Australia hosts more individuals for every level of annual emissions above 10 tCO2. We apply this carbon intensity rescaling procedure to each nation, and we obtain a picture of how individual emissions are distributed globally by summing them up. The global cumulative distribution for 2003 is shown in Fig. 2 Inset.† To develop our approach, we also need the corresponding national and global CO2 emission distributions for future dates under BAU. For simplicity, we assume that income inequality at the country level does not change over time. We scale the distributions of individual emissions to the projections of regional CO2 emissions and population, out to 2030, from EIA (7) and UN (8), respectively. The resulting BAU distribution of the world’s 43 GtCO2 emissions in 2030 across 8.1 billion people is also shown in Fig. 2. Sharing Emission Reductions to Achieve a Global Target. Once the world agrees to a global CO2 emission reduction target, based on a stabilization target, a framework is needed to arrive at national emission allocations. Our approach provides a consistent rule for determining these allocations. A universal cap is imposed on the global individual emission distribution, such that eliminating all emissions above that cap achieves the target (Fig. 2). The cartoon in Fig. 3 introduces this scheme. The consequences of this cap are country-level emission targets that reflect the number of ‘‘high emitter’’ individuals in that country and their aggregate emissions. The universal emission cap achieves equity and fairness in the climate change context in the sense that: (i) countries with a larger proportion of high emitters do more, and (ii) countries with similar emission profiles have similar commitments. Fig. 2 shows how this method works for a specific example: A global fossil-fuel-CO2 emission target of 30 GtCO2 in 2030. This case requires a 30% global cut in emissions with respect to BAU for that year and essentially the same global emissions as in 2008. The 2030 individual emission cap is 10.8 tCO2, and 1.13 billion people (less than 15% of the 2030 global population) will be †In the SI Appendix, we test a power-law relationship between CO 2 emissions and income, seeking a universal exponent  that best fits the historical data. As discussed in the SI, it is estimated that  ⬃ 0.7. However, in Figs. 1–7 and Table 1 here, we show a linear relationship  ⫽ 1.0, because this value of  is easy to analyze: Each country’s emissions distribution is the same as its income distribution with a simple change of units. Also, as seen in the SI Appendix, results for  ⫽ 0.7, 0.8, 0.9, and 1.0 are not very different. 2 of 5 兩 www.pnas.org兾cgi兾doi兾10.1073兾pnas.0905232106 Fig. 2. The world’s population in 2030 (8.1 billion) ranked according to decreasing annual emissions. The total area under the curve is the projected BAU emissions in 2030 (43 GtCO2), and the blue region shows the 13 GtCO2 that needs to be removed to meet the 30 GtCO2 (‘‘30’’ in figure) target. The individual emission cap is 10.8 tCO2, affecting 1.13 billion people. Also shown are the individual emission caps for global targets of 20 GtCO2 (cap at 4.9 tCO2), 25 GtCO2 (cap at 7.3 tCO2), and 35 GtCO2 (cap at 16.8 tCO2). The Inset contrasts the 2003 curve with the 2030 curve. above the cap.‡ The shaded area in Fig. 2 shows the total emission reductions, 13 GtCO2. Fig. 2 also shows the individual emission cap for global fossil-fuel-CO2 emission targets of 20, 25, and 35 GtCO2 in 2030.§ Assuming a 30 GtCO2 target for 2030, Fig. 4 disaggregates Fig. 2 into the component emission distributions for 4 regions: U.S., OECD minus U.S., China, and the non-OECD minus China.¶ At the global cap of 30 GtCO2, the 4 curves are close together, reflecting the roughly 250 million people above the cap in each of the 4 regions. In Fig. 5, we show the trajectories from 2003 to 2030, assuming that global emissions peak at 33 GtCO2 in 2020 and descend linearly to 30 GtCO2 in 2030. Noticeable departures from BAU for China occur later than for the other 3 regions, reflecting the relative paucity of high emitters in China at present. Table 1 provides detailed results for the 30 GtCO2 target for 2030 for the 16 regions EIA uses in its projections. We present a full set of corresponding Tables, for emission targets of 20, 25, 30, and 35 GtCO2, and for 2020 and 2030, in the supporting information (SI) Appendix. The universal carbon emission threshold can be converted into an income threshold for each country/region using the appropriate carbon intensity. In 2030, with BAU projections of 43 GtCO2 of fossil-fuel emissions and a global GDP of 154 trillion ‡‘‘One billion high emitters’’ in the title of our paper comes from this example. The actual number depends on the date, the target, and the scenario used for the projection. As seen in the supporting information, 0.60, 1.76, and 2.45 billions high emitters are involved in 2030 if the targets are 35, 25, and 20 GtCO2, respectively, and if the reference scenario from the EIA Annual International Outlook 2007 (7) is used. ‘‘One billion high emitters’’ is our metaphor for a globally coordinated attack on climate change. §A global target for a date as early as 2030 and restricted to fossil fuels cannot be convincingly associated with any specific stabilization target, given the significance of nonfossil fuel emissions, the uncertainty about land sinks, and the many following decades during which the level of effort is unspecified. The 20, 25, and 30 GtCO2 targets for 2030 are intended to be examples of targets that require immediate globally coordinated implementation, thereby making credible the eventual achievement of stringent stabilization targets. ¶We group countries using OECD rather than Annex I in this paper because, typically, projections of regional growth and emissions define regions using the OECD/non-OECD distinction. The OECD and Annex I are not the same. Notably, Annex I includes Russia. CO2 emissions in 2003 were 13.3 GtCO2 for the OECD but 18.4 GtCO2 for Annex I (UNFCCC GHG data). Chakravarty et al. Region U.S. Canada Mexico OECD Europe Japan South Korea Australia and New Zealand OECD minus U.S. Total OECD China Russia Transition Economies India Other Non-OECD Asia Middle East Africa Brazil Other South and Central America Non-OECD minus China Total Non-OECD Total World Pop. (BAU) [2030], millions Emis. (30) [2030], GtCO2 Pop. under cap (30) [2030], millions Emis. (30P) [2030], GtCO2 Pop. under cap (30P) [2030], millions (30P) change w.r.t [1990], % (30P) change w.r.t [2003], % (30P) change w.r.t (BAU), % Emis. [1990], GtCO2 Emis. [2003], GtCO2 Pop. [2003], millions Emis. (BAU) [2030], GtCO2 5.0 0.5 0.3 4.1 1.0 0.2 0.3 5.8 0.6 0.4 4.3 1.2 0.5 0.4 291 32 101 529 128 48 24 8.0 0.7 0.7 4.7 1.3 0.7 0.6 365 39 129 561 123 50 30 3.6 0.4 0.6 3.8 1.1 0.5 0.3 267 29 14 139 43 30 21 3.2 0.3 0.5 3.6 1.0 0.4 0.3 285 31 16 175 57 34 22 ⫺35 ⫺27 81 ⫺11 1 81 ⫺11 ⫺45 ⫺40 43 ⫺16 ⫺18 ⫺9 ⫺37 ⫺60 ⫺53 ⫺21 ⫺23 ⫺22 ⫺37 ⫺55 6.4 11.4 2.2 2.3 1.9 7.4 13.3 4.0 1.6 1.1 861 1152 1296 145 195 8.7 16.7 11.4 2.2 1.6 931 1296 1442 125 190 6.6 10.2 8.5 1.2 1.3 276 543 300 77 49 6.2 9.5 8.2 1.1 1.2 336 620 354 85 60 ⫺3 ⫺17 264 ⫺54 ⫺34 ⫺16 ⫺29 106 ⫺33 12 ⫺28 ⫺43 ⫺29 ⫺51 ⫺26 0.6 0.8 1.1 1.4 1065 927 2.2 2.8 1442 1308 2.2 2.2 1 47 2.3 2.5 2 52 304 213 121 85 7 ⫺9 0.7 0.6 0.2 0.5 1.2 1.0 0.3 0.6 175 854 181 257 2.3 1.8 0.6 1.2 282 1438 237 349 1.4 1.4 0.6 1.0 56 23 10 22 1.4 2.2 0.6 1.0 64 27 13 27 97 244 161 126 13 128 80 59 ⫺41 24 ⫺4 ⫺16 7.6 8.3 3798 14.8 5370 11.3 284 12.4 330 63 50 ⫺16 9.8 21.2 12.2 25.5 5094 6245 26.2 42.9 6812 8108 19.8 30.0 583 1126 20.5 30.0 684 1304 109 41 68 18 ⫺22 ⫺30 Data from the 4 italicized lines are plotted in Figs. 4 and 5. dollars (PPP, in year 2000 dollars), each ton of fossil-fuel CO2 emissions is associated with $3600 of global GDP, and thus the emission cap of 10.8 tCO2 corresponds to an average global PPP income of about $39,000. The corresponding national income thresholds vary significantly across countries, reflecting variations in national carbon intensity.储 Addressing Poverty Alleviation and Carbon Emission Reductions Simultaneously. The approach can be modified to place a floor on individual emissions. For example, a floor of 1 tCO2/yr per person exceeds the projected emissions of 2.7 billion individuals in 2030 (one-third of the world population). The 1 tCO2/yr floor is roughly consistent with Millennium Development Goals (http://www.un.org/millenniumgoals/). Establishing such a floor has the consequence of shielding the lowest one-third of the world’s emitters from the CO2 reduction strategies that will need to permeate the activities of the other two-thirds of the world’s population to achieve significant global CO2 emission reductions (9). The world’s lowest emitters would not be thwarted from obtaining diesel engines to produce their first electricity for lighting, television, and the charging of batteries; gasoline fuel for their first motorized transport; and liquid petroleum gas for their first modern cooking fuel—where these technologies are the lowest-cost options. The consequences of a 1 tCO2 floor for the mitigation required of the other two-thirds of the world’s population are small, as Fig. 6 shows. See the cap, labeled ‘‘30P,’’ that results when a floor of 1 tCO2 in 2030 is in place and the 2030 global emission target of 30 GtCO2 is retained. To compensate for the additional 1.5 GtCO2 of reductions by high emitters required to create such a floor, the universal cap is 9.6 tCO2 (down from 10.8 tCO2) and the number of ‘‘high emitters’’ is 1.30 billion (up from 1.13 billion). The message of Fig. 6 is that addressing climate change mitigation and meeting the basic energy needs of the global poor are nearly decoupled objectives. 储According to the EIA (7), each ton of fossil-fuel CO2 emissions in 2003 was associated with $2000 of global GDP. Accordingly, EIA projects a CO2 intensity of the global economy (emissions/GDP) that decreases by 43% between 2003 and 2030 in their BAU scenario. This corresponds to a 2.1% reduction per year—faster than the 1.8% per year reduction observed during the 1990 –2003 period. Targets for emissions reductions necessitate still faster reductions, achieved by carbon intensity reductions beyond those embedded in BAU. For example, achieving a 30 GtCO2/yr target in 2030 produces a global economy where each ton of fossil-fuel CO2 is associated with $5100 of global GDP, i.e., a 3.4% reduction per year in global carbon intensity. Chakravarty et al. Fig. 3. Cartoon version of the capping scheme for generating national allocations. PNAS Early Edition 兩 3 of 5 SUSTAINABILITY SCIENCE Table 1. Regional reference emissions, population, emission allocation, and number of people affected for 2030 under a global target at 30 GtCO2, with (P) and without the poverty provision Annual Individual Emissions (in Tons of CO2) 50 U.S. China OECD minus U.S. Non−OECD minus China 30 45 40 35 30 25 20 15 10 5 0 100 200 300 400 500 600 700 800 900 1000 Cumulative Population Ranked According to Decreasing Annual CO2 Emissions (in Millions) Fig. 4. Regional emission distributions in 2030, revealing the number of individuals above the cap of 10.8 tCO2/yr (corresponding to a global target of 30 GtCO2 in 2030). The regional efforts are comparable: The U.S. has 270 million people who, relative to ‘‘Business As Usual’’ for 2030, in aggregate reduce emissions by 4.4 GtCO2; the OECD minus U.S. has 280 million who reduce 2.1 GtCO2; China has 300 million who reduce 2.9 GtCO2; and the non-OECD minus China has 280 million who reduce 3.5 GtCO2. In Table 1, the ninth and tenth columns show the national/ regional emission allocations when the 2030 target is modified to include this 1 tCO2 emission floor. The U.S. target falls by 0.34 GtCO2 (10%) and the African target rises by 0.8 GtCO2 (54%). Fig. 6. Individual emissions in 2030 when global emissions are 30 GtCO2 and a poverty provision is included that puts a floor on individual emissions at 1 tCO2, raising the emissions of 2.7 billion people who emit less than 1 tCO2 (green area at the right). The red strip at the left between the ‘‘30’’ and ‘‘30P’’ arrows shows the extra reduction required of the high emitters to provide the headroom to achieve this floor. Relative to the same climate goal without a poverty provision (‘‘30’’), the cap that includes this poverty alleviation objective (‘‘30P’’) is lowered from 10.8 to 9.6 tCO2, and 1.30 instead of 1.13 billion people are under the cap. more than the other regions; the U.S. has 185 million of the world’s 600 million people whose emissions exceed the relatively high (16.8 tCO2/year) individual cap of this policy. The additional emission cuts to comply with more stringent global targets decline for the U.S. but remain constant for China and Europe, 12 Summary of Results. Fig. 7 provides a summary of the national Emission in Bilion Tons of CO2 mitigation effort for 7 major regions in 2030. The bars show that the U.S. and China have the 2 highest CO2 abatement assignments. India mostly gets a free pass, but not Africa, due to high carbon intensity and inequality in South Africa and in North African nations with energy industries. Russia and the Middle East get sizeable mitigation assignments for the same reasons. The 5 GtCO2 increments from the weakest to the most stringent global policy are taken up differently by different regions. The mild global target of 35 GtCO2 affects the U.S. 10 8 GtCO2 15 14 13 12 11 10 9 8 7 6 5 4 3 2 1 0 1990 2003 BAU(42)−>35 35−>30 30−>25 25−>20 20 35P−>30P 30P−>25P 25P−>20P 20P Equal per−capita 35−>30 Equal per−capita 30−>25 Equal per−capita 25−>20 Equal per−capita 20 6 4 2 U.S. China OECD minus U.S. Non−OECD minus China 2005 2010 2015 Year 2020 0 U.S. 2025 2030 Fig. 5. Regional targets (solid lines) for a global emission trajectory that allows global emissions to peak at 33 GtCO2 in 2020 and to arrive at 30 GtCO2 in 2030. Dashed lines show the regional BAU emissions. 4 of 5 兩 www.pnas.org兾cgi兾doi兾10.1073兾pnas.0905232106 China OECD Eur. India Africa Russia Mid. East Fig. 7. Emissions in 7 of the 16 EIA regions, in 1990, 2003, and for the global mitigation policies of 35, 30, 25, and 20 GtCO2 in 2030, both with and without poverty provision. The last bar on the right for each region indicates the targets corresponding to an equal per capita allocation scheme and the same 4 global mitigation targets. A table with data for all of the 16 regions can be found in the SI Appendix. Chakravarty et al. Discussion and Conclusions The approach presented in this paper is motivated by the reality that emissions from OECD countries and from countries outside the OECD are now roughly equal, and therefore tough global atmospheric stabilization targets require the participation of the developing countries. In our interpretation of fairness, individuals who emit similar amounts of CO2, regardless of where they live, are expected to contribute to fossil-fuel CO2 emission reductions in similar ways. In principle, no country gets a pass, because even in the poorest countries some individuals have CO2 emissions above the universal emission cap. A well-designed national policy would contain costs and not exacerbate inequalities. Many of the lowest-cost opportunities for CO2 emission reduction over the next few decades in all countries, especially in the developing countries, will be found in the middle of the emission distribution, associated with billions of people of modest means. Many of them will be moving into cities for the first time and, in a CO2-responsive economy, would be housed in well-built apartment buildings equipped with efficient appliances and served by efficient mass transit systems. Thus, pursuing CO2 emission reduction across a wide swath of a country’s economy is likely to be preferable to capping the emissions of the high emitters only, as could be inferred from a literal interpretation of the horizontal cutoff in Fig. 2. Of the countless directions for further work, we note here only a few. It is important to develop more refined tools that reveal the high emitters in developing countries now hidden in the tails of the distributions—for example, in India. Direct measurement of the individual emission distribution using specially designed household surveys may achieve this objective. A better under1. den Elzen M, Hohne N (2008) Reductions of greenhouse gas emissions in annex I and non-annex I countries for meeting concentration stabilisation targets. Climatic Change 91:249 –274. 2. Baer P, Athanasiou T, Kartha S, Kemp-Benedict E (2008) The Greenhouse Development Rights Framework, 2nd Ed. (Heinrich Böll Foundation, Christian Aid, EcoEquity, and the Stockholm Environment Institute). 3. Agarwal A, Narain S (1991) Global Warming in an Unequal World: A Case of Environmental Colonialism. (Centre for Science and Environment, New Delhi, India). 4. Meyer A (2000) Contraction & Convergence: The Global Solution to Climate Change. (Green Books, Totnes, Devon). ISBN No. 1– 870098-94 –3. 5. Aslam MA (2002) in Building on the Kyoto Protocol: Options for Protecting the Climate, eds Baumert KA, Blanchard O, Llosa S, Perkaus J (World Resources Institute, Washington, DC), pp 175–202. Chakravarty et al. standing of changes in distributions over time, including the connection between the shape and growth of the emission distribution and the rate (and acceleration) of economic growth, would improve BAU emission projections. The detailed consequences of our scheme for international trading of emission allocations should be investigated and compared with EPC and other schemes. To review, our scheme requires only a globally agreed emission target and consensus regarding national BAU emissions.** Nations derive their obligations from the emissions of their high-emitting citizens, but are left free to decide on implementation policies at national and international levels. It easily accommodates periodic updating as projections of national emissions are revised and improved information about income and emission distributions is obtained. Our scheme does not take into account emissions from land use and non-CO2 greenhouse gases, emissions embedded in the trade of goods and services,†† differences in regional climate and country size, inertia restricting rates of change, and prior ‘‘legacy’’ emissions.‡‡ Our scheme can be viewed as a step toward allocation on the basis of equal per capita emission rights, but we do not get there in one step. We take into account high emitters above a global cap and low emitters below a global floor, but there is a gap between the cap and the floor. Further application of the underlying principles proposed here would bring about successive reductions of the high-emitter cap and increases of the emission floor, until eventually they converge. Perhaps our allocation framework can enrich the search for fair and uniform allocation rules governing the international post-2012 regime for climate change mitigation. **Substantial revisions of emission projections are now underway to take into account the current global recession, see for example http://www.eia.doe.gov/oiaf/aeo/. ††See for example refs. 10 and 11 for estimates of the emissions embodied in international trade of goods. ‡‡Usually, legacy emissions refer to past emissions of nations. In a scheme like ours, which is based on the emissions of individuals, legacy might be incorporated by redefining ‘‘high emitters’’ as those individuals with high lifetime emissions prior to a specific year. ACKNOWLEDGMENTS. We thank Robert Williams, Sivan Kartha, and John Holdren for useful discussions and Adrian Ross for contributions to an earlier version of this work. S.C., S.P., R.S., and M.T. are supported by the Carbon Mitigation Initiative at Princeton University, funded by BP and Ford Motor Co. A.C. acknowledges support from the Energy Technology Innovation Project, which is financially supported by the David and Lucile Packard Foundation, a gift from Shell Exploration and Production and unrestricted grants from BP Corporation. H.d.C. thanks the Princeton Environmental Institute for its hospitality and numerous colleagues at Energy Research Centre of the Netherlands and participants of COP13 in Bali for fruitful discussions. 6. World Bank (2007) World Development Indicators 2007 (The World Bank, Washington, DC). 7. Energy Information Administration (2007) International Energy Outlook (U.S. Department of Energy, Washington, DC). 8. UN (2006) World Population Prospects: The 2006 Revision (United Nations, New York, NY). 9. Shue H (1993) Subsistence emissions and luxury emissions. Law Policy 15:39 – 59. 10. Ahmad N, Wyckoff A (2003) Carbon dioxide emissions embodied in international trade of goods. OECD Science, Technology and Industry Working Papers 2003/15 (OECD Publishing, Paris). 11. Peters G, Hertwich E (2008) CO2 embodied in international trade with implications for global climate policy. Environ Sci Technol 42:1401–1407. PNAS Early Edition 兩 5 of 5 SUSTAINABILITY SCIENCE reflecting the progressive involvement of all regions as the individual emission cap tightens. Fig. 7 shows that allowing for the poverty provision of 1 tCO2 changes most national targets very little. An exception is Africa, which, as a result of its large carbon-poor population, now gets significantly higher allocations. The regional targets resulting from our poverty floor can be compared to the ones resulting from an equal-per capita (EPC) allocation scheme, where the 30 GtCO2 global emission target for 2030 is divided equally among the world’s expected 8.1 billion people, resulting in a universal individual allowance of 3.7 tCO2. (In the language of our proposal, the EPC allocation scheme lowers the individual emission cap and raises the poverty floor to the same value, here, for 2030, 3.7 tCO2/person.) Fig. 7 shows that all regions receive a more stringent target in the EPC scheme, with the exception of India and Africa, whose emission targets are significantly larger and roughly equal—due to their similar 2030 populations.
Download