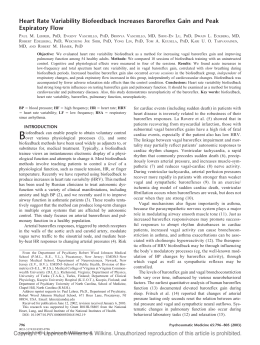
ORIGINAL RESEARCH
Responses of the geometric indices of heart rate
variability to the active orthostatic test in women
Luiz Carlos de Abreu,I Adriano L. Roque,II Bianca C.R. de Castro,III Ana C. Amorim de Souza,I
Luiz Carlos M. Vanderlei,III Lucas L. Ferreira,III Rodrigo D. Raimundo,I Fernando L.A. Fonseca,I
Vitor E. Valenti,I,II,III José R. CisternasI*
I
Departamento de Morfologia e Fisiologia, Faculdade de Medicina do ABC, Santo André, SP, Brazil IIDepartamento de Fonoaudiologia, Faculdade de
Filosofia e Ciências, Universidade Estadual Paulista, UNESP, Marı́lia, SP, Brazil IIIPrograma de Pós-Graduac ão em Fisioterapia, Faculdade de Ciências e
Tecnologia, Universidade Estadual Paulista (UNESP), Presidente Prudente, SP, Brazil, *In memoriam.
OBJECTIVES: The effects of the orthostatic test on the cardiovascular system have been investigated, but there
are no data on the behavior of the geometric indices of heart rate variability. We evaluated the effects of the
active orthostatic test on the geometric indices of heart rate variability in women.
METHOD: The study was performed on 12 healthy women between ages 18 and 30. For the analysis of heart rate
variability, heart rate was recorded beat-to-beat. The RR intervals were transformed into geometric figures, and
from these we calculated the triangular index, the triangular interpolation of RR intervals, the SD1, SD2 indexes
and the SD1/SD2 ratio, which were obtained from the Poincaré plot. Visual analysis of the plot was also
performed. For the test, participants quickly stood up from a seated position in 3 seconds or less, and remained
standing still for 15 minutes. Heart rate variability samples were collected at four moments: rest, 0-5 minutes, 510 minutes and 10-15 minutes at standing position.
RESULTS: The triangular index, the triangular interpolation of RR intervals, the SD1 and SD2 indices were reduced
(p , 0.05) at 10-15 minutes after the volunteers stood up from seated position. The SD1/SD2 ratio was decreased
at 0-15 minutes after the subjects changed from seated to orthostatic position.
CONCLUSION: The geometric indices of heart rate variability decreased in response to the active orthostatic test
in healthy women.
KEYWORDS: Autonomic Nervous System; Cardiovascular System; Nonlinear Dynamics; Physiology.
Abreu LC, Roque AL, Castro BCR, Souza ACA, Vanderlei LCM, Ferreira LL, Raimundo RD, Fonseca FLA, Valenti VE, Cisternas JR. Responses of the
geometric indices of heart rate variability to the active orthostatic test in women. MEDICALEXPRESS. 2014;1(6):351-355.
Received for publication on October 5 2014; First review completed on November 5 2014; Accepted for publication on November 17 2014
*E-mail: [email protected]
B INTRODUCTION
The autonomic nervous system regulates the cardiovascular system, and its dysfunction characterizes some
pathological conditions.1 – 3 Heart rate variability (HRV)
describes the complex regulatory system interaction
between heart rate and the autonomic nervous system.
This is a conventionally accepted term to describe the
fluctuations in the intervals between consecutive heartbeats
(RR intervals), which are known to be controlled by the
sinusal node.4
Methods used for HRV analysis include the geometric
methods, namely the triangular index (RRtri), the triangular
interpolation of NN interval histogram (TINN) and the
Poincaré plot, which converts RR intervals into geometric
patterns and allows an analysis of HRV through the
geometric or graphic properties of the resulting pattern.5
DOI: 10.5935/MedicalExpress.2014.06.11
The RRtri and TINN are calculated from the construction
of a histogram of density of normal RR intervals, which
contains (on the “x” axis) the length of RR intervals, and (on
the “y” axis), the frequency with which they occurred.
Joining the points of the histogram columns results in a
triangle from which these indexes may be extracted.6,7
The Poincaré plot is a two-dimensional graphic representation of the correlation between consecutive RR intervals, in
which each interval is plotted against the following interval.
Its analysis can be done qualitatively by assessing the shape
formed by its attractor, which shows the degree of complexity of RR intervals, or quantitatively, by fitting an ellipse to
the shape formed by the plot, from which the following
indexes are produced: SD1, SD2 and the SD1/SD2 ratio.8
Moreover, the analysis of the Poincaré plot is considered by
some experts as based on nonlinear dynamics.8
HRV analysis by means of nonlinear methods has been
gaining increasing interest, since there is evidence that the
mechanisms involved in cardiovascular regulation probably
interact in a nonlinear way.8
Copyright q 2014 MEDICALEXPRESS. This is an open access article distributed under the terms of the creative commons attribution
Non-Commercial License (http://creativecommons.org/licenses/by-nc/3.0/) which permits unrestricted non-commercial use, distribution,
and reproduction in any medium, provided the original work is properly cited.
351
Heart rate variability to the active orthostatic test
Luiz Carlos de Abreu et al.
Cardiovascular evaluation tests may provide relevant
information about the adequate function of the autonomic
nervous system and about the functional capacity of
effectors (heart and vessels) and other associated structures.
One common cardiovascular test used in clinical practice is
the orthostatic test, which is based on the measurement of
heart rate reflex changes in response to adequate stimuli; this
test may be applied passively or actively. Application of
cardiovascular tests may be used for the study of
cardiovascular system control in healthy subjects as well as
in adult patients with different diagnoses of autonomic
dysregulation.9
Previous studies investigated spectral analysis of HRV in
response to the Active Orthostatic Test.10,11 Nevertheless,
nothing is known regarding the effects of this test on the
geometric indices of HRV and the recovery of the indices.
The understanding of the physiological responses induced
by autonomic tests is important to develop future therapies
and to prevent cardiovascular disorders. Therefore, we
investigated the effects of the Active Orthostatic Test on the
geometric indices of HRV in healthy women.
B METHODS
Study Population
We analyzed 12 healthy female subjects aged between 18
and 30 years, selected from our Institution. All of them were
volunteers and were informed about the procedures and
objectives of the study and, after agreeing, signed a term of
informed consent. All study procedures were approved by
the Ethics Committee in Research of the Faculty of Sciences
of the Universidade Estadual Paulista, Campus of Marilia
(Case No. CEP-2011-382); the entire procedure followed the
procedures laid down by Resolution 196/96, National
Health Council, dated 10/10/1996.
Exclusion criteria
We considered the following exclusion criteria: cardiopulmonary disorders, neurological and other impairments
that prevent the subject to perform the procedures, and
treatment with drugs that influence cardiac autonomic
regulation.
Initial Evaluation
Before the experimental procedure, volunteers were
identified through the following information: age, gender,
weight, height and body mass index (BMI). Anthropometric
measurements were obtained according to Lohman et al.12
Weight was determined by using a digital scale (W 200/5,
Welmy, Brazil) with a precision of 0.1kg. Height was
determined by using a stadiometer (ES 2020, Sanny, Brazil)
with a precision of 0.1 cm and 2.20 m of extension. Body mass
index was calculated using the formula BMI ¼ weight (kg)/
height (m)2. We also measured systolic and diastolic blood
pressure and heart rate.
Experimental protocol
Data were collected in our laboratory under controlled
temperature (218C – 258C) and humidity (50% – 60%);
volunteers were instructed to avoid consuming alcohol,
caffeine and substances that influence the autonomic
nervous system for 24 hours before evaluation. Data were
collected between 8:00 and 12:00 a.m. in order to cancel the
interference of circadian rhythms. All procedures necessary
352
MEDICALEXPRESS 2014;1(6):351-355
for the data collection were explained to the participants, and
the subjects were instructed to remain at rest and to avoid
talking during the data collection.
After the initial evaluation, the heart monitor strap was
placed on each subject’s thorax over the distal third of the
sternum. The HR receiver (Polar RS800CX monitor, Polar
Electro OY, Kempele, Finland) was placed on the wrist.
The subjects remained seated, breathing spontaneously for
10 minutes. After this rest, they quickly stood up from the
seated position in 3 seconds or less in response to a verbal
command and remained standing for 15 minutes.
HRV analysis
The R-R intervals recorded by the portable heart rate
monitor (with a sampling rate of 1000 Hz) were downloaded
to the Polar Precision Performance program (v. 3.0, Polar
Electro, Finland). The software enabled the visualization of
heart rate and the extraction of a cardiac period (R-R
interval) file in “txt” format. Following digital filtering
complemented with manual filtering for the elimination of
premature ectopic beats and artifacts, at least 256 R – R
intervals were used for the data analysis. Only those series
with more than 95% sinus rhythm was included in the
study.13,14 Heart rate variability samples were collected in
the following moments: seated rest with spontaneous
breathing, 0-5 minutes, 5-10 minutes, and 10-15 minutes at
standing position. For calculation of the indices we used the
HRV Analysis software (Kubios HRV v.1.1 for Windows,
Biomedical Signal Analysis Group, Department of Applied
Physics, University of Kuopio, Finland).15
Geometric indices of HRV
HRV analysis was performed by means of geometrical
methods: RRtri, TINN and Poincaré plot (SD1, SD2, SD1/
SD2 ratio).
The RRtri was calculated from a constructed density
histogram of RR intervals, which contains, on the horizontal
axis, all possible values of RR intervals measured on a
discrete scale with 7.8125 ms boxes (1/128 seconds); on the
vertical axis, the plot contained the frequencies with which
each value occurred. The union of points of the histogram
columns creates a triangular shape. The RRtri was obtained
by dividing the total number of RR intervals used to
construct the histogram by their modal frequency (RR
interval value that most frequently appeared on RR.)16
The TINN consists of the measure of the base of a triangle.
The method of least squares is used to determine the
triangle.4 The RRtri and the TINN express the overall
variability of RR intervals.4
The Poincaré plot is a map of points in Cartesian
coordinates, constructed from the values of RR intervals
obtained, where each point is represented on an “x” axis
(horizontal/abscissa) by the previous normal RR interval,
and on a “y” axis (vertical/ordinate), by the following RR
interval.
For quantitative analysis of the plot, an ellipse was fitted to
the points of the chart, with the center determined by the
average RR intervals. The SD1 indexes were calculated to
measure the standard deviation of the distances of the points
to the diagonal y ¼ x, and SD2 measures the standard
deviation of the distances of points to the line y ¼ 2 x þ
RRm, where RRm is the average of RR intervals.
The SD1 is an index of instantaneous recording of the
variability of beat-to-beat and represents parasympathetic
MEDICALEXPRESS 2014;1(6):351-355
Heart rate variability to the active orthostatic test
Luiz Carlos de Abreu et al.
activity, while SD2 is an index that represents HRV in longterm records, and reflects the overall variability. Their ratio
(SD1/SD2) shows the ratio between short and long
variations of RR intervals.17,18
The qualitative analysis of the plot was made through the
analysis of the figures formed by its attractor, which as
described by Tulppo et al.19 in (a) a figure in which an
increase in the dispersion of RR intervals is observed with
increased intervals, characteristic of a normal plot; (b) a small
figure with beat-to-beat global dispersion without increased
dispersion of RR intervals in the long term.
Table 2 - Mean and standard deviation for geometric
indices of HRV between before and after volunteers stood
up. RRtri: triangular index; TINN: triangular interpolation
of RR intervals; SD1; SD2 and SD1/SD2 ratio.
Index
RRtri
TINN
SD1
SD2
SD1/SD2
Control
0-5 min
5-10 min
10-15 min
p
13.1 ^ 5
201.3 ^ 23
22 ^ 8
58.8 ^ 15
0.34 ^ 0.2
11.1 ^ 4
200.4 ^ 54
13.9 ^ 6
62 ^ 11
*0.22 ^ 0.09
8.6 ^ 5
172 ^ 60
12.6 ^ 6
53.2 ^ 11
*0.22 ^ 0.08
*7.2 ^ 3
*150 ^ 39
*11.8 ^ 4
*47 ^ 10
*0.24 ^ 0.06
0.012
0.031
0.015
0.038
0.0023
*p , 0.05: Vs. Control
Statistical Analysis
Standard statistical methods were used for the calculation
of means and standard deviations. Normal Gaussian
distribution of the data was verified by the Shapiro-Wilk
goodness-of-fit test (z value . 1.0). For parametric distributions, we applied ANOVA for repeated measures
followed by the Bonferroni post test (SDNN, alpha-2 and
alpha-1/alpha-2). For non-parametric distributions, we used
the Friedman test followed by the Dunn’s test (RMSSD,
pNN50, LF, HF, LF/HF and alpha-1). We compared the HRV
indices between the four moments (seated rest vs. 0-5 min
after the volunteers stood up, vs. 5-10 min after the
volunteers stood up, and vs. 10-15 min after the volunteers
stood up). Differences were considered significant when the
probability of a Type I error was less than 5% (p , 0.05).
We used the Software GraphPad StatMate version 2.00 for
Windows, GraphPad Software, San Diego California USA.
B RESULTS
Table 1 presents the values regarding basal diastolic and
systolic arterial pressure, heart rate, mean RR, weight, height
and body mass index of the volunteers. All volunteers
exhibited normal parameters. The mean RR and mean HR
indicate that the volunteers were not athletes.
Table 2 presents data related to the geometric indices
before and after the subjects stood up. All indices were
reduced after the change from seated to standing. RRtri,
TINN, SD1 and SD2 were reduced at 10-15 minutes after the
volunteers stood up (seated control vs. 10-15 minutes) while
the SD1/SD2 ratio was decreased at the three investigated
moments (seated control vs. 0-5 minutes vs. 5-10 minutes vs.
10-15 minutes).
Figure 1 presents examples of Poincaré plot patterns
drawn from one patient for the four moments evaluated.
Figure 1A shows a good dispersion of points, characteristics
of a normal plot, whereas 1B, 1C and 1D show a decrease in
Table 1 - Height, Weight, Body Mass Index, Baseline
Systolic and diastolic arterial pressure, heart rate, and
mean RR interval of 12 female volunteers enrolled in this
study.
Parameter
Mean ^ Std deviation
Height (m)
Weight (kg)
Body Mass Index (kg/m2)
Systolic Arterial Pressure (mmHg)
Diastolic Arterial Pressure (mmHg)
Heart Rate (bpm)
Mean RR (ms)
1.67 ^ 0.03
54.6 ^ 23
21.2 ^ 2
101.3 ^ 16
78 ^ 11
75.4 ^ 8
761.6 ^ 81
dispersion, characterizing a reduction in HRV and an
increase in the sympathetic component.
B DISCUSSION
Our investigation aimed to evaluate the behavior of the
geometric indices of HRV in response to the Active
Orthostatic Test. We report that the RRtri, TINN, SD1 and
SD2 indices were reduced at 10-15 minutes after the
volunteers stood up. The SD1/SD2 ratio was decreased
over the entire 15 minutes after the subjects changed from
seated to standing. Our findings support the concept that the
geometric indices of HRV are a reliable tool of measurements
to evaluate the orthostatic test.
The reduced values of SD1 at 10-15 minutes after the
volunteers stood up indicate reduced parasympathetic
activity at that time. This index measures short-term HRV
and represents the transverse axis of the Poincaré plot. It also
corresponds to the standard deviation of the instantaneous
variability of heart rate beat-by-beat.20 And it indicates the
parasympathetic influence on the sinoatrial node.21 Considering the reaction of this index to the change from seated
to standing, we suggest that the parasympathetic activity
reduction in response to this physiological stimulation is
more intense at 10-15 minutes after the participants stood up.
Similarly, the SD2 index, which is related to the global
HRV, was also decreased at 10-15 minutes after the subjects
stood up from the seated position. The physiological
significance of the SD2 index is less well-defined compared
with the SD1 index. This index is thought to be related to the
continuous long-term variability of the R-R interval.22
Variables that characterize the Active Orthostatic Test are
mostly expressed by sympathetic and vagal influences on
the heart rate.9 Our study supports the idea that the SD1 and
SD2 indices are valuable markers for the Active Orthostatic
Test evaluation.
The visual analysis (qualitative) of the Poincaré plot
indicated reduction of HRV mainly during the first
10 minutes after the volunteers stood up. Nevertheless,
SD1, SD2, TINN and RRtri indices were reduced at
10-15 minutes. The dynamics of the cardiac autonomic
regulation is assumed to be nonlinear. Consequently,
nonlinear methods have been applied to the analysis of
HRV.22 The Poincaré plot, also known as Lorenz plot, is one
of these techniques.8 As previously mentioned, it is a
scatterplot of each RR interval as a function of the previous
one. This method was first used as a qualitative instrument.8
and later, the quantification of the Poincaré plot geometry
was proposed. Specifically, Tulppo et al (1996)17 fit an ellipse
to the shape of the Poincaré plot to calculate HRV indices, for
353
Heart rate variability to the active orthostatic test
Luiz Carlos de Abreu et al.
MEDICALEXPRESS 2014;1(6):351-355
Figure 1 - Visual pattern of Poincaré plot observed in one subject at seated position (1A), 0-5 minutes after the subjects stood up (1B) 510 minutes after the subjects stood up (1C) and 10-15 minutes after the subjects stood up (1D). 1A shows a good dispersion of points,
characteristics of a normal plot, whereas 1B, 1C and 1D show a decrease in dispersion, characterizing a reduction in HRV and increase in
the sympathetic activity.
instance, the standard deviation of instantaneous beat-tobeat RR interval variability, or SD1. Taken together, it is
possible that the Poincaré plot, although a subjective
method, may be more sensitive than the quantitative
geometric analysis of HRV in response to the Active
Orthostatic Test.
According to our data, the geometric indices of HRV were
significantly changed at 10-15 minutes after the volunteers
stood up from seated position. Clinical application of
autonomic tests, such as the Active Orthostatic Test, may
be used for cardiovascular system examination study in
healthy individuals and also in patients with different
diseases.9 However, to the best of our knowledge, no
previous study investigated the physiological responses of
the geometric indices of HRV during a period after change
from seated to orthostatic position. In this study we suggest
that in healthy women the more intense responses occur at
10-15 minutes after the volunteer stood up.
The comprehension of the mechanisms involved in the
autonomic cardiovascular tests helps to correctly interpret
the results. Our findings are important to support the
analysis of the geometric indices of HRV in response to the
Active Orthostatic Test, a well-recognized autonomic test.23
The Poincaré plot was also found to be a good marker for
354
autonomic change in response to the change from seated to
orthostatic position.
We should address a limitation of our study that is the
small population based on women health students. In this
circumstance, we should be careful when extrapolating data
to different population.
B CONCLUSION
The geometric indices of HRV were reduced in response to
the Active Orthostatic Test in healthy women. We believe
that the qualitative analysis is more sensitive than the
quantitative analysis in this autonomic test.
B ACKNOWLEDGEMENTS
This research was supported by public funding from Fundac ão de Amparo à
Pesquisa do Estado de São Paulo-FAPESP.
B RESUMO
OBJETIVOS: Os efeitos do teste ortostático sobre o sistema cardiovascular já
foram investigados, mas não há dados sobre o comportamento dos ı́ndices
geométricos de variabilidade da frequência cardı́aca. Aqui, foram avaliados os
MEDICALEXPRESS 2014;1(6):351-355
efeitos do teste ortostático ativo nos ı́ndices geométricos de variabilidade da
frequência cardı́aca em mulheres.
MÉTODO: O estudo foi realizado em 12 mulheres saudáveis com idades entre
18 e 30 anos. Para a análise da variabilidade da frequência cardı́aca, este
parâmetro foi registrado batimento a batimento. Os intervalos RR foram
transformados em figuras geométricas e, a partir destas, foi calculado o ı́ndice
triangular, a interpolac ão triangular dos intervalos RR, o SD1, SD2 e a relac ão
SD1/SD2, que foram obtidos a partir da plotagem de Poincaré. A análise
visual do gráfico foi também realizada. Para o teste, os participantes
levantaram-se rapidamente de uma posic ão sentada (em 3 segundos ou
menos) e permaneceram imóveis, de pé, por 15 minutos. Amostras de
variac ão de frequência cardı́aca foram coletadas em quatro momentos:
repouso, 0-5 minutos, 5-10 minutos e 10-15 minutos a pé.
RESULTADOS: O ı́ndice triangular, a interpolac ão triangular dos intervalos
RR, o SD1 e SD2 ı́ndices apresentaram-se reduzidos (p , 0,05) no intervalo
10-15 minutos depois de os voluntários se levantarem. A relac ão SD1/SD2
apresentou-se reduzida durante o intervalo 0-15 minutos depois dos
participantes passarem à posic ão ortostática.
CONCLUSÃO: Os ı́ndices geométricos de variabilidade da freqüência
cardı́aca diminuiram em resposta ao teste ortostático ativo em mulheres
saudáveis.
B REFERENCES
1. Grupi CJ, Moffa PJ, Barbosa SA, Sanches PC, Barragan Filho EG, Bellotti
GM, Pileggi FJ. Holter monitoring in Chagas’ heart disease. Sao Paulo
Med J. 1995;113(2):835-40.
2. Amorim DD, Marin Neto JA. Functional alterations of the autonomic
nervous system in Chagas’ heart disease. Sao Paulo Med J.
1995;113(2):772-84.
3. dos Santos JF, Cavalcante EM, Camano L, Bertini AM. Physiological basis
for the analysis of fetal heart rate. Rev Paul Med. 1988;105(5):261-6.
4. Task Force of the European Society of Cardiology and the North American
Society of Pacing and Electrophysiology. Heart rate variability: standards
of measurement, physiological interpretation and clinical use. Circulation. 1993;93(5):1043-65.
5. Rajendra Acharya U, Paul Joseph K, Kannathal N, Lim CM, Suri JS. Heart
rate variability: a review. Med Biol Eng Comput. 2006;44(12):1031-51.
6. Brunetto AF, Silva BM, Roseguini BT, Hirai DM, Guedes DP. Limiar
ventilatório e variabilidade da frequência cardı́aca em adolescentes. Rev
Bras Med Esporte. 2005;11(1):22-7.
7. Voss A, Kurths J, Kleiner HJ, Witt A, Wessel N, Saparin P, et al. The
application of methods of non-linear dynamics for the improved and
predictive recognition of patients threatened by sudden cardiac death.
Cardiovasc Res. 1996 Mar;31(3):419-33.
Heart rate variability to the active orthostatic test
Luiz Carlos de Abreu et al.
8. Huikuri HV, Makikallio TH, Perkiomaki J. Measurement of heart rate
variability by methods based on nonlinear dynamics. J Electrocardiol.
2003;36(Suppl):95-9.
9. Ziegler D. Diabetic cardiovascular autonomic neuropathy: prognosis,
diagnosis and treatment. Diabetes Metab Rev. 1994;10(4):339-83.
10. Tonhajzerová I, Javorka K, Javorka M, Petrásková M. Cardiovascular
autonomic nervous system tests: reference values in young people (15-19
years) and influence of age and gender. Clin Physiol Funct Imaging.
2002;22(6):398-403.
11. Pichon A, Roulaud M, Antoine-Jonville S, de Bisschop C, Denjean A.
Spectral analysis of heart rate variability: interchangeability between
autoregressive analysis and fast Fourier transform. J Electrocardiol.
2006;39(1):31-7.
12. Lohman TG, Roche AF, Martorell R. Anthropometric Standardization
Reference Manual. Champaign: Human Kinetics Books; 1998.
13. Selig FA, Tonolli ER, Silva EV, Godoy MF. Heart rate variability in preterm
and term neonates. Arq Bras Cardiol. 2011;96(6):443-9.
14. Manzano BM, Vanderlei LC, Ramos EM, Ramos D. Acute effects of
smoking on autonomic modulation: analysis by Poincaré plot. Arq Bras
Cardiol. 2011;96(2):154-60.
15. Niskanen JP, Tarvainen MP, Ranta-Aho PO, Karjalainen PA. Software for
advanced HRV analysis. Comput Methods Programs Biomed.
2004;76(1):73-81.
16. Dias de Carvalho T, Marcelo Pastre C, Claudino Rossi R, de Abreu LC,
Valenti VE, et al. Geometric index of heart rate variability in chronic
obstructive pulmonary disease. Rev Port Pneumol. 2011;17(6):260-5.
17. Tulppo MP, Kiviniemi AM, Hautala AJ, Kallio M, Seppänen T, Mäkikallio
TH, et al. Physiological background of the loss of fractal heart rate
dynamics. Circulation. 2005;112(3):314-9.
18. James DV, Reynolds LJ, Maldonado-Martin S. Influence of the duration of
a treadmill walking bout on heart rate variability at rest in physically
active women. J Phys Act Health. 2010;7(1):95-101.
19. Tulppo MP, Makikallio TH, Takala TES, Seppanen T, Huikuri HV.
Quantitative beat-to-beat analysis of heart rate dynamics during exercise.
Am J Physiol. 1996;271(1 Pt 2):H244-52.
20. Bergstrom B, Lilja B, Rosberg K, Sundkvist G. Autonomic nerve function
tests. Reference values in healthy subjects. Clin Physiol. 1986;6(6):523-8.
21. Goldstein B, Buchman TG. Heart rate variability in intensive care.
J Intensive Care Med. 1998;13(5):252-65.
22. Denton TA, Diamond GA, Helfant RH, Khan S, Karagueuzian H.
Fascinating rhythm: a primer on chaos theory and its application to
cardiology. Am Heart J. 1990;120(6 Pt 1):1419-40.
23. Woo MA, Stevenson WG, Moser DK, Trelease RB, Harper RM. Patterns of
beat-to-beat heart rate variability in advanced heart failure. Am. Heart J.
1992;123(3):704-10.
355
Baixar