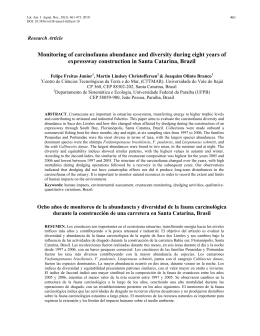
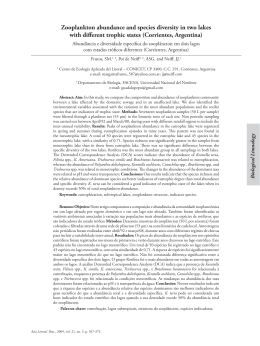
Rev. bras. paleontol. 11(1):5-10, Janeiro/Abril 2008
© 2008 by the Sociedade Brasileira de Paleontologia
USE OF THE RANDOM SETTLING TECHNIQUE IN QUANTITATIVE
STUDIES OF CALCAREOUS NANNOFOSSILS IN THE NW
SOUTH ATLANTIC OCEAN
HELIANE BEVERVANSO FERRARESE, FELIPE ANTONIO DE LIMA TOLEDO,
JULIANA PEREIRA DE QUADROS & KAREN BADARACO COSTA
Laboratório de Paleoceanografia do Atlântico Sul, LaPAS, Instituto Oceanográfico, USP, 191, 05508-900, São Paulo,
SP, Brasil. [email protected], [email protected], [email protected]
ABSTRACT – Paleoceanographic surveys can be performed from the quantitative study of calcareous nannofossils since
variations in the nannoflora through time indicate a biotic response to environmental changes. In this study, two preparation
techniques of calcareous nannofossils slides - the conventional smear slide and the random settling techniques - were
compared in order to investigate which method is better in quantitative studies for paleoceanographic reconstructions. The
adaptation of sample preparation methods allows studies of relative and absolute abundances of calcareous nannofossils.
Although the random settling technique requires a much longer preparation time, it allows the calculation of the number of
coccoliths per gram of sediment. This, together with the relative abundance and stable oxygen and carbon isotopic data
allowed a more detailed analysis of paleotemperature and paleoproductivity. The Gephyrocapsa genus showed good
correlations with δ18O and δ13C, indicating an influence of temperature and nutrient availability on the abundance of this
genus.
S
A
V
O
R
P
Key words: Calcareous nannofossils, quantitative studies, paleoceanography, preparation techniques.
RESUMO – Levantamentos paleoceanográficos podem ser realizados a partir do estudo quantitativo de nanofósseis
calcários, uma vez que alterações na composição da nanoflora, ao longo do tempo geológico, indicam uma resposta biótica
às mudanças ambientais. No presente trabalho foram comparadas duas técnicas de preparação para nanofósseis calcários, a
fim de se demonstrar qual a mais adequada para uso em estudos quantitativos em reconstruções paleoceanográficas. A
adaptação de métodos de preparação de amostras permite comparar abundâncias relativas e absolutas em estudos de
nanofósseis calcários. As técnicas utilizadas foram descritas anteriormente e diferem basicamente no tempo de preparação
das lâminas e na precisão da análise quantitativa. A preparação de lâminas de nanofósseis calcários, a partir da técnica de
decantação aleatória, permite o cálculo do número de cocolitos por grama de sedimento, e este, aliado às abundâncias
relativas e dados isotópicos de oxigênio e carbono, possibilita uma análise mais detalhada da paleotemperatura e
paleoprodutividade. O gênero Gephyrocapsa mostrou boas correlações com δ18O e δ13C, indicando uma influência da
temperatura e da disponibilidade de nutrientes na abundância deste gênero.
Palavras-chave: Nanofósseis calcários, estudos quantitativos, paleoceanografia, técnicas de preparação.
INTRODUCTION
The distribution of calcareous nannoplankton is strongly
influenced by climatic and oceanographic conditions. They
are widespread throughout the oceans and are important
indicators of oceanographic changes with different species
being sensitive to climatic change and variations in nutrient
contents (Mostajo, 1986; Roth, 1994; Flores & Sierro, 1997;
Henriksson, 2000; Herrle, 2003; Buccianti & Esposito, 2004).
As a result of their extensive occurrence, great abundance
in deep-sea sediments, rapid evolution and exclusively
planktonic nature, calcareous nannofossils have been broadly
employed in biostratigraphy (Young, 1991; Okada, 2000),
geochemistry (Buccianti & Esposito, 2004; Thierstein et al.,
1977; Steinmetz, 1994), biogeography (Okada, 1992; Roth,
1994), and paleoceanography-paleoclimatology (Giraudeau,
1992; Beaufort et al., 1997; Toledo, 2000; Buccheri et al., 2002).
Biogenic oozes are chiefly composed of calcareous or
siliceous tests of marine organisms. For paleoclimatic studies,
the most important calcareous materials are the tests of
foraminifera and the much smaller tests, and/or tests
fragments, of calcareous nannofossils informally known as
coccoliths (Bradley, 1999).
Calcareous nannoplanktons are an important part of the
phytoplankton in the marine realm and have been one of the
major open-ocean primary producers since the Triassic. They
are also the most productive carbonate-secreting organisms
on earth (Baretta-Bekker et al., 1998). The coccoliths, minute
calcified plates produced by haptophyte algae, are a major
component of pelagic carbonates (Roth, 1994).
5
6
REVISTA BRASILEIRA DE PALEONTOLOGIA,11(1), 2008
In paleoenvironmental studies, quantitative analyses
(absolute and relative abundances) as well as qualitative ones
(assemblage composition) are of great significance. However,
the long-term abundance fluctuations and rapid evolutionary
rates of calcareous nannofossil are only evident when
quantitative studies are performed.
Different species in various abundances characterize
equatorial to subpolar regions (McIntyre & Bé, 1967; Okada
& Honjo, 1973; Winter et al., 1994). Time-progressive
variations in the composition of calcareous nannofossils
indicate biological responses to environmental changes
(Matsuaoka & Okada, 1989). In order to estimate coccoliths
abundance in sediments and identify fossil associations,
conventional counting methods are employed (Okada, 1983;
Okada, 1992).
The aim of the present study is to make a quantitative
study of calcareous nannofossils in the NW South Atlantic
Ocean by using the random settling technique in order to
observe paleoceanographical changes in the last 30 kyr.
The traditional techniques of slide preparation only
allow an assessment of the relative abundance of calcareous
nannofossil’s species. Relative abundance gives a good
indication of the general assemblage character, but
percentage data could mask inherent species-by-species
variations. This technique has been broadly employed in
Brazilian studies.
Conversely, Flores & Sierro (1997) proposed a random
settling technique. This is a rapid and easy method to obtain
slides on which the coccoliths are evenly distributed, and
presents a possibility of standardizing the procedure and
producing large series of samples in order to save time.
Random settling technique also allows estimating
coccolith absolute abundances in number of coccolith
specimens per gram of sediments, by converting the amount
of calcareous nannofossils into nannofossil fluxes when
precise age models and sediment densities are available
(Flores & Sierro, 1997; Ferreira & Cachão, 2003).
S
A
V
O
R
P
MATERIAL AND METHODS
Sixteen deep-sea sediment samples (sample intervals of
10 cm) from one high-resolution piston-core (ESP-8)
recovered from Campos Basin (21º18’41’’S, 39º04’00’’W; 1,995
m water depth; Figure 1) were prepared by the random settling
technique.
The chronological framework of the core was based on
the correlation of the oxygen isotopic record of benthic
foraminifers with the SPECMAP chronology of Martinson et
al. (1987), as well as Accelerator Mass Spectrometer
radiocarbon datings based on two samples of monospecific
planktonic foraminifer Globigerinoides ruber (Table 1). The
data were compared with the oxygen and carbon isotope
record (Toledo, 2000).
Procedures (after Flores & Sierro, 1997)
A total of 0.100 g of dried sediments were weighed using
a microbalance (Digimed KN500). The materials were diluted
Figure 1. Location map of Core ESP-8.
in 10 ml buffering water (0.2 g NaHCO3, 0.15 g Na2CO3 and
0.08 g of unflavoured gelatine “Gold Gelatine” per litter of
distilled water). The gelatine was added to the solution to
reduce natural surface tension. After the mixture had been
vigorously shaken and then left to settle for three minutes,
the upper solution was dropped onto a settling device
(nannodrome) which includes a coverslide (4 cm x 2.5 cm)
previously placed on the bottom of a Petri dish (25.518 cm2).
The mixture was kept on a stable, horizontal surface under
room temperature settling for at least 12 hours. After this
time the fine fraction completely deposited and the water
was drained carefully using short strips of filter paper. Then
the disk was transferred to a heater at a temperature of about
60°C. When the disk dried a coverslide was mounted with
Canada balsam.
Table 1. ESP-8 chronology.
Depth (cm)
Age (kyr)
0
0.21
7
2.48
13
4.38
19
6.28
25
8.18
31
10.08
37
11.98
45
14.51
51
16.41
57
18.31
64
20.42
70
22.23
76
24.03
82
25.84
89
27.95
99
29.98
FERRARESE ET AL. – QUANTITATIVE STUDIES OF CALCAREOUS NANNOFOSSILS
S
A
V
O
R
P
7
Figure 2. Relative (continuous lines) and absolute (dashed lines) abundances. A, Emiliania huxleyi; B, Gephyrocapsa sp.; C, Florisphaera
profunda; and oxygen (D) and carbon isotope (E) records.
Quantitative analyses
In order to estimate absolute and relative abundance of
calcareous nannofossils, the 16 slides were examined using
an Olympus BX-41 light microscope under cross-polarized
and transmitted light at 600x and 1000x magnification.
Quantitative analyses were performed by counting at least
300 specimens in random fields of view (Okada, 1992; Roth,
1994).
The relative abundance was determined in each sample.
Although relative abundance gives indications of alterations
in dominance of different species in the assemblages it
contains very little information about the absolute numbers
of specimens of these species in the group (Henriksson,
2000). The fixed sum constraint on percentage data has an
effect on the relative abundance data, i.e., if one species
increases, others must decrease.
Absolute abundance (AA) of nannofossils expressed in
number of specimens per gram of sediments (nanno/g) was
then estimated using the following formula:
AA = n x (V/Vp) x (Pa/Ao) x 1/W,
where n = number of specimens counted, V = volume of
water added to the dry sediment (10 ml), Vp = volume dropped
onto the Petri disk, Pa = area of the Petri disk, Ao = area of one
fields of view, and W = weight of sediments (Flores & Sierro,
1997).
RESULTS
Relative abundances of calcareous nannofossil species
obtained are reported in Table 2. Nannofossil absolute
abundances estimated by random settling technique are
presented in Table 3.
According to AMS dating and oxygen isotopes, the
samples comprise the Marine Isotopic Stages (MIS) 1, 2 and
3. MIS 2 comprises Last Maximum Glacial (23-19 kyr) (Mix et
al., 2001). The absolute and relative abundances of all 11
species observed and counted vary throughout the core.
Florisphaera profunda is the most abundant calcareous
nannofossil species. The relative abundance ranges from
36.57% to 52.92% (mean 44.74%), and the absolute abundance
varies from 2.94 x 10¹² to 1.08 x 10¹³ nanno/g (Figure 2B).
The second most frequent species is Gephyrocapsa sp.
(23.90% to 42.52%, mean 33.2%; 2.82 x 10¹² to 6.85 x 10¹²
nanno/g) (Figure 2C). It is followed by Emiliania huxleyi
which ranges from 4.56% to 14.34% (mean 9.45%) in relative
abundance and from 6.36 x 10¹¹ to 1.99 x 10¹² nanno/g in
absolute abundance (Figure 2A).
The other subordinate species observed represent less
than 10% of total calcareous nannofossil assemblages. Those
species representing less than 6% reach a maximum 1.00 x
1012 nanno/g.
The major absolute and relative abundance of F. profunda
during MIS 2 and 3 and a drop in its values in MIS 1 contrasts
with Gephyrocapsa sp. relative abundance behaviour, which
tends to be pronounced all throughout MIS 1 and reduced
during MIS 2 and 3. On the other hand, its absolute abundance
is slightly higher in MIS 2 and 3 than in MIS 1.
There is an opposite behaviour in abundance between F.
profunda and Gephyrocapsa throughout the core. These
variations clearly characterize the Pleistocene/Holocene
boundary (MIS 2-1) at 12 kyr (37 cm) and MIS 3-2 at 22kyr (70
REVISTA BRASILEIRA DE PALEONTOLOGIA,11(1), 2008
8
Depth
(cm)
C. cristatus
C. leptoporus
C. murrayi
C. pelagicus
E. huxleyi
F. profunda
Gephyrocapsa sp.
H. carteri
Pontosphaera sp.
R. clavigera
Syracosphaera sp.
Umbellosphaera sp.
Table 2. Relative abundances of calcareous nannofossils species in Core ESP-8.
0
0.31
0.61
0.77
0.00
9.83
51.46
26.42
2.00
0.00
2.46
1.84
2.30
7
0.00
0.32
0.32
0.00
1.41
48.26
27.92
0.79
0.00
0.47
2.37
2.37
13
0.20
1.41
0.00
0.00
14.34
36.57
37.78
2.02
0.00
1.01
2.83
1.21
19
0.18
0.73
0.73
0.00
13.53
44.42
32.91
0.91
0.00
0.37
1.83
1.83
25
0.00
1.34
0.76
0.00
12.43
38.81
38.05
2.29
0.00
1.34
1.53
1.72
31
0.18
1.43
0.71
0.00
8.91
43.85
37.08
1.07
0.18
1.43
2.50
2.14
37
0.00
0.66
1.33
0.00
6.98
39.37
42.52
1.50
0.00
1.83
2.49
1.83
45
0.16
0.31
1.09
0.00
8.84
51.63
28.53
1.40
0.47
51
0.00
1.30
1.13
57
0.16
0.94
1.10
64
0.29
1.45
1.89
70
0.65
0.49
1.47
76
0.00
1.66
1.36
82
0.16
1.93
1.28
89
0.00
1.85
1.57
99
0.00
3.00
1.74
S
A
V
O
R
P
1.86
2.17
1.86
0.00
11.35
48.30
30.96
0.97
0.00
1.62
2.76
0.97
0.00
7.36
50.39
30.99
1.10
0.16
1.25
4.38
0.47
0.00
5.52
49.27
29.65
1.45
0.58
1.74
4.07
1.02
0.00
5.06
49.27
30.67
2.45
0.65
2.12
5.06
0.16
0.00
8.02
52.80
23.90
1.66
0.15
1.97
5.14
1.36
0.00
5.30
49.76
29.70
1.12
0.16
2.57
5.62
0.96
0.00
4.56
52.92
27.53
1.85
0.29
2.00
3.71
1.43
0.00
6.00
47.71
29.07
1.74
0.00
2.21
4.74
1.74
cm). However, their absolute abundances show the same trend
along the core (Figure 2B, C). At 12kyr, both F. profunda and
Gephyrocapsa sp. show a marked decline in absolute
abundance.
In a general view, comparing quantitative data with the
isotopic data provides two situations: (i) most calcareous
nannofossils observed are in opposition to the oxygen
isotope curve throughout the core, and (ii) the bulk of the
species are in agreement with the carbon isotope curve during
MIS 2 and 3, but are discordant during MIS 1. The only
exception is Gephyrocapsa sp., of which the relative
abundance slightly agrees with the oxygen and carbon
isotopic curves along the whole core (Figures 2B, D, E).
DISCUSSION
Down-core abundances of calcareous nannofossil
suggest a different climatic regime response during the last
30 kyr. Relative and absolute abundances of different species
vary wildly throughout the core following variations in
productivity and temperature. Most taxa have a decrease in
abundance from MIS 3 to 1, which strongly characterizes the
transition from glacial to interglacial conditions.
Glacial temperatures are supposed to be colder (~2-3 °C)
at the location of the core (Toledo, 2000; Costa, 2000). Glacial
intervals are known to be more productive than interglacial
ones due to strong seasonal contrast, wind strengthening
and consequent upwelling intensification globally (Bradley,
1999; Henriksson, 2000). The different environmental
conditions result in distinct nannofloral compositions
between MIS 3-2 and 1, with marked changes in absolute
and relative abundances. E. huxleyi and Umbellosphaera
sp. clearly increase while all the other species decrease.
All species contributing to the MIS 1 assemblages are
also present during glacials, although relative and absolute
abundances vary. Pronounced variations in relative
abundance of lower photic zone dweller, F. profunda
(Okada, 1983, 1992) has been shown to reflect variations
in the nutricline (and thermocline) depth (Molfino &
McIntyre, 1990) and productivity fluctuations (Beaufort
et al., 1997; Henriksson, 2000). High relative abundance
of F. profunda indicates low productivity with a deep
nutricline, which means a nutrient-depleted upper photic
zone. Except for F. profunda, all other species are
considered to live mainly in the upper photic zone. The
decrease of F. profunda relative abundance in the sample
can reveal changes in the transparency of superficial
waters, since the species depends on sun light for its
development. Ahagon (1993) observed that there is a good
correlation between the abundance of F. profunda and the
transparency of the water column, in the present, in the
northeast Pacific Ocean. In regions of great water
transparency, F. profunda occurs abundantly. In open
ocean, the transparency is greatly influenced by the
primary production of superficial waters.
Absolute abundance of Gephyrocapsa sp. decreases from
MIS 1 to MIS 2, suggesting the decrease of surface water
productivity. On the other hand, relative abundance of this
FERRARESE ET AL. – QUANTITATIVE STUDIES OF CALCAREOUS NANNOFOSSILS
9
Umbellosphaera sp.
Syracosphaera sp.
R. clavigera
Pontosphaera sp.
H. carteri
Gephyrocapsa sp.
F. profunda
E. huxleyi
C. pelagicus
C. murrayi
C. leptoporus
C. cristatus
Depth (cm)
Table 3. Number of nannoliths per gram of sediment of calcareous nannofossils species in Core ESP-8.
0
3.28E+10 6.56E+10 8.20E+10
0.00E+00
1.05E+12 5.50E+12 2.82E+12 2.13E+11 0.00E+00 2.63E+11 1.97E+11 2.46E+11
7
0.00E+00 4.59E+10 4.59E+10
0.00E+00
1.95E+12 7.03E+12 4.07E+12 1.15E+11 0.00E+00 6.89E+10 3.45E+11 3.45E+11
13 1.62E+10 1.14E+11 0.00E+00
19 2.20E+10 8.79E+10 8.79E+10
25 0.00E+00 1.08E+11 6.14E+10
0.00E+00
1.15E+12 2.94E+12 3.04E+12 1.62E+11 0.00E+00 8.12E+10 2.27E+11 9.75E+10
0.00E+00
1.63E+12 5.34E+12 3.95E+12 1.10E+11 0.00E+00 4.39E+10 2.20E+11 2.20E+11
0.00E+00
9.98E+11 3.12E+12 3.06E+12 1.84E+11 0.00E+00 1.08E+11 1.23E+11 1.38E+11
31 1.80E+10 1.44E+11 7.18E+10
37 0.00E+00 1.07E+11 2.14E+11
45 2.13E+10 4.27E+10 1.49E+11
0.00E+00
8.98E+11 4.42E+12 3.74E+12 1.08E+11 1.80E+10 1.44E+11 2.51E+11 2.15E+11
0.00E+00
1.12E+12 6.34E+12 6.85E+12 2.41E+11 0.00E+00 2.94E+11 4.01E+11 2.94E+11
0.00E+00
1.22E+12 7.10E+12 3.92E+12 1.92E+11 6.40E+10 2.56E+11 2.99E+11 2.56E+11
51 0.00E+00 2.27E+11 1.99E+11
57 2.51E+10 1.51E+11 1.76E+11
64 6.39E+10 3.19E+11 4.15E+11
0.00E+00
1.99E+12 8.47E+12 5.43E+12 1.71E+11 0.00E+00 2.84E+11 4.83E+11 1.71E+11
0.00E+00
1.18E+12 8.08E+12 4.97E+12 1.76E+11 2.51E+10 2.01E+11 7.03E+11 7.53E+10
0.00E+00
1.21E+12 1.08E+13 6.52E+12 3.19E+11 1.28E+11 3.83E+11 8.95E+11 2.24E+11
70 1.04E+11 7.76E+10 2.33E+11
76 0.00E+00 2.30E+11 1.88E+11
82 2.82E+10 3.38E+11 2.25E+11
0.00E+00
8.02E+11 7.82E+12 4.87E+12 3.88E+11 1.04E+11 3.36E+11 8.02E+11 2.59E+10
0.00E+00
1.11E+12 7.30E+12 3.31E+12 2.30E+11 2.09E+10 2.72E+11 7.11E+11 1.88E+11
0.00E+00
9.29E+11 8.73E+12 5.21E+12 1.97E+11 2.82E+10 4.51E+11 9.86E+11 1.69E+11
89 0.00E+00 2.58E+11 2.19E+11
99 0.00E+00 6.36E+11 3.68E+11
0.00E+00
6.36E+11 7.37E+12 3.84E+12 2.58E+11 3.98E+10 2.78E+11 5.17E+11 1.99E+11
0.00E+00
1.27E+12 1.01E+13 6.16E+12 3.68E+11 0.00E+00 4.69E+11 1.00E+12 3.68E+11
S
A
V
O
R
P
species increases as relative abundance of F. profunda
decreases, suggesting a higher productivity in superficial
waters associated to the ascent of thermocline and nutricline.
It is clear that productivity is higher during MIS 2 than during
MIS 1, which is supported by the carbon isotopic record and
total abundances. Although the relationship between the
relative abundances of Gephyrocapsa sp. and F. profunda is
apparently indicating a deeper nutricline and thermocline
during MIS 1, the productivity of superficial waters is lower
in this period.
There is an increase in Gephyrocapsa sp. relative
abundance between 12-10 kyr. Similar trends were observed
in the absolute and relative abundance of E. huxleyi and
Umbellosphaera sp., which suggests high productive
surface waters corroborated by carbon isotopic data. For
most species of calcareous nannofossil assemblages we
have found similar results to the ones of Gephyrocapsa
sp., though there is a slight deviation between relative and
absolute abundances of this species during MIS 1. In view
of that, we speculate a deeper nutricline and thermocline,
hence less productive surface waters during MIS 1 than
during MIS 2 and 3.
Absolute abundances and relative abundances point to
conflicting conclusions. The introduction of absolute
abundances in the study showed to be very important since
these data seem to be directly correlated to productivity.
The traditional techniques produce thicker slides than
those by random settling. “Surprisingly” this thickness could
make counting procedure difficult and time-consuming. This
is because preparation of consistently well-spread slides for
nannofossil counting is arbitrary. For that reason, frequently,
many fields of view hard to achieve under light microscope
must be counted in real-life work.
CONCLUSIONS
The use of quantitative studies of certain calcareous
nannofossils taxa with isotopic carbon data demonstrated to
be useful for the evaluation of the productivity of the superficial
ocean. Down-core abundances of calcareous nannofossils
suggest a different climatic regime response during the last 30
kyr. The absolute abundances of Gephyrocapsa sp. confirmed
the carbon isotope record, indicating higher productivity during
MIS 2 than during MIS 1.
The random settling technique displays a data that other
techniques do not, the absolute abundance. This one
demonstrated to be very important in quantitative studies,
since it gives us support to infer mainly about productivity.
Additionally, this procedure produces homogeneous, welldistributed slides, which help species identification as well
as quantitative analyses. Moreover, it allows a derivation of
both relative and absolute abundances, both recognized as
useful paleoceanographic tools especially when combined
with isotopic datasets. These results can help better
understand paleoproductivity variations due to climate and
environmental changes.
10
REVISTA BRASILEIRA DE PALEONTOLOGIA,11(1), 2008
ACKNOWLEDGMENTS
We thank Maria A. G. Pivel for providing important insights
and advice for this research. This work was financially
supported by Fundação de Amparo à Pesquisa do Estado de
São Paulo (process 04/02819-8). We thank Petrobras for
providing the samples. This is Laboratório de
Paleoceanografia do Atlântico Sul (LaPAS) contribution
number 11.
REFERENCES
Ahagon, N.; Tanaka, Y & Julie, H. 1993. Florisphaera profunda, a
possible nannoplankton indicator of late Quaternary changes
in sea-water turbidity at the northeast margin of the Pacific.
Marine Micropaleontology, 22:255-73.
Antunes, R.L. 1997. Introdução ao estudo dos nanofósseis calcários.
Rio de Janeiro, UFRJ, 115 p.
Baretta-Bekker, J.G.; Duursma, E.K. & Kuipers, B.R. 1998.
Encyclopedia of Marine Sciences. New York, Springer, 357 p.
Beaufort, L.; Lancelot, Y.; Camberlin, P.; Cayre, O.; Vincent, E.;
Bassinot, F. & Labeyrie, L. 1997. Insolation cycles as a major
control of equatorial Indian Ocean primary production. Science,
278:1451-1454.
Bradley, R.S. 1999. Marine sediments and corals. In: R.S. Bradley
(ed.) Paleoclimatology-reconstructing climates of the
Quaternary. Elsevier, p. 191-283.
Buccheri, G.; Capretto, G.; Di Donato, V.; Espósito, P.; Ferruzza,
G.; Pascatore, T.; Russo, E.; Senatore, M.R.; Sprovieri, M.;
Bertoldo, M.; Carella, D. & Madonia, G. 2002. A high resolution
record of the last deglaciation in the southern Tyrrhenian Sea:
environmental and climatic evolution. Marine Geology, 186:447470.
Buccianti, A. & Esposito, P. 2004. Insights into Late Quaternary
calcareous nannoplankton assemblages under the theory of
statistical analysis for compositional data. Palaeogeography,
Palaeoclimatology, Palaeoecology, 202: 209-227.
Costa, K.B. 2000. Variações paleoceanográficas na porção Oeste
do Atlântico Sul entre o último máximo glacial e o Holoceno:
isótopos estáveis de Oxigênio e Carbono e razão Cd/Ca em
foraminíferos bentônicos. Programa de Pós-graduação em
Geociências, Universidade Federal do Rio Grande do Sul,
Doctoral Dissertation, 250 p.
Ferreira, J. & Cachão, M. 2003. Nanofósseis calcários em fácies
costeiras: revisão de técnicas de estudo. Ciências da Terra
(UNL), special volume V, CD-ROM:A76-A78.
Flores, J.A. & Sierro, F.J. 1997. Revised technique for calculation
of calcareous nannofossil accumulation rates.
Micropaleontology, 43:321-324.
Giraudeau, J. 1992. Coccolith paleotemperature and paleosalinity
estimates in the Caribbean Sea for the middle-late Pleistocene
(DSDP Leg 68–Hole 502B). Memorie di Scienze Geologiche,
43:375-387.
Henriksson, A.S. 2000. Coccolithophore response to oceanographic
changes in the equatorial Atlantic during the last 200,000 years.
Palaeogeography, Palaeoclimatology, Palaeoecology, 156:161173.
Herrle, J.O. 2003. Reconstructing nutricline dynamics of midCretaceous oceans: evidence from calcareous nannofossils from
the Niveau Paquier black shale (SE France). Marine
Micropaleontology, 47:307-321.
Martinson, D.G.; Pisias, N.G.; Hays, J.D.; Imbrie, J.T.C.; Moore
J. & Shackleton, N.J., 1987. Age dating and the Orbital Theory
of the Ice Ages: development of a high-resolution 0 to 300,000year chronostratigraphy. Quaternary Research, 27:1-29.
Matsuoka, H. & Okada, H. 1989. Quantitative analysis of
Quaternary nannoplankton in the subtropical north western
Pacific Ocean. Marine Micropaleontology, 14:97-118.
McIntyre, K. & Bé, A.W.H. 1967. Modern Coccolithophoridae in
the Atlantic Ocean. I: Placoliths and Crytholiths. Deep-Sea
Research, 14:561-597.
Mix, A.C., Bard, E. & Schneider, R. 2001. Environmental processes of the Ice Age: land, oceans, glaciers (EPILOG). Quaternary
Science Reviews, 20:627-657.
Molfino, B. & McIntyre, A. 1990. Precessional forcing of nutricline
dynamics in the Equatorial Atlantic. Science, 249:766-769.
Mostajo, E.L. 1986. Estudio de dos testigos submarinos del oceano
Pacífico Sudecuatorial. Revista Española de
Micropaleontología, 18(3):433-442.
Okada, H. 2000. Neogene and Quaternary calcareous nannofossils
from the Blake Ridge, sites 994, 995 and 997. Proceedings of
the Ocean Drilling Program, Scientific Results, 164:331-341.
Okada, H. 1992. Biogeographic control of modern nannofossil
assemblages in surface sediments of Ise Bay, Mikawa Bay e
Kumano-Nada, off coast of central Japan. Memorie di Scienze
Geologiche, 43:431-449.
Okada, H. 1983. Modern nannofossil assemblages in sediments os
coastal and marginal seas along the western Pacific Ocean.
Utrecht Micropaleontology Bulletin, 30:171-187.
Okada, H. & Honjo, S. 1973. The distribution of oceanic
coccolithophorids in the Pacific. Deep-Sea Research, 20:355374.
Roth, P. 1994. Distribution of coccoliths in oceanic sediments. In:
A. Winter & W. Siesser (eds.) Coccolithophores, Cambridge
University Press, p. 199-218.
Steinmetz, J.C. 1994. Stable isotopes in modern coccolithophores.
In: A. Winter & W. Siesser (eds.) Coccolithophores, Cambrige
University Press, p. 219-229.
Thierstein, H.R.; Geitzenauer, K.R.; Molfino, B. & Shackleton,
N.J. 1977. Global synchroneity of late Quaternary coccolith
datum levels: validation by oxygen isotopes. Geology, 5:400404.
Toledo, F.A.L. 2000. Variações paleoceanográficas nos últimos
30.000 anos no oeste do Atlântico Sul: isótopos de oxigênio,
assembléias de foraminíferos planctônicos e nanofósseis
calcários. Programa de Pós-graduação em Geociências, Universidade Federal do Rio Grande do Sul, Doctoral Dissertation,
245 p.
Winter. A.; Jordan, R.W. & Roth, P.H. 1994. Biogeography of the
living coccolithophores in ocean waters. In: A. Winter & W.
Siesser (eds.) Coccolithophores. Cambrige University Press,
p. 161-179.
Young, J.R. 1991. A Quaternary nannofossil range chart.
International Nannoplankton Association Newsletter, 13:14-17.
S
A
V
O
R
P
Received in May,2007; accepted in February, 2008.
Baixar