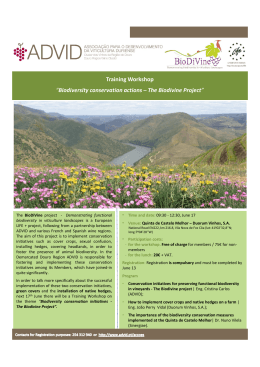
Monitoring arthropod diversity in Douro wine region vineyards
Alexis Rataux1, Cristina Carlos1, Fátima Gonçalves2, José Aranha2, Josépha Guenser3,
Fernando Alves1, Maarten Van Helden4
ADVID – Association for the Development of Viticulture in the Douro, Quinta de Santa Maria, Apt.
137, 5050 -106 Godim, Portugal, [email protected]
2
CITAB – Centre for the Research and Technology of Agro-Environmental and Biological Sciences,
University of Trás-os-Montes and Alto Douro, 5001-801, Vila Real, Portugal
3
Vitinnov, 1 Cours Général de Gaulle 33170 Gradignan, France
4
Bordeaux Sciences Agro, Université de Bordeaux, ISVV, 1 Cours Général de Gaulle 33170
Gradignan, France. [email protected]
1
Abstract: Nowadays, many actions aim to enhance the biological control in agro ecosystems in order
to improve their resilience and sustainability. To what extent does the landscape structure improve
biodiversity? Is it possible to adapt vineyard management or surrounding landscape to improve the
presence of ecological infrastructures and thus increase biodiversity? Those two questions are the
basis of the European project LIFE+ “BioDiVine: Demonstrating functional biodiversity in viticulture
landscapes”.
In Portugal, ADVID is in charge of the implementation of conservation actions and for monitoring
their impact in three experimental sites located in the Douro Valley, with a global surface of nearly
500 hectares. In 2011, two types of traps (combi and pitfall) have been set up in five main habitats:
vineyard, scrubland, urban, olive groves and olive hedgerows. The arthropods caught during seven
weeks of assessment (April-June) were sorted out using the Rapid Biodiversity Assessment (RBA)
method. Biological indexes were calculated and correlated with landscape characteristics (Shannon’s
landscape index) calculated through a GIS database to investigate the way habitats influence
arthropods’ biodiversity and, in the particular functional biodiversity (Coccinellidae and
Staphylinidae, Araneae and Opilionidae). More than 52000 arthropods were counted and 789
morphospecies identified, belonging to 18 orders of Insecta and five orders of Arachnida. Arthropods
caught by combi traps were more abundant on scrublands. Some positive correlations have been
established between landscape components and arthropods presence. Staphylinidae abundance and
richness were higher in more diverse landscape. Concerning other taxa, each order appears to be
differently influenced by the landscape’s structure.
Key words: Viticulture, functional biodiversity, landscape management
Introduction
Ecological resilience, pests' control and prevention of invasions are much influenced by the
species' richness and genetic variability (OBRIST & DUELLI, 2010), in other words, by
biodiversity. The declaration of 2010 as "year of biodiversity" by the UNO and UNESCO, the
increase of pests' resistance problems and public demand of residue-free products have
increased the interest for environmentally safe pest management and for conservation
biological control. Therefore, researchers and growers are concerned in understanding how
they could improve the presence of natural enemies in cultivated landscapes, by bringing
more biodiversity into the cultivated surfaces. Such a dynamic needs to be supported by
research work, which will allow them to estimate in situ if conservation actions have to be
taken and which ones. The present results were extracted from the first study year of the
arthropod biodiversity estimation in the Alto Douro Region's vineyard, situated in the north of
Portugal. This is part of a European project called "BioDiVine", including three European
countries (France, Portugal and Spain), and which will last four years (2011-2014). This
international cooperation aims to evaluate the impact of the landscape's structure on
functional biodiversity.
Material and Methods
The experiments were carried out in three pilot farms located in the Alto Douro Vinhateiro
region. First of all, five categories of habitats were defined, namely vineyards, olive groves,
olive tree alignment (OTA), urban sites and scrubland. Each one accommodated five trapping
site's repetitions. A GIS database (ArcMap) was used to digitize land use and characterize the
surrounding of each of the 25 trapping sites, for several buffer sizes (from 50 to 200m) using
aerial photographs. The trapping system consisted of a combination of two traps, a "Combi
trap", which aims to catch flying arthropods, and a "Pitfall trap", which aims to catch soil
arthropods. Each trap was filled with a mix of water, salt (5%) and soap, and checked once a
week. The harvest time ran over 12 weeks, from April to July, synchronized with the main the
arthropods' development period. Because of the huge arthropods’ abundance observed during
2011, only the first seven weeks of the biological material collected was observed and
classified using the Rapid Biodiversity Assessment (RBA) method. Moreover, we focused on
four groups of easily identifiable beneficials (Araneae, Coccinellidae Opilionidae and
Staphylinidae) as an indicator for functional biodiversity. Some indexes were calculated such
as the Shannon-Weaver Index for biodiversity and for landscape. Finally, GIS and RBA data
were crossed to try to show some tendencies in the way the landscape influences the
arthropod biodiversity. Concerning the statistical analysis, one-way ANOVA followed by
Fisher’s LSD honestly significant difference (HSD) test (p < 0.05) were used to compare the
means obtained among different habitats, even if we didn’t realize any ECOSIM correction.
When necessary, and in order to perform the assumptions of ANOVA, percentage data were
arcsine square-root transformed, while the number of individuals captured (x) were
transformed into a logarithmic scale log10 (x). If the assumptions of homogeneity of variances
and normality were violated, a nonparametric Kruskal-Wallis test followed by the multiple
comparison mean ranks by Fisher’s LSD as described on MAROCO (2007) was performed.
Results and Discussion
Landscape’s characterization
The landscape’s digitalization allowed us to calculate the land use repartition as well as
the “non used territory” (interstitial space) level. Main results are presented in Table 1.
Concerning the interstitial space (e.g. road sides, ditches), which could potentially be
manage as refuge spaces (ecological compensation areas) for promoting biodiversity, it
represented approximately 2% of the space digitalized, which is to compare to the 5%
level recommended by the OILB.
Arthropods
More than 52 000 individuals were caught, split into 24 arthropod Orders and 789
morphospecies (MS). The Combi trap results represented nearly 90% of the total
abundance. Four main orders of insects were present: Coleoptera that represented nearly
half of the global abundance (46, 3%), followed by Diptera (20, 1%), Hymenoptera (15,
2%) and Hemiptera (12, 6%). Concerning other arthropods, spiders represented up to 3%
of the global abundance (Fig. 1 A). Concerning the arthropods’ global richness,
Coleoptera and Hympenoptera were the most important orders, with respectively 25% and
22% of the total number of morphospecies (Fig. 1 B).
Table 1- Global characterization of the landscape inside the buffers by GIS
Buffer’s radius (m)
Global surface (ha)
Interstitial space (ha)
Interstitial space (%)
Shannon-Weaver Index for landscape
50
0,59
0,01
2%
0,64
100
2,36
0,04
2%
0,87
150
5,32
0,09
2%
0,97
200
9,47
0,15
2%
1,01
6,66
1,58
15,53
1,81
0,30
2,62
23,80
6,97
39,13
6,48
1,21
10,42
1,36
2,01
2,07
25,85
4,90
44,03
6,35
1,09
8,15
1,06
3,33
1,74
24,87
2,70
49,07
5,88
0,95
6,38
0,96
4,61
1,44
23,13
1,92
53,19
Habitats (%):
Dirt roads
OTA
Olive groves
Riparian forest
River
Sealed roads
Scrubland
Urban sites
Vineyards
Fig. 1 A
Fig. 1 B
Figure 1: Distribution among arthropod orders for total abundance (A) and morphospecies
richness (B)
Arthropods and landscape
If we focus on the Combi trap results (main part of the caught individuals), significant
differences appear between habitats. The scrubland and urban sites seem to show a higher
overall abundance (Fig. 2). For arthropods’ richness, the statistical tests did not show any
significant differences (α= 17,5 > 5%).
Order distributions were different among habitats for both Combi- and Pitfall traps (Fig. 3
A and 3 B).
Figure 2: Habitat’s influence over the arthropods abundance in the Combi traps.
Fig. 3 A
Fig. 3 B
Figure 3: Order proportions according to the global abundance of each habitat in the
Combi- (A) and Pitfall traps (B).
These are the first results of the BioDiVine project concerning biodiversity’s comprehension
and management. Data analysis is ongoing and more details will be presented in future
publications.
Acknowledgements
The authors would like to thanks to Pedro Ferreira and Marco Magalhães for technical support in
GIS work.
References
MAROCO, J. (2007). Análise estatística – Com utilização do SPSS. 3ªedição. Edições Silabo
Lda, 822 pp.
OBRIST, M.K. & DUELLI, P. (2010). Rapid biodiversity assessment of arthropods for
monitoring average local species richness and related ecosystem services. Biodivers
Conserv 19:2201-2220.
Baixar