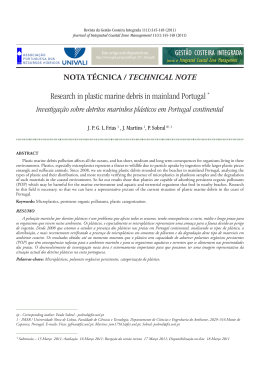
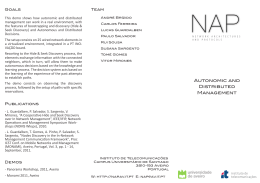
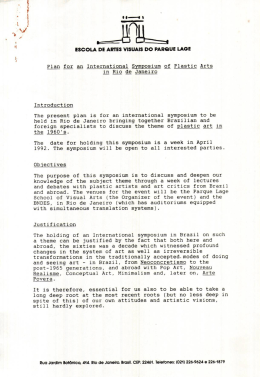
Journal of Integrated Coastal Zone Management / Revista de Gestão Costeira Integrada, 15(3):325-332 (2015)
http://www.aprh.pt/rgci/pdf/rgci-566_Fernandino.pdf
|
DOI: 10.5894/rgci566
How many pellets are too many?
The pellet pollution index as a tool to assess beach pollution
by plastic resin pellets in Salvador, Bahia, Brazil*
@,
Gerson Fernandino@, a; Carla I. Elliffa; Iracema R. Silvab; Abílio C.S.P. Bittencourtc
ABSTRACT
Plastic pellets are significant components of marine litter and can be found floating in the sea or stranded on beaches. However, current assessments of this issue lack standardization to allow comparisons of pellet pollution levels between different
locations. Thus, the present study proposes the Pellet Pollution Index (PPI) to classify beaches based on the amount of pellets
found in a given area of superficial sand. Pellets were sampled from 24 sites (P01 – P24) along the municipality of Salvador,
Brazil, within a quadrat of 1 x 1 x 0.05m on the strandline and backshore. Twenty-two sites were located along the oceanic
coastline, while the remaining 2 sites were within the Todos os Santos Bay. Results showed that, considering the coastline of
Salvador as a whole, the PPI indicated a very low degree of pollution. This approach should aid future attempts of locating and
removing the plastic anthropogenic component of the sediment on beaches and in marine environments.
Keywords: Plastic Pellets, Sandy Beaches, Pellet Pollution Index, Beach Pollution, Coastal Management
RESUMO
Quantos pellets são pellets demais? O índice de poluição por pellets como uma ferramenta para analisar poluição de praias
por pellets de resina plástica em Salvador, Bahia, Brasil
Pellets plásticos são componentes significantes do lixo marinho e podem ser encontrados flutuando no mar ou encalhados em
praias. No entanto, análises atuais dessa problemática não apresentam padronização que permita comparações de níveis de
poluição por pellets entre diferentes locais. Assim, o presente estudo propõe o Índice de Poluição por Pellets (PPI) para classificar praias de acordo com a quantidade de pellets encontrados em uma dada área superficial de areia. Pellets foram
amostrados em 24 pontos ao longo do município de Salvador, Brasil, dentro de um quadrado de 1 x 1 x 0,05m na linha de
detritos e no pós-praia. Vinte e dois pontos se localizavam na orla oceânica, enquanto os 2 pontos restantes estavam dentro
@
a
b
c
Corresponding author to whom correspondence should be addressed.
Universidade Federal da Bahia, Instituto de Geociências, Curso de Pós-Graduação em Geologia, Rua Barão de Geremoabo, s/n, Campus
Federação, CEP 40170-290, Salvador, Bahia, Brazil. e-mails: Fernandino <[email protected]>; Elliff <[email protected]>.
Universidade Federal da Bahia, Instituto de Geociências, Departamento de Oceanografia, Rua Barão de Geremoabo, s/n, Campus Federação, CEP 40170-290, Salvador, Bahia, Brazil. e-mail: Silva <[email protected]>
Universidade Federal da Bahia, Instituto de Geociências, Laboratório de Estudos Costeiros/CPGG, Rua Barão de Geremoabo, s/n, Campus
Federação, CEP 40170-290, Salvador, Bahia, Brazil. e-mail: Bittencourt <[email protected]>
* Submission: 6 DEZ 2014; Peer review: 6 JAN 2015; Revised: 25 FEB 2015; Accepted: 13 MAR 2015; Available on-line: 16 MAR 2015
Fernandino et al. (2015)
da Baía de Todos os Santos. Os resultados demonstraram que a orla de Salvador como um todo apresentava um grau muito
baixo de PPI. Essa abordagem poderá auxiliar em iniciativas para a localização e remoção do componente antropogênico
plástico do sedimento de praias e do ambiente marinho.
Palavras-chave: Pellets plásticos, praias arenosas, Índice de Poluição por Pellets, poluição de praias, gerenciamento costeiro.
1. Introduction
Industrial plastic pellets are composed of plastic resins
– usually polyethylene, polystyrene or polypropylene,
that are 2 – 5 mm in diameter and are used as raw material in the production of plastic items (EPA 1993; Ogata
et al. 2009). These spherules can reach the marine environment, and eventually become deposited on sandy
beaches, during their production, transport or use. Due
to their small size and resemblance to food items, plastic pellets are ingested by a wide range of marine organisms (Tourinho et al. 2010; Buxton et al. 2013; Rebolledo et al. 2013). In addition, chemical compounds
in the sea water, such as persistent organic pollutants
(POPs), polycyclic aromatic hydrocarbons (PAHs),
polychlorinated biphenyls (PCBs) and pesticides can
become absorbed onto the pellets which, when ingested,
may trigger bioaccumulation (Ogata et al. 2009; Yamashita et al. 2011) and biomagnification processes (Endo
et al. 2005; Frias et al. 2010; Karapanagioti et al.
2011), posing threats especially to apex predators,
which include marine animals and humans.
Until recently, marine litter assessments in general focused on quantifying and qualifying the sampled material, but there was no index which classified sandy
beaches according to their pollution degree by solid
waste. Thus, Alkalay et al. (2007) proposed the Clean
Coast Index (CCI) to classify sandy beaches according
to the amount of plastic present in beaches. Furthermore, they determined that plastic debris could be used
as a proxy for all types of litter, because plastic is the
most abundant material comprised in marine litter.
However, this classification does not encompass plastic
pellets in its calculation, since only particles larger than
2 cm are considered.
Various studies have been conducted worldwide concerning the presence of plastic pellets on beaches focusing mainly on the quantification of pellets (Gregory
1977, 1978; Shiber 1979, 1982; Shiber & BarralesRienda 1991; Ivar do Sul et al. 2009; Costa et al. 2010;
Turner & Holmes 2011; D’Antonio et al. 2012) and
their external/physical (Corcoran et al. 2009; Fotopoulou & Karapanagioti 2012) or chemical characteristics
(Endo et al. 2005; Ogata et al. 2009; Frias et al. 2010;
Karapanagioti et al. 2011, Lithner et al. 2011; Rochman
et al. 2013). However, no studies were found in the literature that classified sandy beaches according to pollution (presence) by pellets. This hinders the communication, both for the scientific community and general
population, of the information provided by various
studies that observed the abundance of this material in a
variety of beaches worldwide. Similar to what motivated the creation of the CCI, plastic pellet evaluations
still lack a tool that allows the classification of a beach
according to its degree of pollution by pellets. Thus, we
propose the Pellet Pollution Index PPI and apply to
beaches of the municipality of Salvador, Brazil.
2. Materials and Methods
2.1. Sampling site
The municipality of Salvador has a coastline of approximately 40 km (Figure 1), which is characterized
by the presence of more rectilinear sectors (i.e. the sector between P15 – P17 and P18 – P21), promontories
(i.e. near P05), and sectors with pocket beaches (i.e.
Paciência Beach, P08) that are intersected by rocky
outcrops, both basement rock and beach sandstone.
Salvador is a metropolis with over 2.6 million inhabitants (IBGE 2010). The municipality’s beaches, especially those located within the Barra district (P03 and
P04 in Figure 1), are intensely used by tourists and local beachgoers, attracted by both the natural beauty and
the historical and cultural relevance of the region.
The coastline is highly urbanized, with very few well
established backshore areas due to the presence of anthropogenic structures to support the beachside avenue.
As shown in Figure 1, there are numerous urban river
and rainwater drainages that discharge straight on the
municipality’s beaches. According to Fernandino
(2014), in addition to fulfilling their role in draining
water to the ocean, these drainages represent a source of
litter and potentially also pellets to the marine environment, because industries that use plastic pellets as rawmaterial can easily lose some of this material during
handling.
2.2. Pellet sampling
Plastic pellets were sampled from the beaches of Salvador during the rainy season (winter) of 2012 (June to
August) and the dry season (summer) of 2013 (February). A total of 24 sites were sampled: 22 sites every
1 km along the coastline of Salvador extending northwards from the Porto da Barra beach (P03), at the entrance of the Todos os Santos Bay (TSB), to the lighthouse in Itapuã (P24) (see Figure 1). In addition, two
sites located within the TSB were sampled, Ribeira
(P01) and Boa Viagem (P02), in order to compare the
326
Journal of Integrated Coastal Zone Management / Revista de Gestão Costeira Integrada, 15(3):325-332 (2015)
Figure 1 - The study area showing sampling sites.
Figura 1 - Localização da área de estudo e pontos de amostragem.
concentrations of plastic pellets with open coastline
sites, particularly due to the presence of the port of Salvador.
At each site, a 1 x 1 x 0.05 m quadrat was placed on the
strandline of the last recent high water mark and a second one was surveyed by the landwards obstacle that
limited the sand strip. This obstacle could be either
natural (e.g. vegetation or dunes) or anthropogenic (e.g.
walls and other constructions). This landwards area was
generically called “backshore” in the present study. The
superficial layer of sediment within the quadrat, respecting the maximum depth of 0.05 m, was removed
and immersed in a bucket with seawater to separate the
plastic pellets through flotation. This superficial sampling was chosen in order to evaluate recent deposition
of plastic pellets for future inference of hydrodynamicmeteorological factors and/or events which governed
their deposition. As reported by Turra et al. (2014), the
distribution of pellets throughout the sediment column
is variable, and, as such, the index proposed in the present study should be applied to the uppermost strata of
sediment to avoid over or underestimating the level of
pollution.
2.3. Data Analysis
The data collected were digitized and primarily analyzed using a worksheet on the software Excel (Windows Office 2010). The statistical analysis of the abundance (i.e. absolute number of pellets) and concentration (i.e. number of pellets per m²) of pellets was performed through the Kruskal-Wallis test (BioEstat. 5.3)
in order to verify the existence of significant differences
between the sampled seasons.
2.4. Pellet Pollution Index - PPI
The calculation of the PPI was performed as shown in
Equation (1), using the ratio between the number of pellets and the volume of sediment sampled. This ratio was
then multiplied by a correction coefficient p (p = 0.02),
arbitrarily determined to conveniently classify the result
within a range of 0 to 3 according to the degree of pollution as follows: very low (0.0 < PPI ≤ 0.5); low
(0.5 < PPI ≤ 1.0); moderate (1.0 < PPI ≤ 2.0); high
(2.0 < PPI ≤ 3.0); and very high (PPI > 3.0).
(1)
where n is the amount of sampled pellets, a is the area
of sampled sediment and p is the correction coefficient.
Table 1 presents the classification of the degree of pollution by pellets and the numerical abundance. The column with numerical data was included in order to provide a comparative numerical order of magnitude between raw data and the index.
In cases where the strandline and the backshore overlapped, due to the interruption of the backshore by anthropogenic obstacles, only one quadrat was sampled.
Thus, for the calculation of the PPI, the area of sediment for those sites corresponded to half the area of the
other sites.
3. Results and Discussion
In total, 1,967 pellets were sampled from the beaches of
Salvador. Of these, 1,102 were sampled during the winter of 2012 and the remaining 865, during the summer
of 2013. From the 24 sampled sites 20 presented plastic
327
Fernandino et al. (2015)
Table 1 - Concentration of pellets and Pellet Pollution Index
(PPI) classification.
Tabela 1 Concentração de pellets e classificação pelo Índice
de Poluição por Pellets (PPI).
PPI
0.0 < PPI ≤ 0.5
Concentration of pellets Classification
0 – 25
Very Low
0.5 < PPI ≤ 1.0
25 – 50
Low
1.0 < PPI ≤ 2.0
50 – 100
Moderate
2.0 < PPI ≤ 3.0
100 – 150
High
PPI > 3.0
> 150
Very high
pellets deposited on the superficial layer of sand
(83.33%) during the winter, and 18 (75%) contained
pellets during the summer.
The mean number of pellets observed at each site was
45.92 (SE = 12.89) during the winter of 2012 and 36.04
(SE = 9.66) during the summer of 2013. During the
winter, the site with greatest abundance was P11 (Pituba beach; 265 pellets), followed by P16 (Boca do Rio
beach; 155 pellets), and by P12 (Jardim dos Namorados
beach; 129 pellets). During the summer, site P04 (Barra
beach) presented the greatest abundance, with 196 pellets, followed by P16 (Boca do Rio beach; 125 pellets),
and by P07 (Paciência beach; 79 pellets). During the
winter, P01 (Ribeira beach), P02 (Boa Viagem beach),
P23 (Itapuã beach) and P24 (Farol de Itapuã beach) did
not present pellets. During the summer, sites P01
(Ribeira beach), P03 (Porto da Barra beach), P05 (Othon Hotel beach), P22 (Piatã Duna beach) and P24
(Farol de Itapuã beach) did not present pellets. The
number of total pellets collected did not vary significantly (p > 0.05) between summer and winter.
The very low concentration of pellets on the beaches
located towards the TSB during the studied seasons
suggests that either the port area/activities are not a
major source of pellets for those beaches or the
circulation patterns of the TSB do not provide
conditions which allow for their deposition at these
locations. Moreover, as mentioned previously, the
constant presence of urban river drainages and effluents
that discharge straight onto the municipality’s beaches
can also represent a source of pellets, which could
explain the absence of pellets in P24, for example, since
there are no drainage outputs on this site.
Plastic pellets were sampled from a total of 86 m² of
superficial sediment. Thus, an overall mean value of
23.26 pellets m-2 (SE = 4.6) was obtained for the entire
coastline, which results in a PPI of 0.46, meaning a very
low degree of pollution by plastic pellets. The density
of pellets sampled during the winter of 2012 was higher
(26.20 pellets m-2, SE = 7.61, PPI = low degree) than
during the summer of 2013 (20.31 pellets m-2,
SE = 5.27, PPI = very low degree). The PPI was
determined for each site as shown in Figure 2.
During the winter, most of the sampled sites (75%) presented a very low PPI. The categories “low”, “moderate” and “high” each represented 8.33% of the total of
sampled sites. During the summer, 66.67% of the sites
were classified as having a very low PPI, followed by
the classifications “low” (20.83%) and “moderate”
(12.5%). No sites presented “very high” PPI in either
season.
In order to assess the applicability of the PPI as a tool
for improving the comparison of results obtained from
different study sites, the index was used to classify several national and international studies gathered through
literature review (Table 2). The values for pellet density
(No. pellets m-2) were either directly provided by the
authors in the consulted literature or had to be calculated using the information available in each article
(sampling area in m² and number of sampled pellets).
By standardizing the measurement of the occurrence of
pellets on sandy beaches it is possible to observe that
this type of pollution varies immensely. The frequency
of a very high degree of pellet pollution observed on
several beaches is concerning. This finding should encourage studies to also identify the possible sources of
pellets in the environment and propose mitigation
strategies to improve the situation.
The urbanized characteristics of the coast of Salvador
do not seem to favor long-term deposition of pellets on
sandy beaches, because along various sectors of the
coast the area that should correspond to the backshore is
replaced by walls that support the beachside avenue.
However, the absence of a well-developed backshore
did not seem to be a determinant factor for pellet deposition – at least recent deposition –, considering that
sites such as P12 (Jardim dos Namorados beach) presented a high concentration of pellets during the winter,
despite the anthropogenic obstacle (wall) being within
reach of high water swash. At sites such as P14 (Jardim
de Allah beach) and P15 (Aeroclube beach) which contain a wider sand strip and a better developed vegetated
backshore, characteristics that are theoretically more
favorable for deposition, the PPI was very low and low
(winter and summer, respectively), whereas other sites
with the same characteristics (e.g. P16 – Boca do Rio
beach) presented higher concentrations.
The difference between classifications is most likely a
reflex of a number of factors. However, as reported by
Turra et al. (2014), pellet distribution patterns on sandy
beaches appear to be more related to oceanographic
processes than anthropogenic processes. Therefore, it is
reasonable to infer that the characteristics of each season and beach, such as the presence of a well-developed
backshore and the exposure to waves, alter the transport
328
Journal of Integrated Coastal Zone Management / Revista de Gestão Costeira Integrada, 15(3):325-332 (2015)
Figure 2 - Pellet Pollution Index (PPI) for 24 beaches in the municipality of Salvador during the winter of
2012 and summer of 2013.
Figura 2 - Índice de Poluição por Pellets (PPI) em 24 praias do município de Salvador durante o inverno
de 2012 e verão de 2013.
and deposition patterns of pellets along the coast of
Salvador, thus influencing the degree of pollution by
this plastic item. Another important factor to be considered is the fact that, due to the low density of pellets
(usually composed by PP and PE) and their small size,
high-energy events such as storms can remobilize them
and send them floating back to the surf zone or open
water. In this situation, hydrodynamic factors may redistribute them along the same shoreline or strand them
on a beach located far from their origin.
4. Conclusions
The coast of Salvador is polluted by plastic pellets to
higher and lower degrees. The results determined
through the use of the Pellet Pollution Index seem to
reflect the reality experienced in the field, where
beaches with a great number of pellets visible to the naked eye presented a higher PPI. The very low degree of
pellet pollution on the beaches located within the TSB
(P01 – Ribeira beach and P02 – Boa Viagem beach)
during both seasons allows a reasonable inference that
the port of Salvador is probably not a relevant source of
pellets to the local marine environment. Although the
majority of industries that use plastic pellets are also
located near sites P01 and P02 they do not seem to be
local sources of pellets for the sites. However, eventual
pellets spills or inappropriate disposal in the sewage
system could carry pellets to farther beaches.
Detailed information concerning sewage/drainage system are important in order to identify areas of greater
329
Fernandino et al. (2015)
Table 2 - Use of the Pellet Pollution Index (PPI) in various studies. Number of rows for each study represents the number of
sampling sites.
Tabela 2 - Uso do Índice de Poluição por Pellets (PPI) em vários estudos. O número de linhas em cada estudo representa o
número de pontos/locais de amostragem.
Author(s)
Costa et al., 2010
D'Antônio et al., 2012
Gomes, 1973
Lima, 2012
Manzano, 2009
Turner and Holmes, 2011
Zbyszewski et al.,2014*
Study area
Brazil
Brazil
Brazil
Brazil
Brazil
Maltese Islands
North America (Lake Erie)
330
Density (pellets/m²)
PPI
Classification
222.22
4.44
Very High
44.44
0.89
Low
100.00
2.00
Moderate
262.22
5.24
Very High
1636.67
32.73
Very High
146.67
2.93
High
351.11
7.02
Very High
906.67
18.13
Very High
95.56
1.91
Moderate
31.75
0.64
Low
154.00
3.08
Very High
505.00
10.10
Very High
281.00
5.62
Very High
103.00
2.06
High
63.00
1.26
Moderate
95.00
1.90
Moderate
383.00
7.66
Very High
270.00
5.40
Very High
84.00
1.68
Moderate
48.00
0.96
Low
5.00
0.10
Very Low
15.00
0.30
Very Low
2.00
0.04
Very Low
8.00
0.16
Very Low
3.00
0.06
Very Low
58.00
1.16
Moderate
0.80
0.02
Very Low
15.00
0.30
Very Low
0.70
0.01
Very Low
167.00
3.34
Very High
0.36
0.02
0.24
0.00
0.03
0.39
0.90
2.03
1.00
0.60
0.01
0.00
0.00
0.00
0.00
0.01
0.02
0.04
0.02
0.01
Very Low
Very Low
Very Low
Very Low
Very Low
Very Low
Very Low
Very Low
Very Low
Very Low
Journal of Integrated Coastal Zone Management / Revista de Gestão Costeira Integrada, 15(3):325-332 (2015)
Table 2 - Use of the Pellet Pollution Index (PPI) in various studies. Number of rows for each study represents the number of
sampling sites. (Cont.).
Tabela 2 - Uso do Índice de Poluição por Pellets (PPI) em vários estudos. O número de linhas em cada estudo representa o
número de pontos/locais de amostragem. (Cont.).
Author(s)
Study area
Density (pellets/m²)
PPI
Classification
0.01
0.00
0.01
0.00
0.89
33.23
1.47
0.57
0.14
0.00
0.00
0.00
0.00
0.00
0.00
0.00
0.02
0.66
0.03
0.01
0.00
0.00
0.00
0.00
Very Low
Very Low
Very Low
Very Low
Very Low
Low
Very Low
Very Low
Very Low
Very Low
Very Low
Very Low
North America (Lake St. Clair)
North America (Lake Huron)
risk of pellet input into the environment, as well as to
identify sources and allow for mitigation. Information
regarding the characteristics of the material such as
types of plastic resins (polyethylene and polypropylene,
for example), as well as the main color of the pellets
that nearby plastic industries use in their production
processes, can be important in order to verify if the pellets found stranded on Salvador’s beaches present the
same characteristics.
Although Salvador presents highly urbanized beaches
in which periodic cleaning activities are performed by
the local government using mainly rakes, the presence
of pellets on these beaches also suggests that the current
cleaning methods are not effective in removing small
items that increasingly accumulate on the sand. This
raking is not performed thoroughly along the entire
coast due to its extent and the limited number of cleaning agents involved. It usually focuses on short
stretches of beach where macro marine litter accumulation can be spotted near touristic beaches. Generally,
two or three people, who cover a long stretch of beach
(approximately 2 km), perform this cleaning method.
While one of these people roughly rakes the sand for
large plastic items and gathers them in small piles, the
remaining two people follow the first and collect the
debris in plastic bags. In some cases, a tractor comes
later to gather the bags, or the same people take the
bags with them to the nearest garbage pick-up location.
Due to the space between the teeth of the rakes (usually
> 1 cm) this tool has little ability of removing pellets
from the beach. On the other hand, the rakes can bury
the pellets under a thin layer of sediment. However, because the methodology used in the present study consisted of sampling the superficial 5 cm of sediment, this
factor was minimized.
Analyzing the composition, size and characteristics of
marine litter is important to understand the significance
of its presence in the environment and, consequently,
the threats imposed by it. The PPI proved to be a useful
and easily applicable tool with great potential in evaluating and monitoring the level of pollution by pellets on
the surface of sandy beaches. The use of the PPI
seemed to be suitable for other places around the globe,
aiding in the comparison of results, which can be difficult due to lack of standardization. Moreover, the index
can be a useful tool to assess the environmental quality
of beaches, indicating the degree of pollution by plastic
pellets.
Such information could help future attempts of removing the anthropogenic plastic component from beach
sediments and other marine environments.
Acknowledgements
G. Fernandino and C. Elliff thank the National Council for Scientific and Technological Development (CNPq) for their postgraduation grants. I.R. Silva also thanks CNPq for the Research Fellowship Grant. All authors are grateful to T. Brito for his valuable
help in the sampling and laboratory activities.
References
Alkalay, R.; Pasternak, G.; Alon, Z. (2007) - Clean-coast index – a
new approach for beach cleanliness assessment. Ocean &
Coastal
Management,
50(5-6):352–362.
DOI:
10.1016/j.ocecoaman.2006.10.002.
Buxton, R.T.; Currey, C.A.; Lyver, P.O’B.; Jones, C.J. (2013) - Incidence of plastic fragments among burrow-nesting seabird
colonies on offshore islands in northern New Zealand. Marine
Pollution
Bulletin,
74(1):420–424.
DOI:
10.1016/j.marpolbul.2013.07.011.
Corcoran, P.L.; Biesinger, M.C.; Grifi, M. (2009) - Plastics and
beaches: a degrading relationship. Marine Pollution Bulletin,
58(1):80–84. DOI: 10.1016/j.marpolbul.2008.08.022.
331
Fernandino et al. (2015)
Costa, M.F.; Ivar do Sul, J.A.; Silva-Cavalcanti, J.S.; Araújo,
M.C.B.; Spengler, A.; Tourinho, P. S. (2010) - On the importance of size of plastic fragments and pellets on the strandline: a
snapshot of a Brazilian beach. Environmental Monitoring and
Assessment, 168(1-4):299–304. DOI: 10.1007/s10661-0091113-4.
D’Antonio, V.J.A.; Pereira, C.D.; Silva Filho, J.I. (2012) - Um
método estatístico/paraconsistente de avaliação quantitativo de
grânulos plásticos (pellets) em praias. UNISANTA – Science and
Technology (ISSN: 2317-1316), 1(2):48–53, University Santa
Cecilia,
SP,
Brazil.
Available
on-line
at
http://periodicos.unisanta.br/index.php/sat/article/download/92/58
Endo, S.; Takizawa, R.; Okuda, K.; Takada, H.; Chiba, K.; Kanehiro, H.; Ogi, H.; Yamashita, R.; Date, T. (2005) - Concentration of polychlorinated biphenyls (PCBs) in beached resin pellets: Variability among individual particles and regional differences. Marine Pollution Bulletin, 50(10):1103–1114. DOI:
10.1016/j.marpolbul.2005.04.030.
EPA – United States Environmental Protection Agency. (1993) Plastic pellets in the aquatic environment: sources and recommendations – final report. EPA 842 – B – 92 – 010. Office of
Water
(WH
–
556F).
Available
on-line
at
http://water.epa.gov/type/oceb/marinedebris/upload/plastic_pellets_final
_report.pdf.
Fernandino, G. (2014) - Ocorrência, Distribuição e Grau de
Poluição por Pellets, Lixo de Praia e Lixo Bentônico nas Praias
do Município de Salvador, Bahia, Brasil. 101p., Master’s
Degree Dissertation, Universidade Federal da Bahia, Salvador,
BA, Brasil. Não publicado.
Fotopoulou, K.N.; Karapanagioti, H.K. (2012) - Surface properties
of beached plastic pellets. Marine Environmental Research,
81:70–77. DOI: 10.1016/j.marenvres.2012.08.010.
Frias, J.P.G.L.; Sobral, P.; Ferreira, A.M. (2010) - Organic pollutants in microplastic from two beaches of the Portuguese coast.
Marine
Pollution
Bulletin,
60(11):1988–1992.
DOI:
10.1016/j.marpolbul.2010.07.030.
Lithner, D.; Larsson, A.; Dave, G. (2011) - Environmental and
health hazard ranking and assessment of plastic polymers based
on chemical composition. Science of the Total Environment,
409(18):3309–3324. DOI: 10.1016/j.scitotenv.2011.04.038.
Manzano, A.B. (2009). Distribuição, taxa de entrada, composição
química e identificação de fontes de grânulos plásticos na
Enseada de Santos, SP, Brasil. 124p. Dissertação de Mestrado,
Universidade de São Paulo, SP, Brasil. Available on-line at
http://www.teses.usp.br/teses/disponiveis/21/21131/tde-30042010104436/pt-br.php.
Ogata, Y.; Takada, H.; Mizukawa, K.; Hirai, H.; Iwasa, S.; Endo, S.;
Mato, Y.; Saha, M.; Okuda, K.; Nakashima, A.; Murakami, M.;
Zurcher, N.; Booyatumanondo, R.; Zakaria, M. P.; Dung, L. Q.;
Gordon, M.; Miguez, C.; Suzuki, S.; Moore, C.; Karapanagioti,
H. K.; Weerts, S.; McClurg, T.; Burres, E.; Smith, W.; Van Velkenburg, M.; Lang, J. S.; Lang, R.C.M.; Laursen, D.; Danner,
B.; Stewardson, N.; Thompson, R.C. (2009) - International pellet watch: global monitoring of persistent organic pollutants
(POPs) in coastal waters. 1. Initial phase data on PCBs, DDTs
and HCHs. Marine Pollution Bulletin, 58(10):1437–1446. DOI:
10.1016/j.marpolbul.2009.06.014.
Rebolledo, E.L.B.; Van Franeker, J.A.; Jansen, O.E.; Brasseur,
S.M.J.M. (2013) - Plastic ingestion by harbour seals (Phoca vitulina) in The Netherlands. Marine Pollution Bulletin, 67(12):200–202. DOI: 10.1016/j.marpolbul.2012.11.035.
Rochman, C.M.; Hoh, E.; Hentschel, B.T.; Kaye, S. (2013) - Longterm Field measurement of sorption of organic contaminants to
five types of plastic pellets: implication for plastic marine debris. Environmental Science & Technology, 47(3): 1646 – 1654.
DOI: 10.1021/es303700s.
Shiber, J.G. (1979) - Plastic pellets on the coast of Lebanon. Marine
Pollution Bulletin, 10(1):28–30. DOI: 10.1016/0025326X(79)90321-7.
Shiber, J.G. (1982) - Plastic pellets on Spain’s ‘Costa del Sol’
beaches. Marine Pollution Bulletin, 13(12):409–412. DOI:
10.1016/0025-326X(82)90014-5.
Gregory, M.R. (1977) - Plastic pellets on New Zealand beaches.
Marine Pollution Bulletin, 8(4):82–84. DOI: 10.1016/0025326X(77)90193-X.
Shiber, J.G.; Barrales-Rienda, J.M. (1991) - Plastic pellets, tar, and
megalitter on Beirut beaches 1977 – 1988. Environmental Pollution, 71(1):17–30. DOI: 10.1016/0269-7491(91)90041-T.
Gregory, M.R. (1978) - Accumulation and distribution of virgin
plastic granules on New Zealand beaches. New Zealand Journal
of Marine and Freshwater Research, 12(4):399–414. DOI:
10.1080/00288330.1978.9515768.
Tourinho, P.S.; Ivar do Sul, J.A.; Fillmann. G. (2010) - Is marine
debris ingestion still a problem for the coastal marine biota of
southern Brazil? Marine Pollution Bulletin, 60(3):396–401.
DOI: 10.1016/j.marpolbul.2009.10.013.
IBGE – Instituto Brasileiro de Geografia e Estatística. (2013) Censo demográfico – Salvador. Available on-line at
Turner, A.; Holmes, L. (2011) - Occurrence, distribution and characteristics of beached plastic production pellets on the island of
Malta (central Mediterranean). Marine Pollution Bulletin,
62(2):377–381. DOI: 10.1016/j.marpolbul.2010.09.027.
http://www.ibge.gov.br/cidadesat/topwindow.htm?1.
Ivar do Sul, J.A.; Spengler, A.; Costa, M.F. (2009) - Here, there and
everywhere: Small plastic fragments and pellets on beaches of
Fernando de Noronha (Equatorial Western Atlantic). Marine
Pollution
Bulletin,
58(8):1236–1238.
DOI
10.1016/
j.marpolbul.2009.05.004.
Karapanagioti, H.K.; Endo, S.; Ogata, Y.; Takada, H. (2011) - Diffuse pollution by persistent organic pollutants as measured in
plastic pellets sampled from various beaches in Greece. Marine
Pollution
Bulletin,
62(2):312–317.
DOI:
10.1016/
j.marpolbul.2010.10.009.
Lima, G.H. (2012) – Caracterização e taxa de entrada de pellets
plásticos na Praia do Tombo do município de Guarujá – SP.
50p. Monografia de Graduação Universidade de São Paulo, SP,
Brasil. Available on-line at http://www.globalgarbage.org/
praia/downloads/projeto_de_formatura_i_gabriel_hirata_de_lima.pdf.
Turra, A.; Manzano, A.B.; Dias, R.J.S.; Mahiques, M.M.; Barbosa,
L.; Balthazar-Silva, D.; Moreira, F.T. (2014) - Threedimensional distribution of plastic pellets in sandy beaches:
shifting paradigms. Nature Scientific Reports, 4:4435. DOI:
10.1038/srep04435.
Yamashita, R.; Takada, H.; Fukuwaka, M.; Watanuki, Y. (2011) Physical and chemical effects on ingested plastic debris on
short-tailed shearwaters, Puffinus tenuirostris, in the North Pacific Ocean. Marine Pollution Bulletin, 62(12):2845–2849. DOI:
10.1016/j.marpolbul.2011.10.008.
Zbyszewski, M; Corcoran, P.L., Hockin (2014) – Comparison of the
distribution and degradation of plastic debris along shorelines of
the Great Lakes, North America, Journal of Great Lakes Research, 40(2):288–299. DOI: 10.1016/j.jglr.2014.02.012.
332
Baixar