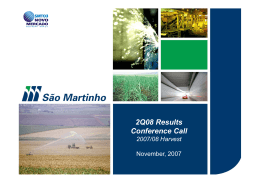
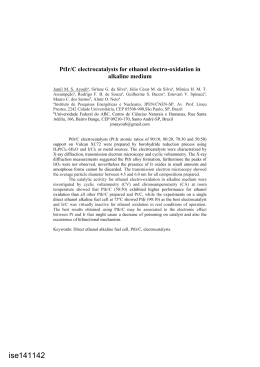
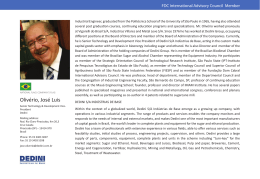
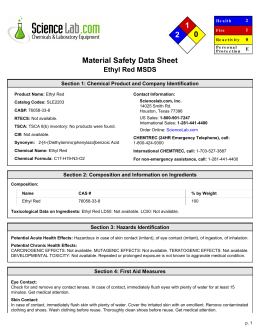
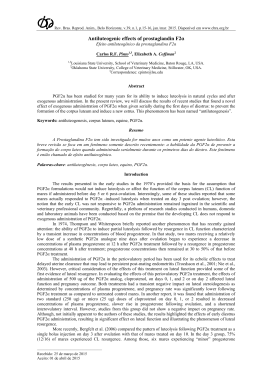
Forensic Science International 242 (2014) 117–122
Contents lists available at ScienceDirect
Forensic Science International
journal homepage: www.elsevier.com/locate/forsciint
Oral fluid as an alternative matrix to determine ethanol for forensic
purposes
Laı́s Helena Picolo Bueno a,*, Ricardo Henrique Alves da Silva b, Aline Vieira Azenha a,
Mariane Cristine de Souza Dias a, Bruno Spinosa De Martinis a
a
Laboratório de Análises Toxicológicas Forenses, Departamento de Quı´mica, Faculdade de Filosofia, Ciências e Letras de Ribeirão Preto,
Universidade de São Paulo, Brazil
b
Departamento de Estomatologia, Saúde Coletiva e Odontologia Legal, Faculdade de Odontologia de Ribeirão Preto, Universidade de São Paulo, Brazil
A R T I C L E I N F O
A B S T R A C T
Article history:
Received 24 February 2014
Received in revised form 10 June 2014
Accepted 21 June 2014
Available online 30 June 2014
The present work aimed to evaluate whether it is possible to use oral fluid to monitor alcohol in drivers.
In a control experiment the subjects ingested beer with an alcoholic percentage of 4.7%, in an amount
that furnished 0.5 g ethanol per kg of body weight. Volunteer’s urine, oral fluid, and breath were
collected at 10, 30, 60, and 90 min after alcohol intake. Urine and oral fluid were analyzed by gas
chromatography with FID (Flame Ionization Detector); breath was analyzed by Alcotest 7410 (Dräger).
The absorption profiles correlated well. The Pearson correlation value between samples of oral fluid
and urine, and oral fluid and exhaled air, was close to 1, showing that oral fluid is a promising matrix to
monitor drivers in traffic or involved in accidents.
ß 2014 Elsevier Ireland Ltd. All rights reserved.
Keywords:
Alcohol
Oral fluid
Urine
Breath
Gas chromatography
1. Introduction
Ethanol is widely consumed in most societies. Despite being a
psychotropic drug, its use is not proscribed, so it is available for any
individual of legal age to consume [1].
Alcohol acts on the central nervous system and elicits side
effects that are particularly harmful to drivers: it impairs motor
coordination, vision and reaction time, negatively affecting the
driver’s ability to conduct vehicles [1,2]. Therefore, ethanol is often
the underlying cause of traffic accidents [3–7]. This causal
relationship has led many countries to adopt laws that discourage
intake before driving [8].
In Brazil, the Brazilian Traffic Code establishes the limit of
ethanol allowed in drivers blood and exhaled air, a measure known
as Dry Law. This code makes driving under the influence of any
blood ethanol concentration and ethanol concentration in breath
equal to or higher than 0.05 mg of ethanol per liter of exhaled air a
criminal offense. In addition to ethanol, the use of psychoactive
substances prohibited by law, such as cocaine, marijuana and
* Corresponding author. Tel.: +55 16 36020471.
E-mail addresses: [email protected], [email protected]
(L.H.P. Bueno).
http://dx.doi.org/10.1016/j.forsciint.2014.06.024
0379-0738/ß 2014 Elsevier Ireland Ltd. All rights reserved.
amphetamines, is not allowed, either. In all cases, the driver
receives punishment [9].
To monitor drivers and collect evidence, police officers use
portable alcometers and blood alcohol tests. If none of these
procedures are feasible the police officer must rely on other ways
to prove that drivers are intoxicated with alcohol, i.e., clinical
examinations, videos, testimonial evidence, or other strategies
allowed by law [9].
Regarding tests in biological samples, bodily fluids such as
breath, oral fluid, and urine offers advantages over blood:
collection is not invasive and does not require specialized
personnel either. Ethanol analysis in breath and urine are well
known and often applied to screen ethanol in drivers [10–14],
however, oral fluid is not commonly used, despite the fact that
literature studies have evaluated the validity of its use to
investigate ethanol [14–18]. Oral fluid is a good choice once it
has a non-invasive way of collection and besides does not entail
privacy invasion if an assisted collection is required to avoid
sample adulteration.
Devices that can analyze ethanol in breath are very useful to
estimate blood alcohol concentration in drivers when it is needed
to monitor them in traffic, due to the fact that it is a portable
measure instrument. The disadvantage of such dispositive is that
the analysis can’t be repeated, but when drive’s oral fluid is
collected, different laboratories can confirm the driver’s abuse of
118
L.H.P. Bueno et al. / Forensic Science International 242 (2014) 117–122
alcohol by repeating the determination of ethanol in oral fluid if the
sample chain of custody is preserved.
Oral fluid, or oral fluid secretion, involves three major oral fluid
glands: parotid, submaxillary and sublingual. The degree to which
each gland contributes to oral fluid composition depends on
several factors such as the type, duration and intensity of
stimulation; time of day; diet; age; gender; and physical status.
Furthermore, the pH of oral fluid varies among individuals and
within the subject. Variation of pH does not constitute a problem
for ethanol analysis, unlike other drugs, alcohol distribution
depends on the amount of water in the fluid, which is not a
function of pH [19].
It is possible to obtain oral fluid samples in different ways:
allowing oral fluid to flow from the oral cavity to a recipient,
aspirating the sample through a vacuum tube, or placing a small
cotton roll in the mouth to stimulate the formation of oral fluid and
retain the liquid [20]. In addition to cotton, other stimulants can be
used, such as paraffin and citric acid [21,22]. Generally, about 1–
5 mL of oral fluid is available for collection, which is a small volume
compared with the amounts of urine that can be collected (greater
than 50 mL) [23].
It is possible to conduct analysis in oral fluid, urine, or blood by
gas chromatography using the headspace technique which
consists of heating the sample inside a glass vial equipped with
a sealed cap and a septum. The volatile analyte evaporates inside
the vial, to form a vapor phase called headspace. With a syringe,
one pierces the septum with a needle and collects the analyte free
from sample interferents and injects it into the gas chromatography port. Hence, preparing oral fluid and urine samples by
headspace methodology to determine ethanol does not demand
complicated procedures, the alcohol vaporizes easily under slight
heating, and the resulting vapor phase without interferents can be
injected into the equipment [14,24].
When oral fluid or exhaled air samples are collected near the
time of drug or alcohol consumption, it is probable that the sample
will contain ethanol residues that remained in contact with the
oral cavity [21,25]. This could increase the concentration of the
analyte in the sample and generate erroneous results.
To assess whether it is feasible to use oral fluid samples to
determine the presence of ethanol in the body for forensic purposes,
we performed a study in which, healthy volunteers consumed
alcohol in a controlled manner. Then, oral fluid, urine, and exhaled
air samples were collected at different times; the ethanol
concentrations in these samples were determined and compared.
2. Materials and methods
2.1. Materials
Ethanol (J.T. Baker, Mexico), HPLC grade, was used for
calibration; isobutanol (Merk, Germany), analytical grade, was
the internal standard; NaCl (Synth, São Paulo), analytical grade,
was used to increase ethanol and isobutanol concentration in the
vapor phase by salting-out effect. The 20 mL headspace vials were
purchased from Sun Sri, Spain and the Salivette1 devices from
Sarstedt AG & Co, Germany.
Working standard solutions (10 and 100 g L 1) were prepared
by appropriate dilution of ethanol in deionized water. Internal
standards were prepared in 500 mL of deionized water with
150 mL of isobutanol and 1 g of NaCl.
2.2. Methods
2.2.1. Validation procedures
To validate the method, parameters such as linearity, precision
(intra-day and inter-day) and accuracy, carryover, selectivity,
sensitivity, and analyte stability were evaluated. The method was
validated using oral fluid and urine.
2.2.2. Linearity
Seven calibration points were used to perform the linearity
study. Ethanol-free oral fluid and urine were spiked with ethanol
(HLPC grade) in order to obtain concentrations of 0.1, 0.2, 0.5, 1.0,
2.0, 3.0 and 4.0 g of ethanol per liter of bodily fluid. These solutions
were added in a headspace vial with internal standard solution in
amounts of 100 mL and 500 mL respectively. After heating the vial
at 80 8C for 10 min, 400 mL of the headspace were collected for
analysis.
The linearity was expressed as the coefficient of determination
(R2), and it was evaluated from a least square regression line
calculated from all the standard concentrations. The calibrator
concentrations were required to be within 15% of the target when
calculated against the full calibration curve.
2.2.3. Precision and accuracy
It was used, to determine the precision and accuracy, three
Quality Controls (QC) samples, QC1 (low), QC2 (medium) and QC3
(high). The QC ethanol concentrations were, respectively, 0.5, 2.0
and 3.0 g L 1.
The precision and accuracy assay were performed by analyzing
five replicates of each QC samples. Inter-assay precision was
determined on three consecutive days (n = 15), and intra-assay
precision was calculated from 5 replicate determinations per
concentration in one assay batch. Data were evaluated by
examining the variance in each group (intra- and inter-day),
which were established by the RSD%.
Precision was measured as the Relative Standard Deviation
(RSD%) which values should be better than 15%. Accuracy was
determined by comparing measured concentrations with target
values and expressed as the percentage of the target concentration.
Accuracy values should fall within 15%.
2.2.4. Carryover
Carryover was determined by analysis of a blank oral fluid and
urine specimen immediately after the analysis of the highest point
of the calibration curve (4.0 g L 1).
2.2.5. Selectivity
The method conditions were tested to see if it allows good
separation of ethanol from other volatiles that may be present in
oral fluid and urine, such as methanol and ketone. Oral fluid and
urine blank samples were fortified with ethanol, methanol and
ketone at concentration of 0.2 g L 1. Their retention times had to
be within 0.2 min of the mean calibrator retention time.
2.2.6. Sensitivity
It was defined by lower limits of detection (LLOD) and lower
limits of quantification (LLOQ); it was determined empirically
through oral fluid and urine specimens fortified with different
decreasing concentrations of ethanol. LLOD and LLOQ were
established at a signal-to-noise ratio of at least 3:1 and 10:1
respectively.
Precision and accuracy at LLOQ concentrations were according
to acceptable criteria (RSD 20%).
2.2.7. Analyte stability
The stability assay was assessed using ethanol-free urine and oral
fluid samples in triplicate fortified with ethanol at 0.5 g L 1 (QC low)
and 3.0 g L 1 (QC high) both were storage in the respective sample
collection devices, Salivette1 for oral fluid and 80 mL plastic
container for urine. The storage conditions studied were: room
temperature for 24 h; three freeze–thaw cycles (12, 24 and 36 h),
L.H.P. Bueno et al. / Forensic Science International 242 (2014) 117–122
Table 1
Description of the volunteers, by gender, body mass, beer volume, and amount of
ingested ethanol.
Volunteers
Gender
Body
weight (kg)
Volume
of beer
ingested (mL)
Amount of
ethanol (g)
1
2
3
4
5
6
7
8
9
10
Female
Female
Female
Female
Female
Male
Male
Male
Male
Male
64
54
67
66
71
90
95
74.5
89
53
838
707
877
864
930
1178
1244
975
1165
694
32.0
27.0
33.5
33.0
35.5
45.0
47.5
37.2
44.5
26.5
each cycle 100 mL of QC was taken for analysis, and storage at 5 8C
for 7 days. The concentrations obtained after each assayed condition
were compared with those from freshly prepared samples.
2.2.8. Volunteers
The individuals who participated in the study were in good
health and had exhaled air alcohol concentrations equal to zero, as
revealed by a Breathalyzer test before alcohol intake. All the
participants signed an informed consent form. For the volunteer’s
safety, their release from the experimental site was allowed only
after the Breathalyzer test confirmed zero ethanol concentration.
Ten volunteers, five men and five women, aged 20–31 years and
weighing 53–95 kg weight were included in the study.
2.2.9. Ethanol administration
The amount of ethanol that each individual ingested was
restricted to 0.5 g ethanol per kg of body weight. The alcoholic
beverage was beer with 4.7% alcohol. The volunteers consumed
beer with an empty stomach after fasting for at least 2 h. They were
allowed 20 min to ingest the beverage but the average duration of
alcohol intake was 10 min. Table 1 provides information such as
gender, weight, volume, and quantity of beer and ethanol
consumed by the volunteers.
2.2.10. Sample collection
Oral fluid samples were collected using a commercial collection
device Salivette1 (Fig. 1). The device consists of two tubes – one
contained an orifice in the bottom as well as a piece of cotton that is
placed in the mouth to stimulate the formation of oral fluid and
absorb the secreted oral fluid. After sample collection, the cotton
soaked with oral fluid was centrifuged at 2500 rpm for 5 min; the
[(Fig._1)TD$IG]oral fluid leaked to the second tube through the orifice.
119
Urine samples were collected in a 80 mL plastic collector;
exhaled air was collected and analyzed directly on the breathalyzer. Sampling occurred at 30, 60, and 90 min after ingestion of the
beer. The oral fluid and urine samples were stored at 20 8C until
analysis.
2.2.11. Sample preparation
Ethanol was extract from oral fluid and urine by headspace
technique. The bodily fluids were prepared for analysis adding
100 mL of the sample and 500 mL of the internal standard solution
in 20 mL vial sealed with silicon/PTFE septa and steel caps. The vial
was heated at 80 8C for 10 min and a volume of 400 mL of the vapor
phase was collected for injection.
2.2.12. Equipment and analytical conditions
Ethanol analysis in oral fluid and urine was accomplished using
the gas chromatograph model 7890 A (Agilent Technologies) with
Flame Ionization Detector (FID).
A fused silica capillary column from Ohio Valley,
30 m 0.25 mm 0.25 mm in polyethylene glycol was used.
Nitrogen was the carrier gas at a flow rate of 1 mL min 1. The
detector and injector were maintained at 300 8C and 250 8C,
respectively. The sample was introduced in the split injection
mode. The following column temperature program was employed:
50 8C for 2 min; temperature rise to 200 8C at a heating rate of
20 8C min 1.
The ethanol concentration in breath was measured with an
Alcotest 7410 (Dräger, Germany) breathalyzer. The volunteers
provided a sample by blowing up directly at the instrument using a
disposable blow device, the concentration of ethanol in breath was
available immediately but the instrument need an interval
between to measurements to get ready for another sample. It
was observed that the instrument fails to measure ethanol
concentration in breath when the test is performed right after
drink ingestion, due the residual alcohol in mouth as demonstrated
by Barquin et al. [26]. To avoid wrong interpretation results, the
measurements are presented at 30 min after beer ingestion.
3. Results and discussion
Calibration curves were obtained from 0.1 to 4.0 g L 1 of ethanol,
linearity was observed under concentration 10 g L 1. The linear
regression equations and coefficients of correlation were: oral fluid:
y = 0.217x 0.0153, r2 = 0.999; urine: y = 0.1885x 0.0014,
r2 = 0.999.
Lower limits of detection and quantification, intra-assay and
inter-assay precision and accuracy were adequate for the purposes
of the present study, Table 2 presents the corresponding data.
Intra-assay precision ranged from 1.0 to 2.2% (RSD) for oral fluid
Fig. 1. Representation of the device used to collect oral fluid (Salivette1).
[(Fig._2)TD$IG]
L.H.P. Bueno et al. / Forensic Science International 242 (2014) 117–122
120
Table 2
Lower limits of detection (LLOD), lower limits of quantification (LLOQ), precision
(RSD%) and accuracy of intra (n = 5) and inter-assays (n = 15).
Oral fluid
LLOD
LLOQ
0.005 g L
0.1 g L 1
Urine
1
0.005 g L
0.1 g L 1
Oral fluid
Urine
RSD%
Intra-assay
CQ1
CQ2
CQ3
Inter-assay
CQ1
CQ2
CQ3
1
Accuracy%
RSD%
Accuracy%
1
2.2
1.7
7.8
0.1
0.4
1.3
1.1
1.1
2.1
0.4
0.9
3.1
1.7
0.2
11.6
0.5
0.6
5.3
7.3
4.1
6.2
0.6
2.9
and from 1.1 to 1.3% for urine. Inter-assay precision ranged from
0.2 to 3.1% for oral fluid and from 4.1 to 7.3 for urine. Intra-assay
accuracy ranged from 0.4 to 2.1% and inter-assay from 0.6 to
6.2.
There was no interference at the same retention time of ethanol
when methanol or ketone was present and no carry over was
observed. The samples demonstrated to be stable at all conditions
studied.
Fig. 2 shows a representative chromatogram of the urine
analysis for volunteer 7 after 30 min of beer ingestion. Using a
method based at the one described in De Martinis et al. [24], the
peaks of the target analyte (ethanol) and internal standard
(isobutanol) are well resolved. Table 3 lists ethanol concentrations
in exhaled breath, oral fluid, and urine vs. time after ingestion of
alcoholic drinks.
To illustrate the ethanol absorption and elimination profile in
the body, we associated the average concentrations with the time
elapsed since ingestion. For comparison purposes, Figs. 3 and 4
present the ethanol concentrations in oral fluid and breath, and
Figs. 5 and 6 depict the ethanol concentrations in oral fluid and
urine for men and women volunteers.
Gubala and Zuba [18] analyzed ethanol concentrations in oral
fluid and breath after controlled intake of beverages. The ethanol
concentration curves vs. time for the oral fluid and exhaled air
samples were similar. In the present study, we obtained the same
profile for oral fluid and breath, and for oral fluid and urine, with
differences between genders.
Table 3 reveals that the maximum mean ethanol concentration
in urine occurs at 30 min, reaching values of 0.39 g L 1 and
Fig. 2. Chromatographic profile for ethanol analysis a urine sample obtained from
volunteer 7 after 30 min of beer ingestion.
0.44 g L 1 for women and men respectively. In a study by De
Martinis et al. [24] in which volunteers ingested the same amount
of ethanol (0.5 g ethanol/kg body weight), the maximum ethanol
concentrations in the urine sample were lower, 0.35 g L 1 and
0.28 g L 1 for women and men respectively and besides it was
achieved 30 min later: between 90 and 120 min of beer ingestion.
De Martinis et al. [24] conducted the experiment after the
volunteers had ingested food, which may have delayed ethanol
absorption by the small intestine.
According to Baselt [2], the presence of food in the stomach
decreases the ethanol concentration and it takes longer to reach
the ethanol concentration peak in the blood because ethanol
absorption is slower. Thus, the presence of food can also influence
the ethanol concentration in other bodily fluids, since the
occurrence of ethanol in other parts of the body depends on the
presence of ethanol in the blood.
Maximum ethanol concentrations in oral fluid occur at different
times for men and women: 0.14 g L 1 at 30 min and 0.21 g L 1 at
60 min, respectively (Table 3).
Table 3
Concentration of ethanol in breath, urine, and oral fluid at 30, 60, and 90 min after beer intake and before the beginning of the experiment (time 0), for female (1–5) and male
volunteers (6–10).
Ethanol concentration according to the time of sample collection (min)
Breath (mg L
1
2
3
4
5
Average
6
7
8
9
10
Average
1
)
Urine (g L
1
)
Oral fluid (g L
1
)
0
30
60
90
0
30
60
90
0
30
60
90
0
0
0
0
0
0
0
0
0
0
0
0
0.27
0.25
0.25
0.26
0.20
0.26
0.27
0.27
0.27
0.25
0.25
0.25
0.19
0.23
0.23
0.19
0.21
0.21
0.15
0.26
0.23
0.22
0.16
0.20
0.10
0.20
0.20
0.20
0.20
0.18
0.10
0.20
0.20
0.20
0.10
0.16
0
0
0
0
0
0
0
0
0
0
0
0
0.25
0.42
0.37
0.38
0.52
0.39
0.12
0.57
0.54
0.41
0.56
0.44
0.51
0.32
0.23
0.41
0.18
0.33
0.11
0.61
0.26
0.46
0.26
0.34
0.19
0.18
0.14
0.27
0.26
0.21
0.17
0.49
0.32
0.29
0.34
0.32
0
0
0
0
0
0
0
0
0
0
0
0
0.01
0.20
0.15
0.02
0.40
0.16
0.39
0.21
0.05
0.01
0.04
0.14
0.03
0.39
0.08
0.16
0.40
0.21
0.26
0.12
0.15
0.07
0.07
0.13
0.04
0.06
0.02
0.09
0.29
0.10
0.05
0.15
0.02
0.06
0.01
0.05
[(Fig._3)TD$IG]
[(Fig._6)TD$IG]
L.H.P. Bueno et al. / Forensic Science International 242 (2014) 117–122
0.25
0.5
0.20
0.4
121
0.16
0.30
0.15
0.10
0.10
0.08
0.2
0.06
0.04
0.1
-1
-1
0.05
0.10
0.3
-1
-1
0.15
0.12
0.02
0.05
0.00
0.00
0
20
40
60
80
0.00
0.0
100
0
Minutes
[(Fig._4)TD$IG]
0.16
0.25
0.14
0.12
0.20
0.10
0.15
0.08
0.06
0.10
0.04
-1
Oral Fluid (g.L )
-1
40
60
80
-0.02
100
Urine
Oral fluid
Fig. 3. Ethanol concentration in breath and oral fluid at 30, 60, and 90 min, after beer
ingestion for women (volunteers 1–5).
Breath (mg.L )
20
Minutes
Breath
Oral fluid
0.05
0.02
0.00
0.00
0
Oral fluid (g.L )
0.20
Oral fluid (g.L )
Breath (mg.L )
0.25
Urine (g.L )
0.14
20
40
60
80
-0.02
100
Minutes
Breath
Oral fluid
Fig. 4. Ethanol concentration in breath and oral fluid at 30, 60, and 90 min, after beer
ingestion for men (volunteers 6–10).
[(Fig._5)TD$IG]
Fig. 6. Ethanol concentration in urine and oral fluid at 30, 60, and 90 min after beer
ingestion for men (volunteers 6–10).
Jones [25] detected maximum ethanol concentration in oral
fluid at 40 min after ethanol intake of 0.68 g/kg in men who had
been fed prior to the experiment. Giang [14] achieved maximum
ethanol concentration after 60 min for both genders, when
volunteers also ingested food together with a larger ethanol
concentration (0.8 g/kg for women and 1.00 g/kg for men).
For men, on average, the maximum ethanol concentration was
reached in a shorter time as compared with data reported by Jones
[25] and Giang [14], whose studies involved the presence of food.
However, the time that was necessary to achieve maximum
alcohol concentration for women took place at 60 min as in the
study by Giang [14]. The composition of oral fluid depends on
several parameters such as gender, individual’s conditions and
type, and duration of oral fluid secretion as cited previously [19].
To verify how the ethanol concentration in oral fluid and breath,
and oral fluid and urine correlated, we investigate whether a linear
association existed between the concentrations using the Pearson
correlation. Oral fluid significantly correlated with urine and
breath. The closer to 1 unit (in module) the value of the correlation,
the greater the degree of linear statistical dependence between the
variables [27]. Hence, the ethanol concentrations in oral fluid
strongly correlate with the ethanol concentrations in breath and
urine – the Pearson correlation values between oral fluid and
breath were 0.88 and 0.96 and for oral fluid and urine were 0.93
and 0.91 for women and men respectively.
0.25
0.40
0.35
4. Conclusion
0.20
0.30
-1
0.10
0.15
0.10
0.05
-1
Urine (g.L )
0.20
Oral fluid (g.L )
0.15
0.25
0.05
0.00
0.00
-0.05
0
20
40
60
80
100
Minutes
Urine
Oral fluid
Fig. 5. Ethanol concentration in urine and oral fluid at 30, 60, and 90 min after beer
ingestion for women (volunteers 1–5).
The ethanol absorption profile of oral fluid resembles the profile
of exhaled air and urine in both genders as demonstrated by
Pearson’s correlation.
The ethanol concentration in oral fluid depends on the ethanol
concentration in the blood. However, the legislation permits
ethanol level equal to zero in driver’s blood: Therefore, the oral
fluid sample is applicable to monitor drivers, since it may indicate
alcohol intake and, thus, blood alcohol levels above the zero limit.
Compared with blood, oral fluid provides a noninvasive way of
collecting sample for alcohol analysis and even for analysis of other
drugs prohibited by law, when employing the proper technique.
Furthermore, compared with breath, saliva allows repeating the
analysis if storage properly to preserve the ethanol concentration
level at the time of collection, which indicates that oral fluid is a
promising matrix to monitor traffic and drivers involved in
accidents. The use of oral fluid to determine ethanol intake should
122
L.H.P. Bueno et al. / Forensic Science International 242 (2014) 117–122
be interpreted as an independent analysis to evaluate a driver’s
sobriety and it cannot exclude the alcohol dosage in blood.
To better assess the validity of using oral fluid as a biological
sample to investigate ethanol in the forensic field, it is necessary to
evaluate other products such as food (chocolate candies containing
liquor), medicines containing alcohol in the formulation, and oral
care products such as mouthwashes, because they could affect
ethanol levels in breath and oral fluid.
Acknowledgments
We would like to thanks FAPESP 2010/07508-1 (São Paulo
Research Foundation) by the financial support and CAPES
(Brazilian Coordination for the Improvement of Higher Education
Personnel) for the Master fellowship to Lais Helena Picolo Bueno.
References
[1] B.S. De Martinis, M.F. Oliveira, Exame do teor alcoólico em acidentes de trânsito,
in: A.T. Bruni, J.A. Velho, M.F. Oliveira (Eds.), Fundamentos de Quı́mica Forense,
Editora Millennium, Campinas, 2012, pp. 106–121.
[2] R.C. Baselt, Disposition of alcohol in man, in: J.C. Garriot (Ed.), Medicolegal Aspects
of Alcohol, Lawyers & Judges Publishing Company, Tucson, 1996, pp. 65–78.
[3] M.C. del Rio, F.J. Alvarez, Alcohol use among fatally injured drivers in Spain,
Forensic Sci. Int. 104 (1999) 117–125.
[4] P. Holmgren, A. Holmgren, J. Ahlner, Alcohol and drugs in drivers fatally injured in traffic
accidents in Sweden during the years 2000–2002, Forensic Sci. Int. 151 (2005) 11–17.
[5] R.E. Pereira, G.S.C. Perdoná, L.C. Zini, et al., Relation between alcohol consumption
and traffic violations and accidents in the region of Ribeirao Preto, Sao Paulo State,
Forensic Sci. Int. 207 (2011) 164–169.
[6] J.C. Ponce, D.R. Munoz, G. Andreuccetti, et al., Alcohol-related traffic accidents
with fatal outcomes in the city of Sao Paulo, Accid. Anal. Prev. 43 (2011) 782–787.
[7] H. Poulsen, R. Moar, C. Troncoso, The incidence of alcohol and other drugs in drivers
killed in New Zealand road crashes 2004–2009, Forensic Sci. Int. 223 (2012) 364–370.
[8] M.A. Schuckit, Ethanol and methanol, in: L.L. Brunton, B.A. Chabner, B.C. Knollmann (Eds.), Goodman and Gilman’s The Pharmacological Basis of Therapeutics,
The McGraw-Hill Companies, 2011, pp. 629–647.
[9] CONTRAN Resolução n8 432 de 23 de janeiro de 2013, Código de Trânsito
Brasileiro, 2013.
[10] A.R. Gainsford, D.M. Fernando, R.A. Lea, et al., A large-scale study of the relationship between blood and breath alcohol concentrations in New Zealand drinking
drivers, J. Forensic Sci. 51 (2006) 173–177.
[11] A.R. Stowell, A.R. Gainsford, R.G. Gullberg, New Zealand’s breath and blood
alcohol testing programs: further data analysis and forensic implications, Forensic Sci. Int. 178 (2008) 83–92.
[12] A.W. Jones, F.C. Kugelberg, Relationship between blood and urine alcohol
concentrations in apprehended drivers who claimed consumption of alcohol
after driving with and without supporting evidence, Forensic Sci. Int. 194 (2010)
97–102.
[13] J. Bergström, A. Helander, A.W. Jones, Ethyl glucoronide concentrations in two
successive urinary voids from drinking drivers: relationship to creatinine content
and blood and urine ethanol concentrations, Forensic Sci. Int. 133 (2003) 86–94.
[14] Y.S. Giang, S.M. Wang, C.C. Tsai, et al., Analyzing alcohol in breath, blood, oral
fluid, and urine for forensic purposes: Taiwanese population, Forensic Sci. J. 6 (1)
(2007) 1–19.
[15] J. Ruz, A. Fernandez, M.D.L. De Castro, et al., Determination of ethanol in human
fluids—II. Determination of ethanol in urine, breath and saliva, J. Pharm. Biomed.
Anal. 4 (1986) 559–564.
[16] P. Bendtsen, J. Huffberg, M. Carlsson, et al., Monitoring ethanol exposure in a
clinical setting by analysis of blood, breath, saliva and urine, Alcoholism 23 (1999)
1446–1451.
[17] K.E.L. Mccoll, B. Whiting, M.R. Moore, et al., Correlation of ethanol concentrations
in blood and saliva, Clin. Sci. 56 (1979) 283–286.
[18] W. Gubala, D. Zuba, Oral fluid as an alternative specimen for alcohol determination in the human body, Pol. J. Pharmacol. 54 (2002) 161–165.
[19] Y.H. Caplan, Blood, urine, and other fluid and tissue specimens for alcohol
analyses, in: J.C. Garriot (Ed.), Medicolegal Aspects of Alcohol, Lawyers & Judges
Publishing Company, Tucson, 1996, pp. 137–144.
[20] M. Yonamine, A oral fluid como espécime biológico para monitorar o uso de
álcool, anfetamina, metanfetamina, cocaı́na e maconha por motoristas
profissionais, Universidade de São Paulo, 2004.
[21] E.J. Cone, J. Oyler, W.D. Darwin, Cocaine disposition in oral fluid following
intravenous, intranasal, and smoked administration, J. Anal. Toxicol. 21 (1997)
465–475.
[22] N. Enberg, H. Alho, V. Loimaranta, et al., Saliva flow rate, amylase activity, and
protein and electrolyte concentrations in oral fluid after acute alcohol consumption, Oral Surg. Oral Med. Oral Pathol. Oral Radiol. Endod. 92 (2001) 292–298.
[23] D.A. Kidwell, J.C. Holland, S. Athanaselis, Testing for drugs of abuse in oral fluid
and sweat, J. Chromatogr. B 713 (1998) 111–135.
[24] B.S. De Martinis, M.A.M. Ruzzene, C.C.S. Martin, Determination of ethanol in
human blood and urine by automated headspace solid-phase microextraction
and capillary gas chromatography, Anal. Chim. Acta 522 (2004) 163–168.
[25] A.W. Jones, Pharmacokinetics of ethanol in oral fluid: comparison with blood and
breath alcohol profiles, subjective feelings of intoxication, and diminished performance, Clin. Chem. 39 (9) (1993) 1837–1844.
[26] J. Barquin, J.D. Luna, A.F. Hernandez, A controlled study of the time-course of
breath alcohol concentration after moderate ingestion of ethanol following a
social drinking session, Forensic Sci. Int. 177 (2008) 140–145.
[27] D. Filho, Desvendando os Mistérios do Coeficiente de Correlação de Pearson (r),
Rev. Pol. Hoje 18 (2009) 115–146.
Baixar