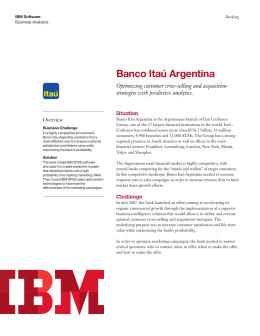
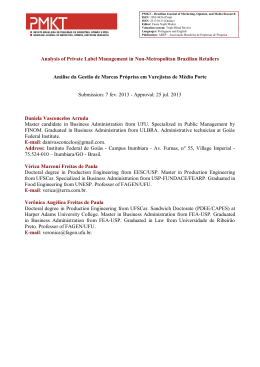
Retail
Understanding leading retailers
Insights from the IBM Retail Merchant survey
2
Understanding leading retailers
In the digital age, customers sit in the driver’s
seat. The most successful retailers have responded
by putting shoppers at the heart of the merchandising process. We’ve identified a small group of
firms that outperform their peers, thanks in part
to three traits: they have merchandising functions
that are customer-oriented, collaborate across
internal and external boundaries and use
analytics to make smarter business decisions.
The term “customer-centric” has almost become a cliché.
Search for it on Google and you’ll get more than 12 million
hits, as retailers everywhere talk about focusing on digitally
enfranchised shoppers and providing a more personalized,
interactive experience.1 But our research shows that the
majority of retailers are still struggling to become customeroriented. The most successful retailers, by contrast, put the
customer at the heart of the merchandising process.
The best and the rest
Empowered customers are changing how they shop – and most
merchandising executives realize they have to raise their game.
A full 83 percent of those we recently surveyed told us they’re
concerned about how to respond to shifts in the way customers
engage with retailers, while 78 percent worry about being able
to provide a holistic, cross-channel experience.
But recognizing and resolving a problem are quite different
things. Two-thirds of respondents admit that their
merchandising function still focuses primarily on products or
categories, not customers. And three-quarters say there’s very
little, if any, collaboration between the marketing and
merchandising functions.
About the study
The IBM Center for Applied Insights, in conjunction with
Planet Retail, surveyed 325 senior merchandising executives in
the United States, Canada, the United Kingdom, India and
Australia, in 2013. These respondents cover 10 retail segments,
including grocery, mass merchandise and apparel. Forty-eight
percent of them work in large enterprises (employing 1,000
or more people), while 52 percent work in medium-sized
enterprises (employing 100-999 people).
When we probed more deeply, though, we identified a small
cadre of retailers with merchandising functions that are both
customer-oriented and collaborative. They also rely much
more heavily on analytics to drive customer insights into the
merchandising process.
These “Leaders,” as we call them, have yet another
distinguishing trait; they’re more successful than their rivals.
When customers visit a Leader’s store, they tend to spend
more than they do when they visit those of other retailers. And
what happens on Main Street filters through to Wall Street.2
Between 2009 and 2012, the Leaders that are publicly traded
saw their stock prices climb as much as three times faster
than the rest (see Figure 1). So what, exactly, are the leaders
doing differently?3
3
Distinguishing the Leaders
1.4x
3x
40%
29%
30%
10%
% of respondents
with an average customer
spend per visit >100
Customer focus
High
Leading merchandisers
All other merchandisers
2009-2012
Stock Price CAGR
26%
15%
47%
12%
Low
Collaboration with marketing
Low
Figure 1 – Customer-oriented, collaborative Leaders sell more and see benefits in stock price increases.
High
4
Understanding leading retailers
Concentrating on our customers
But this emphasis on the customer isn’t confined to merchandising. It applies to the organization as a whole. More than
half of the Leaders have top executives trained to understand
the needs of customers. And more than half employ a
specific individual or team – be it a Chief Customer Officer,
Customer Council or other such entity – to manage their
customer capabilities. That’s double the level in other retailers
(see Figure 2).
For a start, they are focusing much more sharply on the
customer. Compared with other retailers, the Leaders are
almost twice as likely to have merchandising functions that
pay close attention to the cues customers provide. “We analyze
the daily transactions in the store and make all our planning
and pricing decisions accordingly,” a U.K. merchandising
executive explained.
Customer focus is pervasive
The organization’s customer-centric capabilities are managed
by a dedicated individual or team (e.g., a Chief Customer Officer,
VP of Sales, Customer Council, etc.).
54%
27%
Business leaders have skills and are trained in understanding
customer needs.
56%
26%
There is a dedicated budget for customer-centric capabilities.
40%
20%
Customer-centric capabilities are measured using a dedicated
set of metrics.
33%
21%
Leading merchandisers
All other merchandisers
Figure 2 – Leaders place more weight on customer focus throughout their organizations.
2x
2.2x
2x
1.6x
5
The Leaders are also twice as likely to earmark part of their
budgets expressly for honing their customer skills. And they’re
more likely to use dedicated metrics to measure their
performance against customer-oriented goals. Relatively few
other retailers do either of these things.
In addition, many more Leaders draw on the customer insights
they’ve gleaned to make merchandising decisions, whether
that’s choosing which products to carry, how to display them
or how to price and promote them. And they drive information
on customers’ buying behavior back through the supply chain
to keep the right amounts of stock in the right places at the
right times. “Being able to see what we’re selling and not
selling, and which items aren’t worth carrying, is incredibly
valuable,” a Canadian merchandising executive noted.
U.S. mass merchant studies individual customers to
serve them better
Studying the purchasing behavior of individual customers
has helped a well-known mass merchant in the United
States grow top-line sales for key categories by more than
three percent. It spotted a number of new opportunities
for selling home care products, discovered and filled a hole
in its portfolio of personal care products and identified a
new, more effective way of merchandising softlines. It
also learned that it needed to allocate more shelf space
for white-label foods and pinpointed where it could save
space by cutting the range of brands it stocked.
Careful analysis of what its customers bought unearthed
several other insights. For example, shoppers who bought
branded items in one category tended to buy branded
items in sister categories, and certain brands were particularly popular with high-spending shoppers, even though
sales in the overall category were flat. Armed with this
information, the retailer could co-promote related products
and display them together. It could also promote the
brands that attracted the big spenders more heavily,
thereby encouraging these customers to visit its stores
more frequently and spend more while they were there.
6
Understanding leading retailers
Collaborating inside and across
corporate boundaries
Intense customer focus is one feature that separates the
Leaders from other retailers. A second is the degree to which
they collaborate across organizational and functional
boundaries. Sixty percent of the Leaders have merchandising
functions that work closely with external suppliers to develop
new products, and 58 percent jointly analyze customer data.
Similarly, 67 percent consult suppliers when they’re devising
new pricing strategies, and 69 percent do so when developing
new promotional strategies.
The merchandising functions in lower-performing retailers
tend to be much more “isolationist.” Only a quarter of them
collaborate with suppliers to analyze data. And only a third
liaise with suppliers to develop new products, pricing strategies
or promotional campaigns. Nevertheless, the trend toward
cooperation is likely to increase. “Manufacturers are getting
smarter. I believe we’ll be looking to work more closely, to
share more data, to work more collaboratively in both
marketing and merchandising.”
What’s true outside corporate walls is equally true within.
The merchandising, marketing and IT functions in most
retailers collaborate with each other to some extent – and, even
in organizations where cross-functional collaboration is quite
limited, many respondents expect it to grow. But those in
the leading institutions already interact far more fully (see
Figure 3). Indeed, they sometimes cooperate so completely
that their roles and responsibilities merge.
This deep-rooted collaboration is closely linked to a fundamental difference in perceptions of who “owns” the customer.
The Leaders are twice as likely as other retailers to share the
task of managing and nurturing the customer relationship
among several functions.
They’re also better equipped to harness technology in the
merchandising process. More than half of the Leaders employ
key merchandising personnel who are not only knowledgeable
about technology, but can clearly articulate their requirements.
And more than half have merchandising functions that work
closely with the IT function so that it invests in the most
appropriate solutions. “We need the right technical people to
maximize sales and profits,” an Australian merchandising
executive explained.
Functions are highly collaborative
Merchandising
67%
40%
Marketing
69%
39%
IT
48%
35%
Leading merchandisers
All other merchandisers
Figure 3 – Leaders collaborate extensively across functions.
1.7x
1.8x
1.4x
7
Building an electronic bridge to suppliers
A shared electronic platform for handling trade promotions
has brought one big North American grocery retailer
much closer to its suppliers. The retailer has replaced
its paper-based system with a web-based portal for
preparing, submitting and managing deal contracts. The
portal handles more than half a million transactions a year,
saving both the retailer and its suppliers many hours of
labor on activities like entering data, tracking contracts
and checking invoices.
It’s also eliminated vast piles of paper and saved money,
by reducing printing, postage and storage costs, improving
the accuracy of the billing process and reducing postaudit recovery fees. But the retailer reports that, by far, the
biggest benefits are a better relationship with its suppliers
and a more customer-centric promotion planning process.
Crunching the numbers to get
clearer insights
Lastly, the Leaders use analytics much more extensively than
other retailers – and they start by collecting a wider variety of
customer data. Of course, most retailers capture transaction
and point-of-sale data. Some also run loyalty programs, which
can be a rich vein of information about individual customers’
buying patterns, preferences and lifestyle.
What sets the Leaders apart is the fact that they are more
likely both to collect such data and to integrate it with
intelligence from other sources. For example, 42 percent buy
syndicated data, and 29 percent buy world panel data,
combining information on household purchasing patterns with
data on consumer attitudes, media consumption and the like.
By way of comparison, only 17 percent of other retailers buy
syndicated data and only 13 percent buy world panel data.
The Leaders also use that data to extract meaningful insights
and inform a wide range of merchandising activities (see
Figure 4). Compared to other retailers, they use analytics more
comprehensively across the board, whether that’s to help them
make better marketing, sales and sourcing decisions or to
optimize the efficiency of their supply chains.
8
Understanding leading retailers
“We’ve computerized everything to get data back,” a U.S.
merchandising executive told us. “We rely on industry trends.
We communicate with different vendors in person, and we
keep a close eye on much larger vendor stores.” He’s not
alone. “We do proper market analysis and segment-ation
to plan a customer-focused strategy,” said a U.K.
merchandising executive.
Leaders stand out in one final respect – and it’s core to the
concept of analytics: the emphasis they place on measuring
results. Two-thirds of them think it’s critical to monitor the
effectiveness of their merchandising, which explains why the
Leaders are twice as likely as other retailers to measure the
success of their pricing, promotional and assortment activities.
In other words, analytics is embedded in the normal routine of
the Leaders, whereas other retailers often treat it as a nice-tohave “extra.” And that’s reflected in the resources they’ve put
in place. The merchandising functions in two-thirds of the
Leaders collect enough data to perform advanced analyses, and
more than half can analyze the data themselves. By contrast,
only a third of the merchandising functions in other retailers
have the necessary data or skills.
The Leaders are also more willing to seek outside assistance
when they need it: 33 percent turn to manufacturers and 31
percent to external analytics providers. Yet only a small fraction
of the other merchandisers in our sample look out-of-house for
help. This may seem ironic, given that the Leaders have much
higher levels of in-house expertise, but it’s yet another
indication of their more collaborative ethos.
Currently use analytics for:
Understand/predict
customer buying
behaviors
73%
47%
Inform merchandising
strategies
69%
42%
Inform promotion
or pricing strategies
63%
40%
Product assortment
planning
63%
37%
Understand how
customers interact
with the business
across different
channels
63%
39%
Leading merchandisers
All other merchandisers
Figure 4 – Leaders apply analytics to a wide range of
merchandising activities.
1.6x
1.6x
1.6x
1.7x
1.6x
9
PAC 2000A uses analytics to optimize price
Driving a profitable pricing strategy in the face of stiff
competition is a tough business. That’s the challenge
retailers’ cooperative PAC 2000A recently faced. The
group is a leading retailer throughout central and southern
Italy, operating in an intensely competitive environment,
complicated by regional nuances.
The retailer knew it had to get better at managing their
pricing in this highly competitive environment. The trouble
was, it lacked the systems and processes required to do
this. So it decided to replace its cumbersome homegrown
pricing application.
PAC 2000A’s new system collects daily sales data for
35,000 items from its 450 stores and then combines it
with weekly market analyses. It simulates and analyzes
different pricing scenarios, taking account of fluctuations
in demand and rival retailers’ prices. This enables the
consortium to adjust its own prices accordingly. Using
price optimization, PAC 2000A is able to more intelligently
manage the overall competitive price index for a category,
and optimize pricing and margins within defined rules
and constraints.
PAC 2000A’s objective for its price optimization project
was to gain better financial control and improve overall
company performance. By leveraging price optimization,
comparable stores sales increased by 2.4 percent in 2011
and gross margin improvements were achieved. At the
same time, PAC 2000A has reduced the time it takes to
react to market changes from 18 days to three.4
How to become a leader
To sum up, the Leaders have merchandising functions that
focus on the customer. That doesn’t mean they ignore
traditional considerations such as products and categories, but
they look beyond these concerns to what matters most: the
customers who buy their goods. They also form genuine
partnerships, not just transactional relationships, with their
suppliers. And they use analytics both to guide their decisions
and to measure their progress. So what does it take to become
a Leader?
Focus on your customers
•
•
•
Have you appointed a Chief Customer Officer or Customer
Council to foster your customer capabilities?
Do you have a budget specifically for improving your
customer skill?
Do you use dedicated metrics to measure your performance
against customer-oriented goals?
Collaborate across organizational and
functional boundaries
•
•
•
Do you share data and insights with your suppliers?
Do you work closely with your suppliers to develop new
products and pricing and promotional strategies?
Do you share the task of managing and nurturing the
customer relationship with other functions?
Turn bytes into insights
•
•
•
Do you collect enough data to perform advanced analyses and
use the resulting intelligence to inform your merchandising
decisions?
Do you have the internal expertise to analyze that data?
Do you measure the success of your pricing, promotional and
assortment activities?
10
Understanding leading retailers
About the authors
Derek Franks is a consultant with the IBM Center for Applied
Insights. In this role, his focus is on research that provides
insight into emerging business and technology trends. Prior to
joining the Center, he was part of the IBM Retail Store
Solutions group, where his work centered on how enterprises
can use technology to drive improved business results. He has
been a speaker at global conferences and collaborated with top
companies from around the world. He can be contacted at
[email protected]
Elizabeth Magill is the Product Marketing Team Lead for IBM
DemandTec solutions, where she heads a team responsible for
thought leadership, positioning and sales enablement.
Elizabeth has worked for more than 10 years with leading
software and service companies in the broad customer
experience space, and has domain expertise in digital
marketing, call center, eService and CRM. Before joining
DemandTec, she headed product marketing for Coremetrics,
where she led a team of marketers supporting solutions in
online marketing optimization, including web analytics, search
marketing and product recommendation domains. Elizabeth
can be reached at [email protected] or on Twitter @emagill.
Contributors
Angie Casey
Cynthia Coulbourne
Ellen Cornillon
Scott Duby
Ralph Jacobson
Steve Rogers
Quentin Smelzer
Kevin Thompson
Patricia Waldron
Tony Wood
Mark Yourek
About the IBM Center for Applied Insights
ibm.com/ibmcai
The IBM Center for Applied Insights introduces new ways of
thinking, working and leading. Through evidence-based
research, the Center arms leaders with pragmatic guidance
and the case for change.
About Planet Retail
Planet Retail provides business-critical retail insight to retailers,
suppliers and investors. Our intelligence gives businesses
competitive advantage by informing their strategic decision
making and exposing opportunities for profitable growth. We
provide our clients with extensive breadth of data, superior
analysis and expertise in grocery, food multinationals,
e-commerce, shopper insights, private label, retail technology,
macroeconomics, apparel and private label.
11
Notes:
Notes and sources
1
Google search completed on May 13, 2013.
2 We
compared the average basket size at the Leaders’ stores with that of
lower-performing retailers. We eliminated the impact of variations in
average basket size as a result of operating in different retail segments by
using statistical software to weigh the responses of the two groups so that
their segment profiles matched. This means that differences between the
two groups are not likely to stem from differences in the retail segments
they include.
3 We
compared the stock prices of the publicly traded Leaders with those
of the other publicly traded companies in our sample over periods of one
year, two years and three years. The Leaders consistently outperformed the
other companies.
4 “PAC2000A.” IBM Corporation. October 4, 2012. http://www-01.ibm.
com/software/success/cssdb.nsf/CS/JHUD-8XCRLY?OpenDocument&
Site=default&cty=en_us
© Copyright IBM Corporation 2013
IBM Corporation
New Orchard Road
Armonk, NY 10504
Produced in the United States of America
July 2013
IBM, the IBM logo and ibm.com are trademarks of International Business
Machines Corporation in the United States, other countries or both. If
these and other IBM trademarked terms are marked on their first
occurrence in this information with a trademark symbol (® or TM), these
symbols indicate U.S. registered or common law trademarks owned by IBM
at the time this information was published. Such trademarks may also be
registered or common law trademarks in other countries. Other product,
company or service names may be trademarks or service marks of others.
A current list of IBM trademarks is available on the web at “Copyright and
trademark information” at ibm.com/legal/copytrade.shtml
This document is current as of the initial date of publication and may be
changed by IBM at any time. Not all offerings are available in every country
in which IBM operates.
The performance data and client examples cited are presented for
illustrative purposes only. Actual performance results may vary
depending on specific configurations and operating conditions.
THE INFORMATION IN THIS DOCUMENT IS PROVIDED
“AS IS” WITHOUT ANY WARRANTY, EXPRESS OR
IMPLIED, INCLUDING WITHOUT ANY WARRANTIES
OF MERCHANTABILITY, FITNESS FOR A PARTICULAR
PURPOSE AND ANY WARRANTY OR CONDITION OF
NON-INFRINGEMENT. IBM products are warranted according
to the terms and conditions of the agreements under which they
are provided.
Please Recycle
REE03004-USEN-01
Baixar