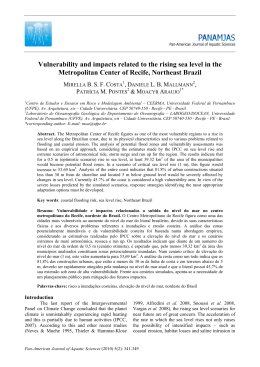
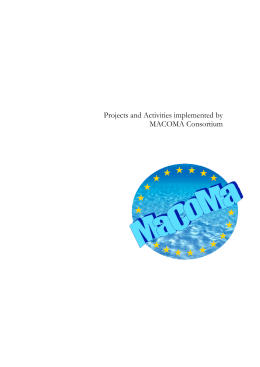
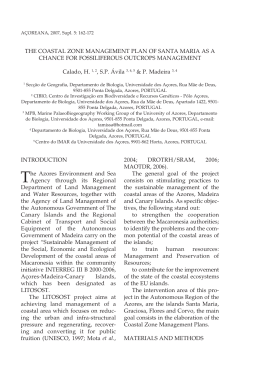
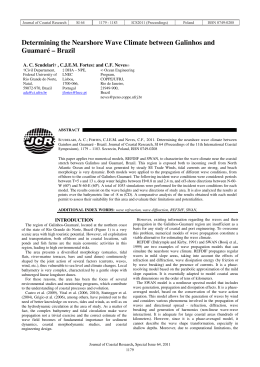
Revista de Gestão Costeira Integrada / Journal of Integrated Coastal Zone Management, 15(1):47-63 (2015)
http://www.aprh.pt/rgci/pdf/rgci-490_Bio.pdf
|
DOI:10.5894/rgci490
Methods for coastal monitoring and erosion risk assessment:
two Portuguese case studies
*
A. Bio @, a; L. Bastos a, b; H. Granja a, c; J.L.S. Pinho d; J.A. Gonçalves a, b;
R. Henriques c, e; S. Madeira a, f; A. Magalhães a, g; D. Rodrigues d
Abstract
Coastal zones are naturally dynamic and mobile systems exposed to natural factors (river flows, waves and storms) as well as
human interventions that continuously reshape their morphology. Erosion phenomena related to extreme weather events and
sediment scarcity are common, threatening buildings and infrastructures, as well as beaches, ecosystems and valuable wetland;
conditions that pose challenges to coastal security and defence. Regular monitoring of coastal areas, assessment of their
morphodynamics and identification of the processes influencing sediment transport are thus increasingly important for a better
understanding of changes and evolutionary trends in coastal systems. This demands a multi-disciplinary approach involving
researchers with expertise in coastal processes and state- of-the-art observation technologies.
In this paper state-of-the-art surveying methods for an efficient quantification of changes in coastal environments are described
and evaluated, and two NW-Portuguese case studies are presented. Survey methods included: topographic surveys based on
terrestrial videogrammetric mobile mapping and aerial photogrammetry; sub-tidal bathymetry with sonar imagery using an
Autonomous Surface Vehicle (ASV); as well as field observations, with sediment sampling and beach characterisation. In the
first case study, erosion/accretion patterns in the Douro estuary sand spit were analysed, considering its breakwater, river flow,
wave and wind effects. Prior to the construction of a detached breakwater, the spit’s morphodynamics was related to extreme
river flow events, wave and wind conditions; afterwards the spit stabilized its shape and increased its area and volume. In the
second case study the coast of Vila Nova de Gaia was broadly analysed, including the shoreface, foreshore and dunes, the
characterization of major features and a short-period analysis of installed dynamics. Results obtained from field data,
topographical surveys and numerical wave models were combined for an erosion risk assessment, using a methodology
specifically developed for the study area.
Both monitoring programs achieved their proposed objectives and provided valuable information to the local authorities, as
gathered and processed information constitutes a valuable database for coastal planning and for ICZM purposes. They
demonstrate the potential of several approaches, supported by advanced technologies, for the study of complex coastal
morphodynamic processes.
Keywords: monitoring techniques; Digital Elevation Models; morphodynamics; coastal erosion; risk assessment; Douro
Estuary; Vila Nova de Gaia; Portugal.
@
Corresponding author: <[email protected]>
Universidade do Porto, CIMAR/CIIMAR – Centro Interdisciplinar de Investigação Marinha e Ambiental, Rua dos Bragas, 289, 4050-123
Porto, Portugal
b
Universidade do Porto, Faculdade de Ciências, Departamento de Geociências, Ambiente e Ordenamento do Território, Rua Campo Alegre
687, 4169 - 007 Porto, Portugal
a
c
University of Minho, Department of Earth Sciences, Campus de Gualtar, 4710-057 Braga, Portugal
d
University of Minho, Department of Civil Engineering, Campus de Gualtar, 4710-057 Braga, Portugal
e
Universidade do Porto, Centro de Geologia, Rua Campo Alegre 687, 4169 - 007 Porto, Portugal
f
Universidade de Trás-os-Montes e Alto Douro, Department of Mathematics, Apartado 1013, 5001-801 Vila Real, Portugal
g
Universidade do Porto, Faculdade de Ciências, Observatório Astronómico, Monte da Virgem, 4430−146 Vila Nova de Gaia, Portugal
* Submission: 14 JAN 2014; Peer review: 6 FEB 2014; Revised: 26 MAR 2014; Accepted: 3 APR 2014; Available on-line: 11 APR 2014
Bio et al. (2015)
Resumo
Métodos de monitorização e análise de risco de erosão costeira: dois casos de estudo portugueses
Zonas costeiras são sistemas naturalmente dinâmicos e móveis, expostos a fatores naturais (fluxos de rios, ondas e
tempestades) e intervenções humanas, que alteram continuamente a sua morfologia. Fenómenos de erosão relacionados com
temporais e escassez de sedimentos são comuns. Eles ameaçam construções e infraestruturas, praias, ecossistemas e zonas
húmidas, o que constitui um desafio para a segurança e defesa costeiras. Uma monitorização regular de áreas costeiras, com
avaliação da sua morfodinâmica e identificação dos processos que influenciam o transporte de sedimentos, visando uma
melhor compreensão das alterações e tendências evolutivas nos sistemas costeiros, torna-se portanto cada vez mais
importante. Para tal necessita-se de uma abordagem multidisciplinar e investigadores especializados em processos costeiros e
tecnologias de observação de ponta.
O presente trabalho descreve e avalia métodos de monitorização de última geração para uma quantificação eficiente de
alterações em ambientes costeiros e apresenta dois estudos de caso Portugueses. Os métodos de observação incluem:
levantamentos topográficos terrestres em modo cinemático baseados em videogrametria; levantamentos topográficos aéreos
baseados em fotogrametria; batimetria sub-tidal e imagens de fundo obtidas com sonar a partir de um veículo autónomo de
superfície; e observações de campo com análise de sedimentos e caracterização de praias. O primeiro caso de estudo referese à análise de padrões de erosão e acreção na restinga do estuário do Douro, tendo em conta efeitos causados pelo molhe, o
caudal do rio, ondas e vento. Antes da construção de um molhe destacado, a morfodinâmica da restinga estava relacionada
com eventos extremos de caudal, agitação marítima e vento. Após a construção, a forma da restinga estabilizou e observou-se
um aumento da sua área e do seu volume. No segundo caso de estudo, a costa de Vila Nova de Gaia foi amplamente estudada,
incluindo shoreface, foreshore e dunas, com a caracterização dos principais atributos e uma análise de curto-período da
dinâmica instalada. Os resultados obtidos a partir de dados de campo, dos levantamentos topográficos e de modelos
numéricos de ondas foram combinados numa análise de risco com métodos especificamente desenvolvidos para a área de
estudo.
Ambos os programas de monitorização atingiram os seus objetivos e geraram informação relevante para as autoridades
locais. A informação recolhida e processada constitui uma base de dados valiosa para o planeamento costeiro e a Gestão
Integrada de Zonas Costeiras. Os estudos demonstram o potencial das diversas abordagens, apoiadas por tecnologias
avançadas, para o estudo dos processos complexos de morfodinâmica costeira.
Palavras chave: técnicas de monitorização; Modelos Digitais de Elevação; morfodinâmica; erosão costeira; análise de risco;
estuário do Douro; Vila Nova de Gaia; Portugal.
1. Introduction
Coastal erosion is complex and depends on the off and
on-shore environment, including wave energy and
direction, weather and climate, the materials that make
up the coast and the supply or extraction of sediments,
as well as the influence of manmade structures
(Archetti & Zanuttigh, 2010; Granja & Pinho, 2012).
Monitoring should consider these interactions and be as
comprehensive as possible, including the submerged
part of the shore to obtain important information on
slope, bathymetry and the bottom features and materials
(Holland et al., 2009).
For a responsible and sustainable coastal management,
it is necessary to understand the coastal system, its
physical processes (e.g., sediment transport patterns,
sediment sources and sinks), forcing factors (e.g., wave
action, storm surges, currents) and their interrelations
and effects. Coastal morphology and its dynamics have
to be followed and quantified along time, and erosion
risks have to be evaluated considering present and
potential future (e.g., climate change) scenarios
(Nicholls et al., 2007; Dodet et al., 2010; Pereira &
Coelho, 2013).
Several methods have been proposed for coastal
morphodynamic monitoring. Coasts can be analysed in
terms of shoreline dynamics only (Boak & Turner,
2005) or in terms of beach morphology changes.
Being land-ocean interfaces, and river-ocean interfaces
at estuaries, coasts constitute transitional zones of high
ecological, as well as economical importance. Exposed
to different phenomena that continuously reshape their
morphology, coasts are naturally dynamic and mobile
systems. They constantly adapt in response to natural
forcing factors (currents, waves, winds and storms), but
also to human interventions, like sand mining, and
construction of edifications and defence structures.
Many coasts suffer from erosion processes, causing
coastal retreat that threatens beaches, wetlands, marshes
and coastal ecosystems, as well as buildings and infrastructures, hence stressing local economies. For
instance, almost all coastal EU Member States have
problems with coastal erosion, with more than 20% of
the evaluated European coastline affected (Niesing,
2005). In an effort to mitigate erosion, soft (e.g. beach
nourishment) and hard defences (e.g., groins or breakwaters) are built against sea impacts. Hard defence
structures are however static and interfere with natural
coastal dynamics and the accommodation space for
adaptation, and their medium to long-term effects are
frequently unexpected as there is often not enough
quantified knowledge about the local coastal dynamics
and the forcing factors and processes driving it.
48
Revista de Gestão Costeira Integrada / Journal of Integrated Coastal Zone Management, 15(1):47-63 (2015)
Surveys using conventional techniques, such as classic
surveying equipments (Holland et al., 2009; Cowart et
al., 2010; Souza & Luna, 2010; Muehe, 2011), are both
costly and labour-intensive, and generally lack the
spatial and temporal resolution needed to identify and
quantify short-term changes as well as long-term trends
(Short & Trembanis, 2004). Alternatives using fixed
video imagery (Davidson et al., 2007; Archetti &
Zanuttigh, 2010) provide lower-cost continuous data,
i.e. an optimal temporal resolution, but are generally
limited to few beach stretches. Remotely sensed data
have also been successfully used for coastal monitoring.
Satellite radar, particularly Synthetic Aperture Radar
(SAR), have been used to extract shoreline information
(Niedermeier et al., 2000) and aerial digital photography to obtain 3D information through photogrammetric
analysis (Fletcher et al., 2003; Cowart et al., 2010).
Laser surveys may deliver similar (or slightly better,
10-15 cm) accuracy in the vertical component and may
constitute an alternative to aerial digital photography
and photogrammetry; but they are still extremely
expensive. The generalisation of GPS (Global Positioning System) methods, particularly those using RTKGPS (Real-Time Kinematic GPS), has facilitated analysis of spatial variability allowing precise threedimensional survey data to be collected both rapidly
and at high spatial resolution (Rocha et al., 2009;
Barnard & Warrick, 2010). A novel approach to
topographic surveys is videogrammetric mobile mapping, where 3D coordinates are extracted from stereo
video images (Madeira, 2007; Zhu & Brilakis, 2009;
Brilakis et al., 2011).
The main objectives of this paper are: (1) to present an
overview of state-of-the-art coastal survey techniques,
including novel methods for coastal topography definition, such as terrestrial videogrammetric mobile mapping and aerial digital photogrammetry, and (2) to show
their potential in morphodynamic monitoring and
erosion risk assessment and, hence, integrated coastal
management. Two case studies are used to illustrate the
applicability of the methods. The first refers to the
Douro Estuary sand spit, where the effects of a detached breakwater on spit morphodynamics were
analysed based on more than a decade of regular
surveys and considering river flow, wave and wind
patterns. The second refers to a comprehensive
monitoring program developed to assess erosion risk for
the coast of Vila Nova de Gaia.
comprehensive evaluation of morphodynamic trends
and erosion risks in the coastal system. Analyses were
based on results from the simultaneous and integrated
use of terrestrial mobile mapping surveys, as well as
airborne digital photography surveys, bathymetric
surveys, in-situ field observations, beach profiling and
sediment sampling.
2.1. Terrestrial mobile mapping surveys
Traditional land surveying methods are time consuming, and therefore also expensive. A much more
efficient alternative is the use of a Mobile Mapping
System (MMS), using a direct georeferencing system
and video cameras, which is easily and quickly put into
operation under almost any weather conditions. The
observing methodologies applied in our case studies,
evolved with time. In the sand spit study, surveys
started with an on-foot GPS equipment (used until
2002), followed by a two antenna system installed on a
moto-quad (from 2003 to 2009) (Baptista et al., 2008)
and, more recently (since 2009), by a videogrammetric
(Fig. 1), which can be used with different direct georeferencing systems, developed at the University of Porto
(Madeira, 2007; Madeira et al., 2010). In the second
case study, only the two-antenna system was applied.
Automated spatial data collection using terrestrial
videogrammetric MMS in coastal zones is still at an
early stage of development (Zhu & Brilakis, 2009;
Brilakis et al., 2011). Software developed at the
University of Porto (UP), Portugal, was applied to
automatically extract 3D coordinates (Madeira et al.,
2010). A process was developed that relies on an
automatic selection and coordination of ground points
in each pair of photogrammetric images obtained by the
system’s video cameras. The DEM was computed
creating a TIN (triangulated irregular network) and
converting it to a regular grid (with 1 m spacing) by
linear interpolation.
2. Coastal monitoring methods
With an adequate direct georeferencing system, data
acquired with the MMS implemented at UP allow 3D
topographic mapping with accuracies similar to those of
RTK-GPS based methods (Dail et al., 2000). The
method to obtain the DEM from the image-derived
coordinates does not depend on the relative changes
between the GPS antenna and the ground but only on
the calibration of the cameras (which can be done very
precisely, at the sub-pixel level; Madeira et al. 2009)
and the determination of the relative position of the
GPS antenna and the video cameras.
In this section, the several survey techniques used in the
case studies are presented. The first case study,
concerning the evolution of the Douro spit, used Digital
Elevation Models (DTM) derived from terrestrial
mobile mapping surveys. The second consisted of a
multi-disciplinary monitoring approach, aiming at a
The relative position of the cameras and the GPS/INS
direct georeferencing system can also be accurately
established before mounting the system, and will
remain constant for each installation. DTM height
accuracies, tested with control points, were at the fewcentimetre level (RMS = 0.06 m).
49
Bio et al. (2015)
Figure 1 - Terrestrial mobile mapping survey. A: Four-wheel vehicle with two kinematic antennas and
videogrammetric equipment; B: Screenshot of the software used to extract topographic coordinates and
terrain features.
Figura 1 - Levantamento terrestre em modo cinemático. A: Carro equipado com duas antenas cinemáticas e
equipamento de videogrametria; B: Imagem de ecrã do programa usado para extrair as coordenadas
topográficas e atributos de terreno.
A further advantage is the simultaneous (video)
recording of ground features, such as dune vegetation or
storm scars, with a resolution of a few centimetres,
superior to that achieved by traditional aerial photography. These records can be of upmost relevance for
ecological and geomorphological interpretation of the
environment, and can be compiled in GIS databases for
further analysis.
Measurements with the MMS were collected continuously, in kinematic mode, using GPS post-processing
relative positioning. Positioning and orientation of the
cameras was initially done using a GPS-only dual
frequency multi-antenna setting to derive roll and later
a GPS/INS georeferencing system based on a dual
frequency GNSS receiver and a navigation-grade IMU
(Inertial Measurement Unit), which allows determina50
Revista de Gestão Costeira Integrada / Journal of Integrated Coastal Zone Management, 15(1):47-63 (2015)
tion of the vehicle orientation in all three angular directions (roll, pitch and heading). Here, we present results
obtained using the latter setting.
obtain the centre of camera projection and the
attitudinal angles for each image. A boresight alignment
was done with ground control points in order to correct
slight systematic effects in the attitude angles of about
0.02 degrees (Gonçalves et al., 2011). Calibration was
done in built up areas, which contain features that can
be used as accurate ground control points.
DEMs were computed from the pairs of stereoscopic
aerial images after extracting correlated points through
stereomatching, using the BLUH software (Jacobsen,
2000; Rieke-Zapp & Nearing, 2005). Notice that stereomatching is difficult with images of sandy, low-contrast
beaches due to light over-exposure. Whenever possible,
surveys were therefore conducted under low-sun conditions, when some shadow patterns appear in the sand,
which facilitate image correlation. The digital photographs were furthermore orthorectified and combined
2.2. Airborne photogrammetry
Aerial photos were taken using a digital camera (ZI
Imaging DMC) installed in an airplane flying at about
1030 m height (Fig. 2). This resulted in high-resolution
images with 10 cm ground sampling distance (GSD).
Two strips of images were collected, with a longitudinal
overlap of 60% and a lateral overlap of 30%. Images
were collected during spring low tides to maximize the
observable emerged area.
Images were directly georeferenced by a GPS/INS
system. The GPS post-processing relative positioning
mode was used, and the information was processed to
Figure 2 - Airborne photography survey. A: Survey airplane; B: digital ZI-DMC camera (sensor with 7680×13824
pixels); C: Flight plan with two rows of overlapping photos (here: ~100 photos covering ~14 km).
Figura 2 - Levantamento por fotografia aérea. A: Avião utilizado; B: câmara digital ZI DMC (sensor com
7680×13824 pixéis); C: plano de voo com as duas fiadas de fotografias sobrepostas (neste caso: ~100 fotos
que cobrem ~14 km).
51
Bio et al. (2015)
into mosaics with 0.1 m resolution, for visual analysis
of ground occupation and patterns. DTM height accuracies, tested with control points, were at the few
decimetre level (RMS = 0.18 m).
side-scan were also analysed to identify rocky outcrops
and sandy patches.
The accuracy of the bathymetric surveys was not
evaluated by the authors. In controlled environments
(harbours), the catamaran showed accuracies at the few
centimetre level. At the coast and under ideal
conditions, depth could be measured with an accuracy
of about 15 cm. However, due to the variability of
observation conditions in the ocean, in practise, all
existing remote techniques (including echo- sounder,
laser, etc.) usually deliver a worse final accuracy, with
precisions not better than 20 to 30 cm. Notice that the
catamaran-based system is not introducing additional
errors or limitations, when compared to traditional
bathymetric hydrographical surveys, and has advantages concerning the depth of the zone that it can survey.
Compared to manned surveys, autonomous computer
controlled robotic surveys allow higher precision in
course control. They are furthermore cheaper and safer
to operate under rough conditions.
2.3. Bathymetric surveys
An Autonomous Surface Vehicle (ASV), a remotely
computer controlled, 4.2 m long catamaran (Fig. 3),
was used for bathymetric surveys (Ferreira et al., 2009).
Vehicle navigation and positioning was done with a
PolaRx RTK GPS, with a horizontal accuracy of 2 cm
and a vertical accuracy of 4 cm. The platform was
furthermore equipped with a Tritech digital single beam
side-scan altimeter sonar; a 500 KHz echo-sounder with
6o conical beam width and 1 cm of range resolution,
measuring bathymetry and capturing acoustic images of
the ocean bottom. The ASV was electrically propelled
and the sonar sensor heads mounted at the aft of the
boat without interference from the hull motion and
propeller induced noise.
The system allowed for continuous recording of all
data, including navigation data and the observation
time. The derived horizontal coordinates were referred
to the ETRS89 datum and depths referred to CD (Chart
Datum). Bathymetry data were used for the
implementation of a wave propagation model.
Reflectance and shadows of the sonar images from the
2.4. Field observations and sedimentary analyses
For erosion risk assessment coasts need to be observed
and characterized, giving particular attention to geo and
bio- indicators of coastal short term change and to the
segments most sensitive to erosion. In our case study,
location, type and state of the beach-dune system pro-
Figure 3 - Bathymetric and seabed survey. A: Autonomous catamaran, platform with GPS RTK and altimeter; B: Side-scan
sonar.
Figura 3 - Levantamento batimétrico e do fundo. A: Catamarã autónomo, plataforma com GPS RTK e altímetro; B: sonar de
varrimento lateral.
52
Revista de Gestão Costeira Integrada / Journal of Integrated Coastal Zone Management, 15(1):47-63 (2015)
file, grain size of sediments, regularity of the dune
ridge, dune vegetation, as well as micro-forms like
blowouts, cliffs, washovers, ridge and runnels, and
cusps were recorded.
Sediment size data were obtained through sieving and
processed using the SEDMAC software (Henriques,
2004) to obtain commonly used size parameters for
particle populations. Data obtained included relative
and cumulative frequencies in 1⁄2 Ø (phi) intervals.
Mean, standard deviation, skewness and kurtosis were
determined, using the method of moments. The distribution of size fractions according to the modified
Wentworth scale was also determined. Sample distribution by dimensional 1⁄2 Ø class was done in correspondence to the metric scale. Sediment size and statistics were processed and integrated in a GIS, using the
sediment samples’ spatial reference.
the spit tip in order to: stabilize the estuary margins,
especially those of the sand spit and the estuary outlet;
improve navigability and navigation safety under any
tide condition; reduce propagation of storm waves into
the estuary; preserve environmental values (most of the
sandy spit and the adjacent São Paio Bay constitute a
Nature Reserve); and reduce the dredging needed to
maintain the navigation channel.
South of the river mouth lies the 15 km long coastal
stretch of Vila Nova de Gaia (Fig. 4C). Many parts of
that coast have shown progressive erosion in recent
3. Case Studies
3.1. Study area
The case studies refer to the Douro river barrier sand
spit and the coast line south of it (Fig. 4). The Douro
River has a funnel-shaped estuary that lies embedded in
a steep valley, extending 21.6 km from the CrestumaLever dam, which sets an artificial limit to the estuary,
to the river mouth (Portela, 2002). The river has a
torrential regime, regulated by 15 dams (seven in the
Spanish and eight in the Portuguese territory). Water
flows to the estuary depend on water levels and on
hydropower generation needs. Periods of null-discharge
flows are frequent, mostly during summer, as well as
floods (with river flood discharges reaching more than
13 000 m3 s-1) in winter or spring, when the dams’
limited water storage capacity is not enough to prevent
them.
The estuary inlet is protected by a sand spit (Fig. 4C).
This spit is rooted on the left bank of the Douro river
estuary and points north due to the S-N drift caused by
wave diffraction around the ebb-tidal delta and some
outcrops, and the breakwater to the North of the outlet.
The spit is presently about 300 m wide (east-west) and
700 m long (north-south). Its Eastern flank is stabilized
by plants like Elymus farctus and Ammophilla arenaria
and connects with the São Paio Bay, a mostly
submerged (1−2 m below CD), hydrodynamically calm
wetland of ecological importance. Composed of fine to
medium-coarse sand, the spit is influenced by subaerialfluvio-marine conditions, including; sedimentary
transport by the river, swell and tide effects, as well as
by winds (Silva et al., 2005; Consulmar, 1996).
There are numerous records of flood events that caused
rupture of the spit and of periods when accretion took
place at the spit tip, causing its progression towards the
North and even obstruction of the navigation channel.
Between 2004 and 2008 the Northern breakwater was
extended and a new detached breakwater was built at
Figure 4 - Case study areas. A: Portugal (box) in SW-Europe;
B: Location of Porto and Vila Nova de Gaia on the NWAtlantic Portuguese coast; C: GoogleEarth image of the
two study areas (boxes), the Douro spit in the North and
the coast of Vila Nova de Gaia municipality to the South
of it.
Figura 4 - Áreas de estudo. A: Portugal (retângulo)no SO da
Europa; B:Localização do Porto e de Vila Nova de Gaia
na costa NO-Atlântica de Portugal; C: imagem
GoogleEarth das duas áreas de estudo (retângulos), a
restinga do Douro no norte e a costa do município de
Vila Nova de Gaia a sul.
53
Bio et al. (2015)
decades (Granja & Carvalho, 2000; Soares de Carvalho
et al., 2006), with coastal retreat reaching, in some
cases, six meters per year, challenging coastal security
and protection. Several causes for erosion have been
pointed out: increasing lack of sediment supply from
rivers (due to dam construction since the 50’s, dredging
and extraction of aggregates); sediment starvation in the
inner continental shelf; influence of coastal defence
structures; and an increase in storm surge frequency and
intensity (though this is controversial).
At these latitudes (40º–42ºN), the North-Western
Portuguese coast is highly energetic (Cruz, 2008), with
offshore mean significant wave heights of 2–3 m, and
mean wave periods of 8–12 s. In winter, storms
generated in the North Atlantic are frequent and can
persist for up to five days, with significant wave heights
reaching 8 m (Costa et al., 2001). The tides are semidiurnal, with heights ranging from 2 m to 4 m during
neap and spring tides, respectively. Waves are usually
coming from the W-NW, causing a dominant drift
current from North to South (S-N drift is occasionally
observed during W-SW storm periods). This current is
in some areas inverted due to the presence of obstacles
that promote wave diffraction, as happens at the Douro
spit. At Vila Nova de Gaia, the main drift direction is
N-S, causing accretion northwards of obstacles
(drainage pipes, breakwaters) and erosion to the South
(Granja et al., 2011).
position, shape and volume, and assess its evolution.
These data were later analysed with the objective to
identify relationships between sand spit dynamics and
river flow regimes, ocean wave and wind patterns, and
to evaluate the impact of the breakwaters on spit
morphology and on its vulnerability to river flow, wave
and wind conditions.
Using GPS in relative kinematic mode (see Section
2.1), quarterly terrestrial mobile mapping measurements
were taken along the instanta-neous water limit (i.e., of
the sand spit edge) and on a grid of profiles, allowing
determination of the spit’s contour and topography, and
subsequent production of DEM representing its 3D
surface (Fig. 5). DEM were used to analyse spit
evolution in time, distinguishing between the periods
before and after breakwater construction.
Changes in sand spit shape, area, topography and
volume were related to extreme river flows discharges,
ocean wave and wind conditions, considering: (i)
maximum daily mean river flow discharges; (ii) the
number of days with discharge flows higher than
800 m3 s-1; (iii) maximum wave power events (with
wave power in kW m-1 estimated by ≈ 0.5 kW m3 s-1 ×
wave height2 × period); (iv) number of 3-hour periods
with wave power values above 200 kW m-1; (v)
maximum wind power (which was estimated as the
cube of the maximum wind speed; Rasmussen et al.,
2011); and (vi) the number of half-hour periods with
wind power values above 10 000 (m s-1)3.
Daily average discharge records at the Crestuma-Lever
dam (supplied by INAG – Portuguese Water Authority,
under permission of the EDP – Portuguese Electrical
Company) were taken to represent total freshwater flow
3.2. Douro estuary sand spit study
3.2.1. Monitoring and data analysis
In June 2001 a monitoring program was set up to
monitor the Douro Estuary sand spit, measuring its
Figure 5 - Sand spit survey. A: Distribution of samples collected during in June 2009 (each dot is an observation) and
delimitation of the four spit sectors analysed (coordinates are in Datum 73, Hayford-Gauss, IPCC); B: resulting DTM.
Figura 5 - Levantamento da restinga. A: Distribuição das amostras recolhidas em Junho de 2009 (cada ponto é uma
observação) e a divisão nos quatro sectores analisados (com coordenadas em Datum 73, Hayford-Gauss, IPCC); B: MDT
resultante.
54
Revista de Gestão Costeira Integrada / Journal of Integrated Coastal Zone Management, 15(1):47-63 (2015)
into the estuary. Wave data were obtained at 3-hour
intervals, from a datawell directional wave buoy located
about 32 km NW of the sand spit (41o19’N, 8o59’W),
at 83 m water depth (supplied by IH – Portuguese Hydrographical Institute). Wind velocities were obtained
from NCEP FNL Operational Model Global Tropospheric Analyses (National Center for Atmospheric
Research, http://rda.ucar.edu/datasets/ds083.2/), at 41º N
and 9º W, considering the level of 1000 mbar.
during breakwater construction, stabilizing from 2008
onwards for the eastern spit tip and displaying an
increasing trend for the western sectors (Fig. 7).
Analyses revealed that the observed erosion and
accretion patterns were related to extreme river flow,
wave and wind conditions, with effects depending on
spit section and height, and therefore exposure, and
with distinctly different patterns for the periods before
and after breakwater construction. Before breakwater
construction, extreme river flow was significantly (p <
0.05) correlated with spit erosion. The number of days
with extreme wave power was correlated with an
increase in area and in the volume observed at lower
heights (up to 4 m CD) of the NW sector. High wind
power was related to losses in volume and to erosion in
the SW sector, and to accretion in the NE. After
breakwater construction river flow, wave and wind
effects became overall less significant (see Bastos et al.,
2012 for more detail). The breakwater seems hence to
protect most of the spit against rough conditions,
leading to a relative stabilization of the spit’s shape and
topography. The T-shape established after breakwater
construction (due to the creation of a tombolo towards
the detached breakwater and an inland arm), with little
extension to the North, does not obstruct the navigation
channel, and favours the navigability between the sea
and the small estuarine harbours. There is, however,
increasing silting up of the wetland area SE of the spit,
due to changes in circulation patterns caused by the new
spit shape, threatening the local Nature Reserve. In
recent years, the São Paio Bay, has progressively filled
up with sediment and is losing its wetland characteristics (pers. observation).
To distinguish dynamics of different areas of the sand
spit, the spit was divided into four sectors (Fig. 5): the
seaward spit base (SW sector), the seaward tip (NW),
the river facing spit base (SE) connected to the São Paio
Bay wetland, and the river facing spit tip section (NE).
For each sector and survey, sand spit area and volumes
above different heights were determined. Changes between surveys were analysed, discriminating between
the period before (Dec. 2001 to Jan. 2005) and after
breakwater construction (June 2007, when most of the
sand-spit breakwater structure was in place, to April
2010).
Correlations between these parameters and sand spit
area and volume dynamics were assessed using
Spearman correlation tests, as most pairs of data failed
the Shapiro-Wilk normality test. All statistical analyses
were carried out using R software (R Dev. Core Team,
2009).
3.2.2. Results and discussion
Considering sand spit shape and volume obtained from
seasonal surveys between 2001 and 2009 (Bastos et al.,
2012), three periods could be distinguished. The first,
between 2001 and the end of 2003, was very dynamic,
with marked changes of the sand spit tip shape and
thickening and thinning of its body (Fig. 6; see Bastos
et al., 2012 for more detail). The spit stayed stable
during the second period, 2004 to early 2005, which
coincided with a severe drought in continental Portugal
with relatively low river flows. Decreasing volumes in
the seaward sections and slightly increasing volumes in
the NE spit tip sector were observed (Fig. 7). The third
period was related to the construction of the breakwater
attached to the sand spit, which started in March 2005.
Furthermore, the strengthening of the spit bears risks
for the riparian communities. In recent years, the spit
has further stabilized and increased its area and volume
(Fig. 6). In the period after the breakwater was built, the
spit’s area increased ~56 000 m2 (i.e. ~23%) and its
volume ~340 000 m3 (~33%). Its W-face has moved
30−45 m westward, while the lower E-face remained
stable. Prior to the sand spit breakwater construction,
the sand spit used to rupture under severe floods,
allowing discharge of the river flow through a wider
cross section. A strengthened spit constitutes a more
stable barrier and may cause floods with higher water
levels within the estuary for a given flood discharge.
During breakwater construction the spit tip developed
an inland arm (along an older breakwater, which runs in
E-W direction along the top of this arm), with a branch
(Fig. 6). This inland arm was eroded by the time of the
December 2006 survey, after a flood that occurred in
the previous November, and was breached before the
April 2010 survey after extreme river flows in the
previous winter. Sand spit areas and volumes oscillated
The monitoring of the Douro barrier sand spit is an
ongoing project, integrated in a larger monitoring
framework promoted by the APDL, which includes
morphodynamical surveys in the Douro estuary, as well
as monitoring of navigation conditions, damages and
protections of harbours and other manmade structures.
55
Bio et al. (2015)
A
Dec. 02
Dec. 03
Jan. 05
B
Dec. 05
Dec. 06
C
Dec. 07
Dec. 08
Dec. 09
Jan. 11
Fev. 12
Mar. 13
Figure 6 - DTM obtained from surveys carried out before (A), during (B) and after (C) the construction of the breakwater (a
selection of yearly winter surveys is presented; more data can be found in Bastos et al., 2012).
Figura 6 - MDT obtidos em levantamentos antes (A), durante (B) e após (C) a construção do molhe (apresenta-se uma seleção
de levantamentos anuais de inverno; dados adicionais encontram-se em Bastos et al., 2012).
56
Revista de Gestão Costeira Integrada / Journal of Integrated Coastal Zone Management, 15(1):47-63 (2015)
Figure. 7 - Variation in sand spit volume and area for the four sand spit sectors considered. The stacked area plots show
volumes for different height layers and the line represents the total area of each sector.
Figura 7 - Variação do volume e da área da restinga para os quatro sectores considerados. As áreas empilhadas representam
os volumes para camadas de diferentes altitudes e a linha a área total de cada sector.
3.3. Vila Nova de Gaia erosion risk study
limitations. The team therefore decided in favour of
distributing the obtainable profiles over the whole area
(N.B. there are hardly any bathymetric data available
for that shoreface area).
Sediment samples were collected along transects perpendicular to the coastline. Whenever possible, samples
were taken on the dune crest, at the dune base and at the
3.3.1. Monitoring and risk analysis
In 2007, a multi-disciplinary monitoring program was
set up to follow and quantify short-term changes of the
densely occupied and locally erosion-prone Vila Nova
de Gaia coast. The objective was to evaluate morphodynamic trends of the coastal system, including the
shoreface, the foreshore and the dunes. Four campaigns
took place, after fair weather conditions in the autumns
of 2008 and 2009, and just after storm winter conditions
in the springs of 2009 and 2010. An innovative set of
monitoring methodologies was applied, including:
mobile mapping surveys, airborne digital photography
surveys for photogrammetric topography, bathymetric
surveys and in-situ field observations, beach profiling
and sediment sampling (see Section 2).
Bathymetric surveys were done along (E-W) profiles,
more or less perpendicular to the coastline and up to 8
m CD depth (i.e., 10 m MSL), during high tide, to allow
driving the ASV as close as possible to the foreshore.
Depending on the bottom slope, the profile lengths
varied from 300 m to 2000 m. Profiles were collected at
1 km intervals. A denser observation scheme would be
recommended but was not feasible due to budget
high, mean and low tide water levels. Sediment samples
were processed and analysed to determine grain size
fractions (as described in Section 2.4).
Collected data were integrated in a Geographical
Information System (GIS) for further spatial analysis,
using the PT-TM06/ETRS89 (EPSG: 3763) coordinate
system. To assess morphodynamics during the observation period, a different DEM was obtained for each
campaign from terrestrial mobile mapping and from
airborne photogrammetric surveys (Fig. 8). Contours,
partial and total volumes and sediment budgets were
determined for different topographic height classes, and
for each of the coastal segments.
Survey results were used in combination with wave
climate data (from the same close-by offshore directional wave buoy as in the previous study), and a local
57
Bio et al. (2015)
wave propagation model was implemented to assess
local wave energy spatial distributions and produce
erosion risk maps. Field data and model outputs were
integrated, processed and analyzed to assess the coastal
vulnerability to erosion and for the elaboration of
associated risk maps using a multi-criteria assessment
approach. A specific erosion risk assessment methodology was developed for this work, at the University of
Minho, based on morphological, hydrodynamic and
other indicators that were quantified using the data and
results obtained from the monitoring program. Vulnerability and exposure indicators were aggregated in order
to classify the coast according to three erosion risk
classes – low, intermediate and high risk.
The applied methodology was based on previous works
(Thieler & Hammar-Klose, 1999; Thieler, 2000; Thieler
& Pendleton et al., 2005; Rajawat et al., 2006; Hegde &
Reju, 2007; Loureiro, 2006; Kumar et al., 2010), but
specifically adapted to the local characteristics of the
coastal stretch under study. Comparing our methodology with the above cited, there are three main distinguishing aspects: (i) the segmentation for the quantifycation of indexes (susceptibility, exposure and risk) is
also based on specific coastal types, obtained by a judicious delimitation based on the beach-dunes-urban front
main characteristics, as well as human occupation and
administrative boundaries; (ii) a new set of susceptibility variables is proposed, and others used in previous
works (eg. tidal range; offshore significant wave height;
mean sea level rise) are neglected since they showed
almost uniform values along the whole studied coastal
stretch, not adding information to the risk assessment;
and (iii) the adopted exposure variables resulted from a
detailed quantification of the existing building and
beach areas extracted from the aerial digital photos.
In a first phase a base line was defined, delimiting areas
that were strongly occupied from those that have some
capability to adapt to the effects of natural forcing
factors (mainly winds and waves). The area was divided
into 47 elementary segments considering the coastal
typology, administrative boundaries and human occupation. For each segment a set of susceptibility indicators was quantified: coastal segment average elevation;
width and slope; volume rate computed according to
two DEMs obtained in different times; a wave-energy
related indicator computed using wave propagation
model results; and the percentage of vegetated area. The
area of existing buildings in a predefined buffer and the
area occupied by sandy beaches in each segment were
considered as exposure indicators. The erosion risk index was finally computed based on two partial indexes:
the vulnerability index and the exposure index (Fig. 9).
Computation of each vulnerability and exposure indicators within each segment was supported by GIS tools
using the relevant field data and DEM. Moreover,
Figure 8 - DTM of the Vila Nova de Gaia coast for
November 2008, obtained through photogrammetry, and
the division of the coast into 18 segments.
Figura 8 - MDT da costa de Vila Nova de Gaia para
Novembro de 2008, obtido por fotogrametria, e a divisão
da costa em 18 segmentos.
58
Revista de Gestão Costeira Integrada / Journal of Integrated Coastal Zone Management, 15(1):47-63 (2015)
Susceptibility indicators
Exposure indicators
Erosion risk
Erosion
risk index
high
intermediate
low
Figure. 9 - Vulnerability and impact indicators used for erosion risk analysis; a part of the coast by Gulpilhares is shown.
Figura 9 - Indicadores de vulnerabilidade e impacto utilizados na análise de risco de erosão; mostra-se uma parte da costa
junto a Gulpilhares.
models were applied to analyse local wave propagation
dynamics and estimate the susceptibility of the coast to
a predefined wave event. This way, the model allows
estimation of the wave energy near the coast (within a
predefined buffer) resulting from the propagation of an
offshore wave event.
Model simulation results were used to discriminate
coastal segments in terms of susceptibility to wave
action. Wave propagation was modelled at specific
locations to identify local patterns useful for the understanding of the observed sedimentary dynamics (Granja
& Pinho, in press). The numerical model used is based
on a Boussinesq equations formulation (Nawogu & Demirbilek, 2001) and is able to simulate most hydrodynamic phenomena that are of interest for coastal zones,
such as: silting-up; refraction; diffraction; com-plete
and partial reflection/transmission; bottom friction;
non-linear wave-wave interactions; wave breaking;
wave-induced currents; and wave-current interaction.
The model was integrated in a hydroinformatic environment appropriate for coastal processes modelling
(Pinho, 2001). The bathymetry used in the model
construction was derived from the combination of a
coarse bathymetric database (from Instituto Hidrográfico, 2010) available for this coastal zone and the
higher-resolution bathymetric data obtained with the
ASV. Model results were processed in order to estimate
the wave energy reaching each segment for a constant
energy source at the offshore model boundary. This
new approach allows assessing which coastal segments
are most exposed to wave actions, mainly due to
shoaling, diffraction and refraction phenomena.
3.3.2. Results and discussion
The Vila Nova de Gaia monitoring program allowed,
for the first time, both a quantitative analysis of
morphological changes and an erosion risk assessment
for the whole coastal stretch of this municipality, which
is characterized by small pocket beaches between rocky
outcrops, generating tombolos and creating specific
local and still poorly understood dynamics. This coastal
area presents very diverse segments, with morphodynamic behaviour influenced by local hydrodynamics,
sometimes conditioned by recent man-made structures
(Granja & Pinho, in press; Granja et al., 2011). Most
segments have been suffering erosion, some show
accretion, partially supported by artificial sand nourishment, e.g. at Granja Beach, where this sand however
is rapidly lost. The observed erosion trends constitute a
serious problem for this densely populated and build-up
area, where the natural migration of the coastal system
is severely restricted. Besides susceptibility to erosion,
local ecological and economical values have to be
considered and also evaluated.
59
Bio et al. (2014)
Considering the 18 administrative divisions of the
studied coastal stretch (Fig. 8), evolutionary trends,
based on the analysis of orthophoto-maps from 2005
(i.e. previous to the monitoring program) to 2009,
showed erosion trends in segments 2, 3, 4 (northern
part), 5, 9, 13, 15, 16, 17 and 18, and accretion trends in
segments 4 (south), 11 (north) and 14. During this
monitoring program (2008/2010), in November 2008,
recent erosion phenomena were observed for the
segments 2 to 9, whereas segments 10 to 13 and the
northern part of segment 14 were temporarily stable.
The used complementary observation methods allowed:
(i) identification of particular morphodynamic processes (using field observations),
(ii) characterization of the nature of beach sediments
(georeferenced sediment samples),
(iii) acquisition of high resolution beach mor-phology
(MMS),
(iv) extension of the DEM to vege-tated and other
sensitive areas (using the non-invasive aerial
photogrammetric method), and
(v) characteriza-tion of the nearshore bottom (sub-tidal
bathymetric surveys).
Through this holistic approach a set of relevant data
was obtained, concerning the fundamental morphodynamic processes that occur in the studied coastal
segments, resulting from wave and wind action as well
as human interventions (coastal defence structures and
dune fences), allowing erosion risk classification of the
coastal segments according to the aggregated score of
their vulnerability and exposure indexes (Fig. 10).
Erosion risk is higher for southern areas, with northern
areas presenting a mixed behaviour.
Two segments showed erosion due to man-made
structures: segment 5, where a reinforced sewage pipe
acts as a groin, affecting sediment circulation by the
north-south drift and causing erosion south of the pipe;
and segment 15 and part of sector 14, which have lost
sediments due to the breakwater at Aguda Beach. The
Aguda Beach breakwater had originally been planned
as a detached breakwater to protect a small fishing
harbour. But after some months, still during the works
of the breakwater construction, a tombolo wedge beach
formed against the temporary groin, promoting
enlargement of the beach located up-drift and erosion at
the down-drift coastal segment (Granja Beach). The
temporary groin was not removed (Rosa-Santos et al.,
2009) and the space between the breakwater and the
harbour filled up, rendering the harbour useless (RosaSantos et al., 2009; Granja et al., 2011).
Between November 2008 and November 2009,
segments 3, 5, 10 and 12 showed negative sedimentary
budgets, and segments 5, 14 (south) and 15 (affected by
the above mentioned structures) suffered marked
erosion. Artificial beach nourishment with sand had
positive, though very short-lived, effects on the Granja
beach. Sedimentary budgets became more favourable
by May 2010, with accretions observed particularly in
the upper, dry and vegetated part of the beaches
(affected by wind conditions), whereas the wet part of
the beach (affected by waves and currents) showed
erosion in the most vulnerable sectors.
Sedimentary analyses showed the presence of quite
coarse sands, which are overall homogeneous in size
class distribution, both alongshore and cross-shore,
possibly related to artificial beach nourishment, with
sediments coming from waste landfill sites. In later
surveys, coarser sediments were hidden by finer ones,
reflecting less ocean wave impact and fresh sediment
supply. Sub-tidal surveys showed that beaches with low
slope – both above and below the water line – were
preferential accretion sites. Interpretation of the sonar
data revealed accretion areas on the inner continental
shelf (nearshore) and relationships between the
morphodynamical behaviours of the nearshore and the
contiguous foreshore.
Figure 10 - Erosion risk map for the Vila Nova de Gaia coast.
Figura 10 - Mapa de risco de erosão para a costa de Vila
Nova de Gaia.
60
Revista de Gestão Costeira Integrada / Journal of Integrated Coastal Zone Management, 15(1):715-731 (2015)
4. Conclusion
blue and near-infrared image bands. The innovative
(terrestrial) videogrammetric approach used in the presented case studies also provides a visual record of the
area, where ground features such as dune vegetation are
recorded. These records can be kept in GIS databases
and be further analysed. Sub-tidal bathymetric and
sonar surveys constitute an underwater extension of the
surveyed area, which is important because the sediment
types, structure and slope of the submerged area have a
direct impact on the degree of erosion and stability of
the contiguous foreshore, mainly due to cross-shore
transport.
Coastal monitoring programs should be set up based on
the specific objectives and on the characteristics of the
area to be monitored. Selection of monitoring methods
will obviously depend on type and accessibility of the
area, on its size, and on the expected rates of change
(fast changes may require more frequent, i.e. easier to
deploy, monitoring). Availability of equipment and
know-how will also influence the choice of methods. A
cost-benefit analysis should help deciding whether it is,
for instance, worth using the more expensive but faster
and non-invasive aerial methods, or the more limited
but more precise and cheaper terrestrial survey
methods.
The presented case studies demonstrate the potential of
several approaches, supported by advanced technologies, for the study of complex coastal morphodynamic
processes. Both monitoring programs achieved their
proposed objectives and provided valuable information
to the local authorities, as gathered and processed
information constitutes a valuable database for coastal
planning and for ICZM purposes. The monitoring
program for the Vila Nova de Gaia coast is particularly
innovative as it combines several observation techniques in a systematic way, in sequential campaigns,
providing information for a detailed analysis with a
high spatial resolution. This combination allows a
detailed and continuous observation in a coastal buffer
delimited by the urban front and the outer shoreface.
The relatively short length of the coastal stretch implies
that other erosion risk assessment methodologies based
on relatively rough data (e.g., wave climate variables,
tidal characteristics, medium to long term coastline
dynamics; Thieler, 2000; Kumar et al., 2010), would
fail to distinguish between different segments.
Topographic surveys should have a better than decimetre precision to be useful. Traditional point or crossshore profile surveys (with total station technique) have
high precision but are very time and labour-intensive.
The proposed terrestrial MMS methodology provides
very precise 3D surveys (our precision of 5 cm is
comparable to that of Harley et al., 2007) and is easier
to apply, weather resistant and low cost. Deployment of
the equipment is easy and fast, so that sudden changes,
e.g. after severe storms, can easily be assessed (which is
not the case when using traditional techniques). The
main limitation of this method is the production of
discrete spatial information, which is not very sensitive
to small forms when compared with continuous data.
Topography based on aerial stereo high-resolution
digital photography and photogrammetry is less precise
but can provide spatially continuous data, important for
an effective morphological assessment. Laser surveys
constitute an alternative, but although they are more
precise, they are currently extremely expensive. In
comparison to terrestrial systems, aerial surveys are
more expensive and the equipment is not as easily
deployed. But they have other advantages: they are
better suited for regional monitoring, as vast areas (tens
of kilometres) can easily be observed in a few minutes;
and, they are non-invasive. This is particularly important when monitoring ecologically sensitive areas, like
vegetated dunes, or estuarine marshes. Ground vehicles
have to access the site to operate. Aerial photography
also captures fragmented terrains and observes the
whole beach, including the intertidal region and features in the water, e.g. rocky outcrops.
Acknowledgments
We thank: the Administração dos Portos do Douro e Leixões
(APDL) for the financial support of the data acquisition for
Douro Estuary sand spit study; INAG and EDP for the supply
of river data; the Parque Biológico de Gaia, SA. for the
financial funding of the Vila Nova de Gaia coast monitoring
between 2008 e 2010; and Paulo Baptista for his help in the
collection and processing of the GPS data. This research was
partially supported by the European Regional Development
Fund (ERDF) through the COMPETE – Operational
Competitiveness Programme and national funds through FCT
– Foundation for Science and Technology, under the project
“Pest-C/ MAR/LA0015/2013”, and partially funded by the
Project ECORISK (reference NORTE-07-0124-FEDER000054), co-financed by the North Portugal Regional
Operational Programme (ON.2 – O Novo Norte), under the
National Strategic Reference Framework (NSRF), through
the European Regional Development Fund (ERDF). Wave
climate analyses were supported by the FCT-funded RAP
project (PTDC/MAR/111223/2009).
Furthermore, the high-resolution images constitute a
visual record of the study area, where vegetation,
buildings and infrastructure can be located and quantified (through image analysis). Classification of, for
instance, vegetation can be done taking advantage of
the additional (though lower- resolution) red, green,
61
Bio et al. (2014)
References
Gonçalves, J.; Bastos, L.; Pinho, J.; Granja, H. (2011) – Digital
aerial photography to monitor changes in coastal areas based
on direct georeferencing. 5th EARSeL Workshop on Remote
Sensing of the Coastal Zone, Prague, Czech Republic.
Archetti, R.; Zanuttigh, B. (2010) – Integrated monitoring of the
hydro-morphodynamics of a beach protected by low crested
detached breakwaters. Coastal Engineering, 57(10):879–891.
DOI: 10.1016/j.coastaleng.2010.05.002
Baptista, P.; Bastos, L.; Bernardes, C.; Dias, J. (2008) – Monitoring
sandy shores morphologies by DGPS – a practical tool to
generate digital elevation models. Journal of Coastal Research,
24(6):1516−1528. DOI: 10.2112/07-0861.1
http://www.conferences.earsel.org/abstract/show/2689
Granja, H.; Bastos, L.; Pinho, J.; Gonçalves, J.; Henriques, R.; Bio,
A.; Magalhães, A. (2011) – Small harbours risks: lowering for
fishery and increasing erosion. The case of Portinho da Aguda
(NW Portugal). Littoral 2010, 09003, DOI: 10.1051/litt/
201109003
Barnard, P.L.; Warrick, J.A. (2010) – Dramatic beach and nearshore
morphological changes due to extreme flooding at a wavedominated river mouth. Marine Geology, 271(1-2):131–148.
DOI: 10.1016/j.margeo.2010.01.018
Bastos, L; Bio, A; Silva, J.; Pinho, J.L.S.; Granja, H. (2012) –
Dynamics of the Douro estuary sand spit before and after
breakwater construction. Estuarine, Coastal and Shelf Science,
109:53−69. DOI: 10.1016/j.ecss.2012.05.017
Granja, H.M.; Carvalho, G.S. (2000) – Inland beach migration
(“beach erosion”) and the coastal zone management (the
experience of the northwest coastal zone of Portugal).
Periodicum Biologorum, 102(suppl. 1):413–424.
Granja, H.; Pinho, J. L. (2012) – Coastal defense in NW Portugal:
the improbable victory. In: Cooper, J.; Pilkey, H. (eds.), The
Pitfalls of Shoreline Stabilization, pp. 251−266, Coastal
Research Library, vol 3, Springer, USA. ISBN: 9789400741232. DOI: 10.1007/978-94-007-4123-2_15
Boak, E.H.; Turner, I.L. (2005) – Shoreline definition and detection:
A review. Journal of Coastal Research, 21(4):688−703. DOI:
10.2112/03-0071.1
Brilakis, I.; Fathi, H.; Rashidi, A. (2011) – Progressive 3D
reconstruction of infrastructure with videogrammetry.
Automation
in
Construction,
20(7):884−895.
DOI:
10.1016/j.autcon.2011.03.005
Consulmar (1996) – Estudos das obras necessárias à melhoria da
acessibilidade e das condições de segurança na barra do
Douro. Consulmar Report, Administração dos Portos do Douro
e Leixões (in Portuguese), Lisboa, Portugal. Unpublished.
Costa, M.; Silva, R.; Vitorino, J. (2001) – Contribuição para o
Estudo do Clima de Agitação Marítima na Costa Portuguesa.
Actas das 2as Jornadas Portuguesas de Engenharia Costeira e
Portuária. Associação Internacional de Navegação, Sines,
Portugal
(in
Portuguese).
Available
on-line
at
Granja H.; Pinho J. L. (in press) – A multi-criteria approach for
erosion risk assessment using a new concept of spatial unit
analysis, wave model and high resolution DEMs. In: Charles, J.;
Finkl, W., Makowski, C. (eds.), Advances in Coastal and
Marine Resources: Remote Sensing and Modeling. Coastal
Research Library, Springer, USA. ISBN: 978-3319063256.
Harley, M.D.; Turner, I.L.; Short, A.D.; Ranasinghe, R. (2007) –
Monitoring beach processes using conventional, RTK-GPS and
image-derived survey methods: Narrabeen Beach, Australia. In:
Woodroffe, C.D.; Bruce, E.M.; Puotinen, M.; Furness, R.A.
(eds.), GIS for the Coastal Zone: A Selection of Papers from
CoastGIS 2006, pp. 151–164. University of Wollongong,
Australia. ISBN 9781741281378
Hegde, A.V.; Reju, V.R. (2007) – Development of coastal
vulnerability index for Mangalore coast, India. Journal of
Coastal Research, 23(5):1106–1111. DOI: 10.2112/04-0259.1
ftp://ftp.mohid.com/Fortaleza_CD/Bibliografia/Waves/clima_agmar.pdf
Cowart, L.; Walsh, J.P.; Corbett, D.R. (2010) – Analyzing Estuarine
Shoreline Change: A Case Study of Cedar Island, North
Carolina. Journal of Coastal Research, 26(5):817–830. DOI:
10.2112/JCOASTRES-D-09-00117.1
Cruz, J. (2008) – Ocean Wave Energy. Current Status and Future
Perspectives. Green Energy and Technology. 431p., Springer,
Berlin. ISBN 978-3-540-74895-3
Dail, H.J.; Merrifield, M.A.; Bevis, M. (2000) – Steep beach
morphology changes due to energetic wave forcing. Marine
Geology, 162(2-4):443–458. DOI: 10.1016/S0025-3227(99)
00072-9
Davidson, M.; Van Koningsveld, M.; de Kruif, A.; Rawson, J.;
Holman, R.; Lamberti, A.; Medina, R.; Kroon, A.; Aarninkhof,
S. (2007) – The CoastView project: Developing video-derived
Coastal State Indicators in support of coastal zone management.
Coastal Engineering, 54(6-7):463–475. DOI: 10.1016/
j.coastaleng.2007.01.007
Dodet, G.; Bertin, X.; Taborda, R. (2010) – Wave climate variability
in the North-East Atlantic Ocean over the last six decades.
Ocean Modelling, 31(3-4):120–131. DOI: 10.1016/j.ocemod.
2009.10.010
Ferreira, H.; Almeida, C.; Martins, A.; Almeida, J.; Dias, N.; Dias,
A.; Silva, E. (2009) – Autonomous bathymetry for risk
assessment with ROAZ robotic surface vehicle. OCEANS 2009
IEEE Bremen, 1−6. Available on-line at http://wrem2012.isr.
Henriques, R. (2004) – SEDMAC/SEDPC: An application to
support particle size analysis of unconsolidated sediments. 32nd
International Geological Congress, Florence-Italy, abs. 154-6,
p. 726.
Holland, K.T.; Vinzon, S.B.; Calliari, L.J. (2009) – A field study of
coastal dynamics on a muddy coast offshore of Cassinobeach,
Brazil. Continental Shelf Research, 29(3):503–514. DOI:
10.1016/j.csr.2008.09.023
Jacobsen, K. (2000) – User Manual Program System BLUH, 444p.,
Institute for Photogrammetry and Engineering Surveys,
University of Hannover. Available via http://www.ipi.unihannover.de/kj.html?&L=1
Kumar, T.S.; Mahendra, R.S.; Nayak, S.; Radhakrishnan, K.; Sahu,
K.C. (2010) – Coastal Vulnerability Assessment for Orissa
State, East Coast of India. Journal of Coastal Research,
26(3):523−534. DOI: 10.2112/09-1186.1
Loureiro, E. (2006) – Indicadores geomorfológicos e sedimentológicos na avaliação da tendência evolutiva da zona costeira:
aplicação ao concelho de Esposende. 329 p., PhD Thesis,
Universidade do Minho (in Portuguese). Available on-line at
http://hdl.handle.net/1822/7096
Madeira, S. (2007) – Sistema Móvel Terrestre de Levantamento com
Integração em SIG. PhD Thesis, Porto University (in
Portuguese). Unpublished
uc.pt/Papers/Ferreira_WREM2012.pdf
Madeira, S.; Gonçalves, J.; Bastos, L. (2009) – Fast Camera
Calibration for Low Cost Mobile Mapping. Proceedings of the
6th International Symposium on Mobile Mapping Technology
(MMT09), 21−24 July 2009, Presidente Prudente, São Paulo,
Brazil. Available on-line at http://docs.fct.unesp.br/departamentos/
Fletcher, C.; Rooney, J.; Barbee, M.; Lim, S.C.; Richmond, B.
(2003) – Mapping shoreline change using digital orthophotogrammetry on Maui, Hawaii. Journal of Coastal Research,
SI38:106−124. Available on-line at ftp://ftp.soest.hawaii.edu
cartografia/eventos/2009_MMT/_papers/303_Madeira_MMT09.pdf
/coastal/webftp/JCR_MappingShoreline.pdf
62
Revista de Gestão Costeira Integrada / Journal of Integrated Coastal Zone Management, 15(1):715-731 (2015)
Madeira, S.; Gonçalves, J.A.; Bastos, L. (2010) – Photogrammetric
mapping and measuring application using MATLAB.
Computers
and
Geosciences,
36(6):699−706.
DOI:
10.1016/j.cageo.2009.06.015
Rajawat, A.S.; Bhattacharya, S.; Jain, S.; Gupta, M.; Jayaprasad, P.;
Tamilarasan, V.; Ajai; Nayak, S. (2006) – Coastal Vulnerability
Mapping for the Indian Coast. Second International Symposium
on Geoinformation for Disaster Management.
Muehe, D. (2011) Erosão Costeira - Tendência ou Eventos
Extremos? O Litoral entre Rio de Janeiro e Cabo Frio,
Brasil/Coastal Erosion. Revista da Gestão Costeira Integrada,
11(3):315−325. DOI: 10.5894/rgci282
Rasmussen, D.J.; Holloway, T.; Nemet, G.F. (2011) – Opportunities
and challenges in assessing climate change impacts on wind
energy – a critical comparison of wind speed projections in
California. Environmental Research Letters, 6, 9pp. DOI:
10.1088/1748-9326/6/2/024008.
Nawogu, G.; Demirbilek, Z. (2001) – BOUSS-2D: A Boussinesq
Wave Model for Coastal Regions and Harbors. Report 1.
Theoretical Background and User’s Manual. US Army Corps of
Engineers. Engineer Research and Development Center. USA.
Rieke-Zapp, D.H.; Nearing M.A. (2005) – Digital Close Range
Photogrammetry for Measurement of Soil Erosion. The
Photogrammetric Record, 20(109):69−87. DOI: 10.1111/j.14779730.2005.00305.x
Available on-line at http://www.dtic.mil/cgi-bin/Get TRDoc?AD=
ADA400294.
Rocha, C. P.; Araújo, T.C.M.; Mendonça, F.J.B. (2009) – Aplicação
de metodologia alternativa para localizar e monitorar linhas de
costa usando técnicas de posicionamento pelo GNSS: Um
estudo de caso na praia de Sauaçui, Nordeste do Brasil. Revista
da Gestão Costeira Integrada, 9(1):93-108. DOI: 10.5894/
rgci151
Nicholls, R.; Wong, P.; Burkett, V.; Codignotto, J.; Hay, J.;
McLean, R.; Woodroffe, S.R.C. (2007) – Coastal systems and
low-lying areas. In: Parry, M.; Canziani, O.; Palutikof, J.;
Linden, P.V.D.; Hanson, C. (eds.) Climate Change 2007:
Impacts, Adaptation and Vulnerability. Contribution of Working
Group II to the Fourth Assessment Report of the
Intergovernmental Panel on Climate Change. pp. 315-357,
Cambridge University Press, Cambridge, U.K. ISBN 978 0521
88010-7, Available on-line at https://www.ipcc.ch/publications
Rosa-Santos P., Veloso-Gomes F., Taveira-Pinto F., Silva R.,
Pais-Barbosa J., 2009. Evolution of Coastal Works in
Portugal and their Interference with Local Morphodynamics,
Journal of Coastal Research, Special Issue 56:757-761.
_and_data/publications_ipcc_fourth_assessment_report_wg2_report_im
pacts_adaptation_and_vulnerability.htm
Available
on-line
at
http://www.cerf-jcr.org/images/stories
/757.761_P.Rosa-Santos_ICS2009.pdf
Niedermeier, A.; Romaneessen, E.; Lehner, S. (2000) – Detection of
coastlines in SAR images using wavelet methods. IEEE Trans.
Geoscience and Remote Sensing, 38(5):2270−2281. DOI:
10.1109/36.868884
Short, A.D.; Trembanis, A.C. (2004) – Decadal scale patterns in
beach oscillation and rotation Narrabeen Beach, Australia —
time series, PCA and wavelet analysis. Journal of Coastal
Research
20(2):523−532.
DOI:
10.2112/15515036(2004)020[0523:DSPIBO]2.0.CO;2
Niesing, H. (2005) – EUROSION: Coastal erosion measures,
knowledge and results acquired through 60 studies. In: Herrier,
J.-L.; Mees, J.; Salman, A.; Seys, J.; Van Nieuwenhuyse, H.;
Dobbelaere, I. (eds.), Proceedings ‘Dunes and Estuaries 2005’ –
International Conference on Nature Restoration Practices in
European Coastal Habitats, pp. 421−431, Koksijde, Belgium,
19-23 September 2005, VLIZ Special Publication 19. Available
Silva, A.J.R.; Abecasis, C.; Leitão, J.C. (2005) – Improving the
navigability and safety conditions in Douro estuary inlet. In:
Smith, J.M. (ed.) Coastal Engineering 2004, 19–24 September
2004, vol 3. pp. 3277–3289, World Scientific, Singapore. ISBN:
978-981-256-298-2
Soares de Carvalho, G.; Granja, H.; Costa, A.L. (2006) – Dois casos
de mudanças antrópicas na faixa costeira (praias e dunas) do
noroeste de Portugal (segmentos costeiros de Leça da Palmeiraestuário do Douro e de Aguda-Espinho). Geonovas 20:13–25.
on-line at http://ec.europa.eu/environment/life/project/Projects /index.
cfm?fuseaction=home.showFile&rep=file&fil=LIFE02_NAT_B_00859
1_Seminar.pdf
Pendleton, E.A.; Thieler, E.R.; Williams, S.J. (2005) – Coastal
Vulnerability Assessment of National Park of American Samoa
to Sea-Level Rise. U.S. Geological Survey Open-File Report
2005-1055. Available on-line at http://pubs.usgs.gov/of/2005/1055/
Souza, C.R. de G.; Luna, G. da C. (2010) – Variação da linha de
costa e balanço sedimentar de longo período em praias sob risco
muito alto de erosão do município de Caraguatatuba (Litoral
Norte de São Paulo, Brasil). Revista da Gestão Costeira
Integrada 10(2):179-199. DOI: 10.5894/rgci176
images/pdf/report.pdf
Pereira, C.; Coelho, C. (2013) – Mapas de Risco das Zonas
Costeiras por Efeito da Ação Energética do Mar. Revista da
Gestão Costeira Integrada, 13(1):27-43. DOI: 10.5894/rgci325
Thieler, E.R., 2000. National Assessment of Coastal Vulnerability to
Future Sea-Level Rise. USGS Fact Sheet, fs-076-100. Available
on-line at http://pubs.usgs.gov/fs/fs76-00/fs076-00.pdf
Pinho, J.L.S. (2001) – Mathematical modelling application to
hydrodynamics and water quality studies of coastal zones. PhD
Thesis. University of Minho, Braga, Portugal (in Portuguese).
Unpublished
Thieler, E.R.; Hammar-Klose, E.S. (1999) – National Assessment of
Coastal Vulnerability to Sea-Level Rise: Preliminary results for
the U.S. Atlantic Coast. U.S. Geological Survey Open-File
Report 99–593. Available on-line at http://pubs.usgs.gov/of/
Portela, L.I. (2002) – Plano específico de extracção de inertes do
rio Douro: caracterização morfodinâmica do estuário do rio
Douro. Report 215/02-NEC, 42p., LNEC, Lisbon, Portugal. (in
Portuguese).
1999/of99-593/
Zhu, Z.; Brilakis, I. (2009) – Comparison of optical-sensor-based
spatial data collection techniques for civil infrastructure
modelling. Journal of Computing in Civil Engineering,
23(3):170–177. DOI: 10.1061/(ASCE)0887-3801(2009) 23:3
(170)
R Development Core Team (2009) – R: A language and environment for statistical computing. R Foundation for Statistical
Computing, Vienna, Austria. ISBN 3-900051-07-0. Available online at http://www.R-project.org.
63
Baixar