JOSÉ ERNESTO AMORÓS
NIELS BOSMA
GLOBAL ENTREPRENEURSHIP MONITOR
2013 GLOBAL REPORT
FIFTEEN YEARS OF ASSESSING
ENTREPRENEURSHIP ACROSS THE GLOBE
José Ernesto Amorós,
Universidad del Desarrollo and Global Entrepreneurship Research Association
Niels Bosma,
Utrecht University
Founding and Sponsoring Institutions:
Babson College, Babson Park, MA, United States
Lead Sponsoring Institution and Founding Institution
Universidad del Desarrollo, Santiago, Chile
Sponsoring Institution
Universiti Tun Abdul Razak,BlXcXCldgli# Malaysia
Sponsoring Institution
London Business School, London, United Kingdom
Founding Institution
Although GEM data were used in the preparation of this report, their interpretation and use are the sole
responsibility of the authors.
The authors would like to extend special thanks to Yana Litovsky for her crucial role in the data collection
procedures. Special thanks go to Alicia Coduras-Martínez for her remarkable contribution to the
special topic: “well-being.” To Donna Kelley, Slavica Singer and Jonathan Levie thank you for providing
comments on earlier drafts. Also to Marcia Cole, Carolina Hurtado, Sergio Hinojosa and Antonio Acha
appreciation or their help on the report.
The authors would also like to express their gratitude to all participating GEM 2013 national teams.
The usual disclaimer applies.
© 2014 by José Ernesto Amorós, Niels Bosma and Global Entrepreneurship Research Association (GERA)
ISBN: 978-1-939242-04-4
D\j`^e: Centro de Diseño UDD / Universidad del Desarrollo
. . . . . . . . . . . . . . . . . . . . . . . . . . . . . . . . . . . . . . . . . . . . . . . . . . . . . . . . . . . . . . . . . . . . . . . . . . . . . . . . . . . . . .8
. . . . . . . . . . . . . . . . . . . . . . . . . . . . . . . . . . . . . . . . . . . . . . . . . . . . . . . . . . . . . . . . . . . . . . . . . . . . . . . . . . . . . . . . .9
. . . . . . . . . . . . . . . . . . . . . . . . . . . . . . . . . . . . . . . . . . . . . . . . . . . . . . . . . . . . . . . . . . . . . . . . . . . .10
. . . . . . . . . . . . . . . . . . . . . . . . . . . . . . . . . . . . . . . . . . . . . . . . . . . . . . . . . . 16
1.1 THE GEM RESEARCH INITIATIVE . . . . . . . . . . . . . . . . . . . . . . . . . . . . . . . . . . . . . . . . . . . . . . . . . . . . . . . . . . . . . . . . . . . . . . 17
1.2 GEM METHODOLOGY: KEY ISSUES . . . . . . . . . . . . . . . . . . . . . . . . . . . . . . . . . . . . . . . . . . . . . . . . . . . . . . . . . . . . . . . . . . . . 18
THE PHASES OF ENTREPRENEURSHIP . . . . . . . . . . . . . . . . . . . . . . . . . . . . . . . . . . . . . . . . . . . . . . . . . . . . . . . . . . . . . . . 19
GEM METHODOLOGY . . . . . . . . . . . . . . . . . . . . . . . . . . . . . . . . . . . . . . . . . . . . . . . . . . . . . . . . . . . . . . . . . . . . . . . . . . . . . 20
1.3 THE GEM CONCEPTUAL FRAMEWORK . . . . . . . . . . . . . . . . . . . . . . . . . . . . . . . . . . . . . . . . . . . . . . . . . . . . . . . . . . . . . . . 20
. . . . . . . . . . . . . . . . . . . . . . . . . . . . . . . . . . . . . . . . . . . . . . . . . . . . . . . . . . . . . . . . . . . . . . . . 2)
. . . . . . . . . . . . . . . . . . . . . . . . . . . . . . 24
2.1 INTRODUCTION . . . . . . . . . . . . . . . . . . . . . . . . . . . . . . . . . . . . . . . . . . . . . . . . . . . . . . . . . . . . . . . . . . . . . . . . . . . . . . . . . . . . .24
2.2 ENTREPRENEURIAL ATTITUDES AND PERCEPTIONS . . . . . . . . . . . . . . . . . . . . . . . . . . . . . . . . . . . . . . . . . . . . . . . . . . .24
INDIVIDUALS’ PERCEPTIONS: OPPORTUNITIES, CAPABILITIES AND FEAR OF FAILURE . . . . . . . . . . . . . . . . .28
ENTREPRENEURIAL INTENTIONS. . . . . . . . . . . . . . . . . . . . . . . . . . . . . . . . . . . . . . . . . . . . . . . . . . . . . . . . . . . . . . . . . . . .29
NATIONAL ATTITUDES: CAREER CHOICE, STATUS AND MEDIA ATTENTION . . . . . . . . . . . . . . . . . . . . . . . . . .29
2.3 ENTREPRENEURIAL ACTIVITIES . . . . . . . . . . . . . . . . . . . . . . . . . . . . . . . . . . . . . . . . . . . . . . . . . . . . . . . . . . . . . . . . . . . . . . .29
PHASES OF ENTREPRENEURIAL ACTIVITY . . . . . . . . . . . . . . . . . . . . . . . . . . . . . . . . . . . . . . . . . . . . . . . . . . . . . . . . . . .29
TOTAL EARLY-STAGE ENTREPRENEURIAL ACTIVITY . . . . . . . . . . . . . . . . . . . . . . . . . . . . . . . . . . . . . . . . . . . . . . . . . .32
INDIVIDUAL DRIVERS: MOTIVATIONS TO START BUSINESSES . . . . . . . . . . . . . . . . . . . . . . . . . . . . . . . . . . . . . . . .32
ESTABLISHED BUSINESS OWNERSHIP . . . . . . . . . . . . . . . . . . . . . . . . . . . . . . . . . . . . . . . . . . . . . . . . . . . . . . . . . . . . . . 34
ENTREPRENEURIAL EMPLOYEE ACTIVITY . . . . . . . . . . . . . . . . . . . . . . . . . . . . . . . . . . . . . . . . . . . . . . . . . . . . . . . . . . 34
BUSINESS DISCONTINUATIONS . . . . . . . . . . . . . . . . . . . . . . . . . . . . . . . . . . . . . . . . . . . . . . . . . . . . . . . . . . . . . . . . . . . . 34
DEMOGRAPHICS AND EARLY-STAGE ENTREPRENEURIAL ACTIVITY . . . . . . . . . . . . . . . . . . . . . . . . . . . . . . . . . .35
2.4 ENTREPRENEURIAL ASPIRATIONS . . . . . . . . . . . . . . . . . . . . . . . . . . . . . . . . . . . . . . . . . . . . . . . . . . . . . . . . . . . . . . . . . . . .37
GROWTH ORIENTATION . . . . . . . . . . . . . . . . . . . . . . . . . . . . . . . . . . . . . . . . . . . . . . . . . . . . . . . . . . . . . . . . . . . . . . . . . . .37
INNOVATIVE ORIENTATION . . . . . . . . . . . . . . . . . . . . . . . . . . . . . . . . . . . . . . . . . . . . . . . . . . . . . . . . . . . . . . . . . . . . . . . .38
INTERNATIONAL ORIENTATION . . . . . . . . . . . . . . . . . . . . . . . . . . . . . . . . . . . . . . . . . . . . . . . . . . . . . . . . . . . . . . . . . . . 40
. . . . . . . . . . . . . . . . . . . . . . . . . . . . . . . . . . . . . . . . . . . . . . . . . . . . . . . . . . . . . . . . . . . . . . 42
....................................................
3.1 INTRODUCTION . . . . . . . . . . . . . . . . . . . . . . . . . . . . . . . . . . . . . . . . . . . . . . . . . . . . . . . . . . . . . . . . . . . . . . . . . . . . . . . . . . . .
3.2 THE GEM NATIONAL EXPERTS SURVEY . . . . . . . . . . . . . . . . . . . . . . . . . . . . . . . . . . . . . . . . . . . . . . . . . . . . . . . . . . . . . .
NES METHODOLOGY . . . . . . . . . . . . . . . . . . . . . . . . . . . . . . . . . . . . . . . . . . . . . . . . . . . . . . . . . . . . . . . . . . . . . . . . . . . . .
3.3 THE STATE OF ENTREPRENEURSHIP INSTITUTIONS IN 2013 . . . . . . . . . . . . . . . . . . . . . . . . . . . . . . . . . . . . . . . . . . .
44
44
44
45
46
. . . . . . . . . . . . . . . . . . . . . . . . . . . . . . . . . . . . . . . . . . . . . . . . . . . . . . . . . . . . . . . . . . . . . . 50
. . . . . . . . . . . . . . . . . . . . . . . . . . . . . . . . . . . . . .52
4.1 INTRODUCTION. . . . . . . . . . . . . . . . . . . . . . . . . . . . . . . . . . . . . . . . . . . . . . . . . . . . . . . . . . . . . . . . . . . . . . . . . . . . . . . . . . . . . ,)
4.2 AN OVERVIEW OF GEM INDICATORS AND OUTCOMES . . . . . . . . . . . . . . . . . . . . . . . . . . . . . . . . . . . . . . . . . . . . . . . 53
FROM ‘TEA’ TO ENTREPRENEURIAL PROFILES. . . . . . . . . . . . . . . . . . . . . . . . . . . . . . . . . . . . . . . . . . . . . . . . . . . . . . . . 53
BROADENING THE SCOPE OF ENTREPRENEURSHIP: GEM SPECIAL TOPICS . . . . . . . . . . . . . . . . . . . . . . . . . . . . 55
OUTCOMES IN DIFFERENT WAVES OF GEM RESEARCH . . . . . . . . . . . . . . . . . . . . . . . . . . . . . . . . . . . . . . . . . . . . . . 57
4.3 ENTREPRENEURSHIP AND THE BUSINESS CYCLE: EVIDENCE FROM GEM . . . . . . . . . . . . . . . . . . . . . . . . . . . . . . . 57
4.4 DISCUSSION AND OUTLOOK . . . . . . . . . . . . . . . . . . . . . . . . . . . . . . . . . . . . . . . . . . . . . . . . . . . . . . . . . . . . . . . . . . . . . . . 60
. . . . . . . . . . . . . . . . . . . . . . . . . . . . . . . . . . . . . . . . . . . . . . . . . . . 62
5.1 INTRODUCTION . . . . . . . . . . . . . . . . . . . . . . . . . . . . . . . . . . . . . . . . . . . . . . . . . . . . . . . . . . . . . . . . . . . . . . . . . . . . . . . . . . . . .62
5.2 DEFINITIONS AND OPERATIONALIZATION . . . . . . . . . . . . . . . . . . . . . . . . . . . . . . . . . . . . . . . . . . . . . . . . . . . . . . . . . . .63
SUBJECTIVE WELL-BEING . . . . . . . . . . . . . . . . . . . . . . . . . . . . . . . . . . . . . . . . . . . . . . . . . . . . . . . . . . . . . . . . . . . . . . . . . . . .63
WORK CONDITIONS AND WORK-LIFE BALANCE. . . . . . . . . . . . . . . . . . . . . . . . . . . . . . . . . . . . . . . . . . . . . . . . . . . . . .63
ENTREPRENEURSHIP FRAMEWORK CONDITIONS AND WELL-BEING . . . . . . . . . . . . . . . . . . . . . . . . . . . . . . . . . . .63
5.3 SUBJECTIVE WELL-BEING INDICATORS AND ENTREPRENEURIAL ACTIVITY ACROSS DIFFERENT
GROUPS OF ECONOMIES . . . . . . . . . . . . . . . . . . . . . . . . . . . . . . . . . . . . . . . . . . . . . . . . . . . . . . . . . . . . . . . . . . . . . . . . . . . 64
5.4 WORK SATISFACTION AND WORK-LIFE BALANCE INDICATORS,
AND ENTREPRENEURSHIP ACTIVITY ACROSS DIFFERENT GROUPS OF ECONOMIES . . . . . . . . . . . . . . . . . . . 68
5.5 ENTREPRENEURSHIP FRAMEWORK CONDITIONS AND WELL-BEING . . . . . . . . . . . . . . . . . . . . . . . . . . . . . . . . . . 69
. . . . . . . . . . . . . . . . . . . . . . . . . . . . . . . . . . . . . . . . . . . . . . . . . . . . . . . . . . . . . . . . . . . . . . .72
. . . . . . . . . . . . . . . . . . . . . . . . . . . . . . . . . . . . . . . . . . . . . . . . . . . . . . . . . . . .73
. . . . . . . . . . . . . . . . . . . . . . . . . . . . . . . . . . . . . . . . . . . . . . . . . . . . . . . . . . . . . . . . . . . . . . . . . . . . . . . . . . . . . . . .74
TABLES OF GEM DATA . . . . . . . . . . . . . . . . . . . . . . . . . . . . . . . . . . . . . . . . . . . . . . . . . . . . . . . . . . . . . . . . . . .78
CHARACTERISTICS OF GEM APS SURVEYS . . . . . . . . . . . . . . . . . . . . . . . . . . . . . . . . . . . . . . . . . . . . . . 80
. . . . . . . . . . . . . . . . . . . . . . . . . . . . . . . . . . . . . . . . . . . . . . . . . . . . . . . . . . . . . . . . . . . . . 88
. . . . . . . . . . . . . . . . . . . . . . . . . . . . . . . . . . . . . . . . . . . . . . . . . . . . . . . . . . . . . . . . . . . . . . . . . . . .103
6
FIGURE 1.1 THE ENTREPRENEURSHIP PROCESS AND GEM OPERATIONAL DEFINITIONS . . . . . . . . . . . . . . . . . . . 19
FIGURE 1.2 THE GEM CONCEPTUAL FRAMEWORK . . . . . . . . . . . . . . . . . . . . . . . . . . . . . . . . . . . . . . . . . . . . . . . . . . . . . . 21
FIGURE 2.1 ENTREPRENEURIAL PERCEPTIONS AND ATTITUDES: AVERAGES BY PHASE OF
ECONOMIC DEVELOPMENT. . . . . . . . . . . . . . . . . . . . . . . . . . . . . . . . . . . . . . . . . . . . . . . . . . . . . . . . . . . . . . . . .28
FIGURE 2.2 TOTAL EARLY-STAGE ENTREPRENEURIAL ACTIVITY (TEA) 2013, BY PHASE OF
ECONOMIC DEVELOPMENT . . . . . . . . . . . . . . . . . . . . . . . . . . . . . . . . . . . . . . . . . . . . . . . . . . . . . . . . . . . . . . . .33
FIGURE 2.3 PERCENTAGE OF ENTREPRENEURS MOTIVATED BY NECESSITY AND OPPORTUNITY,
BY PHASE OF ECONOMIC DEVELOPMENT, 2013. . . . . . . . . . . . . . . . . . . . . . . . . . . . . . . . . . . . . . . . . . . . . .33
FIGURE 2.4 ENTREPRENEURIAL EMPLOYEE ACTIVITY (EEA) IN 2013 PARTICIPANT ECONOMIES,
BY PHASE OF ECONOMIC DEVELOPMENT . . . . . . . . . . . . . . . . . . . . . . . . . . . . . . . . . . . . . . . . . . . . . . . . . . .35
FIGURE 2.5 REASONS FOR BUSINESS DISCONTINUANCE BY GEOGRAPHIC REGION . . . . . . . . . . . . . . . . . . . . . . .36
FIGURE 2.6 EARLY-STAGE ENTREPRENEURIAL ACTIVITY RATES WITHIN AGE GROUPS,
BY GEOGRAPHIC REGIONS . . . . . . . . . . . . . . . . . . . . . . . . . . . . . . . . . . . . . . . . . . . . . . . . . . . . . . . . . . . . . . . . . .37
FIGURE 2.7 MALE AND FEMALE EARLY-STAGE ENTREPRENEURIAL ACTIVITY 2013,
BY GEOGRAPHIC REGIONS . . . . . . . . . . . . . . . . . . . . . . . . . . . . . . . . . . . . . . . . . . . . . . . . . . . . . . . . . . . . . . . . . .38
FIGURE 2.8 JOB EXPECTATIONS FOR EARLY-STAGE ENTREPRENEURS, BY GEOGRAPHIC REGIONS . . . . . . . . . .39
FIGURE 2.9 INNOVATIVE ORIENTATION OF EARLY-STAGE ENTREPRENEURS,
BY GEOGRAPHIC REGIONS . . . . . . . . . . . . . . . . . . . . . . . . . . . . . . . . . . . . . . . . . . . . . . . . . . . . . . . . . . . . . . . . . 40
FIGURE 2.10 INTERNATIONAL ORIENTATION OF EARLY-STAGE ENTREPRENEURS,
BY GEOGRAPHIC REGIONS . . . . . . . . . . . . . . . . . . . . . . . . . . . . . . . . . . . . . . . . . . . . . . . . . . . . . . . . . . . . . . . . . . 41
FIGURE 3.1 MODEL OF ENTREPRENEURIAL PROCESSES AFFECTING NATIONAL ECONOMY GROWTH. . . . . 44
FIGURE 3.2 COMPOSITE INDICATORS ON ENTREPRENEURSHIP INSTITUTIONS,
BY STAGE OF DEVELOPMENT (1/2) . . . . . . . . . . . . . . . . . . . . . . . . . . . . . . . . . . . . . . . . . . . . . . . . . . . . . . . . . 48
FIGURE 3.3 COMPOSITE INDICATORS ON ENTREPRENEURSHIP INSTITUTIONS,
BY STAGE OF DEVELOPMENT (2/2). . . . . . . . . . . . . . . . . . . . . . . . . . . . . . . . . . . . . . . . . . . . . . . . . . . . . . . . . 49
FIGURE 4.1 ENTREPRENEURIAL PROFILE: GREECE . . . . . . . . . . . . . . . . . . . . . . . . . . . . . . . . . . . . . . . . . . . . . . . . . . . . . . . 54
FIGURE 4.2 ENTREPRENEURIAL PROFILE: CHILE . . . . . . . . . . . . . . . . . . . . . . . . . . . . . . . . . . . . . . . . . . . . . . . . . . . . . . . . 54
FIGURE 4.3 INDEPENDENT EARLY-STAGE ENTREPRENEURIAL ACTIVITY AND ENTREPRENEURIAL
EMPLOYEE ACTIVITY IN 2011 ACROSS THREE PHASES OF ECONOMIC DEVELOPMENT.. . . . . . . . .55
FIGURE 4.4 GEM INDICATORS AND ECONOMIC INDICATORS FOR THE UNITED STATES, 2001-2013 . . . . . . . .58
FIGURE 4.5 GEM INDICATORS AND ECONOMIC INDICATORS FOR JAPAN, 2001-2013 . . . . . . . . . . . . . . . . . . . . . .58
FIGURE 4.6 GEM INDICATORS AND ECONOMIC INDICATORS FOR ARGENTINA, 2001-2013 . . . . . . . . . . . . . . . .59
FIGURE 4.7 GEM INDICATORS AND ECONOMIC INDICATORS FOR CROATIA, 2001-2013 . . . . . . . . . . . . . . . . . . 60
FIGURE 5.1 SUBJECTIVE WELL-BEING, BY PHASE OF ENTREPRENEURSHIP AND STAGES
OF ECONOMIC DEVELOPMENT . . . . . . . . . . . . . . . . . . . . . . . . . . . . . . . . . . . . . . . . . . . . . . . . . . . . . . . . . . . . . 6+
FIGURE 5.2 SUBJECTIVE WELL-BEING AND ENTREPRENEURSHIP MOTIVATIONS AND GENDER,
STAGES OF ECONOMIC DEVELOPMENT. . . . . . . . . . . . . . . . . . . . . . . . . . . . . . . . . . . . . . . . . . . . . . . . . . . . . 6,
FIGURE 5.3 SATISFACTION WITH BALANCE BETWEEN PERSONAL AND PROFESSIONAL LIFE,
AND ENTREPRENEURSHIP INDICATORS, BY STAGES OF ECONOMIC DEVELOPMENT . . . . . . . . . . 68
FIGURE 5.4 SATISFACTION WITH WORK AND ENTREPRENEURSHIP INDICATORS BY
STAGES OF ECONOMIC DEVELOPMENT . . . . . . . . . . . . . . . . . . . . . . . . . . . . . . . . . . . . . . . . . . . . . . . . . . . . . 69
FIGURE 5.5 SATISFACTION WITH WORK AND LIFE (EXPERTS’ OPINIONS) VERSUS SUBJECTIVE
WELL-BEING INDICATORS OF INDIVIDUALS INVOLVED IN TEA. . . . . . . . . . . . . . . . . . . . . . . . . . . . . . . 70
TABLE 1.1
TABLE 2.1
TABLE 2.2
TABLE 2.3
TABLE 3.1
TABLE 3.2
TABLE 4.1
TABLE 5.1
TABLE A.1
TABLE A.2
TABLE A.3
TABLE A.4
SPECIAL TOPIC REPORTS BASED ON GEM DATA . . . . . . . . . . . . . . . . . . . . . . . . . . . . . . . . . . . . . . . . . . . . . . 18
GEM ECONOMIES BY GEOGRAPHIC REGION AND ECONOMIC DEVELOPMENT LEVEL . . . . . . . . . .25
ENTREPRENEURIAL ATTITUDES AND PERCEPTIONS IN THE GEM ECONOMIES
IN 2013 BY GEOGRAPHIC REGION (% OF POPULATION AGED 18-64) . . . . . . . . . . . . . . . . . . . . . . . . . .26
PHASES OF ENTREPRENEURIAL ACTIVITY IN THE GEM ECONOMIES IN 2013,
BY GEOGRAPHIC REGION . . . . . . . . . . . . . . . . . . . . . . . . . . . . . . . . . . . . . . . . . . . . . . . . . . . . . . . . . . . . . . . . . . 30
GEM’S KEY ENTREPRENEURIAL FRAMEWORK CONDITIONS. . . . . . . . . . . . . . . . . . . . . . . . . . . . . . . . . . 45
ENTREPRENEURSHIP FRAMEWORK CONDITIONS MAIN INDICATORS)'(*. . . . . . . . . . . . . . . . . . . 46
TYPES OF ECONOMIES BASED ON LOW VERSUS HIGH RATES FOR TWO DIMENSIONS OF
AMBITIOUS ENTREPRENEURIAL ACTIVITY (TEA-MH AND EEA-MH) IN 2011;
INNOVATION-DRIVEN ECONOMIES . . . . . . . . . . . . . . . . . . . . . . . . . . . . . . . . . . . . . . . . . . . . . . . . . . . . . . . . . ,SUBJECTIVE WELL-BEING GENERAL RESULTS BY GEOGRAPHIC REGION . . . . . . . . . . . . . . . . . . . . . . 6ENTREPRENEURIAL ATTITUDES AND PERCEPTIONS IN THE GEM ECONOMIES IN 2013
BY ECONOMIC DEVELOPMENT . . . . . . . . . . . . . . . . . . . . . . . . . . . . . . . . . . . . . . . . . . . . . . . . . . . . . . . . . . . . . .78
ENTREPRENEURIAL ACTIVITY IN THE GEM ECONOMIES IN 2013 BY
ECONOMIC DEVELOPMENT . . . . . . . . . . . . . . . . . . . . . . . . . . . . . . . . . . . . . . . . . . . . . . . . . . . . . . . . . . . . . . . . 80
GENDER DISTRIBUTION OF EARLY-STAGE ENTREPREPRENEURS (TEA) AND NECESSITY VS
OPPORTUNITY ENTREPRENEURSHIP BY GEOGRAPHIC REGION, 2013 . . . . . . . . . . . . . . . . . . . . . . . . .82
JOB GROWTH EXPECTATIONS FOR EARLY-STAGE ENTREPRENEURSHIP ACTIVITY BY
GEOGRAPHIC REGION, 2013 . . . . . . . . . . . . . . . . . . . . . . . . . . . . . . . . . . . . . . . . . . . . . . . . . . . . . . . . . . . . . . . . 84
7
8
Babson College is a founding
institution and lead sponsor of the
Global Entrepreneurship Monitor
(GEM). Located in Wellesley,
Massachusetts, USA, Babson is
recognized internationally as a leader in entrepreneurial
management education. U.S. News and World Report has
ranked Babson #1 in entrepreneurship education for 18
years in a row.
Babson grants B.S. degrees through its innovative
undergraduate program, and offers MBA and M.S. degrees
through its F. W. Olin Graduate School of Business.
The School of Executive Education offers executive
development programs to experienced managers
worldwide. Babson’s student body is globally diverse,
hailing from 45 U.S. states and 57 economies (non-U.S.
students comprise more than 20% of undergraduates and
40% of full-time MBA students). Students can choose
from over 100 entrepreneurship courses offered each
year, taught by 17 tenure or tenure-track faculty, all with
entrepreneurship experience, 7 faculty from other divisions
around the college, and highly accomplished business
leaders serving as adjunct faculty.
Entrepreneurial Thought and Action (ETA) is at the
center of the Babson experience, where students are
taught to experiment with their ideas in real-life, learning
and adapting these as they leverage who and what they
know to create valuable opportunities. “Entrepreneurship
of All Kinds” emphasizes that entrepreneurship is
crucial and applicable to organizations of all types and
sizes, whether a new launched independent startup, a
multigenerational family business, a social venture, or an
established organization. Through an emphasis on Social,
Environmental, Economic Responsibility, and Sustainability
(SEERS), students learn that economic and social value
creation are not mutually exclusive, but integral to each
other.
Babson shares its methodology and educational model with
other institutions around the world through Babson Global,
and in the process brings new knowledge and opportunities
back to our campus. Besides GEM, Babson has cofounded and continues to sponsor the Babson College
Entrepreneurship Research Conference (BCERC), the
largest academic research conference focused exclusively
on entrepreneurship and the Successful Transgenerational
Entrepreneurship Project (STEP) a global family business
research project.
For information, visit www.babson.edu.
True to the spirit and
enterprising drive
of its founders, the
Universidad del
Desarrollo is today one of the top three private prestigious
universities in Chile. The project started 23 years ago in
Conception, a southern city of Chile with 100 business
administration students. Two decades later, the facts
speak for themselves. Its rapid growth has become an
expression of the university’s main facet: entrepreneurship.
The UDD MBA program is rated one of the best in Latin
America and also leader in entrepreneurship education,
according to America Economia magazine, an achievement
that once again represents the “entrepreneurial” seal
that is embedded in the spirit of the University. Today the
University has more than 13,000 undergraduates, 2,900
postgraduates and over 9.700 graduates from 26 careers
that cover all areas of human knowledge. UDD also has 17
research centers in many disciplines. On of this research
centers, the Global Entrepreneurship Research Center
of the School of Business and Economics is dedicated to
coordinate the GEM Chile project and is one of the most
important research centers in South America dedicated to
entrepreneurship studies.
For more information visit www.udd.cl
Universiti Tun Abdul Razak
(UNIRAZAK) was established
on 18 December 1997 as one
of the first private universities
in Malaysia. The University
was named after Malaysia’s second Prime Minister, the
late YAB Tun Abdul Razak bin Dato’ Hussein, and was
officially launched on 21 December 1998 by Tun Abdul
Razak’s eldest son, YAB Dato’ Seri Mohd Najib bin
Tun Abdul Razak, current Prime Minister of Malaysia.
UNIRAZAK recognized the imperative for Malaysia’s future
entrepreneurs to equip themselves with the proper tools
and expertise to survive and flourish in today’s modern
competitive economic climate.
Thus UNIRAZAK founded The Bank Rakyat School of
Business and Entrepreneurship (BRSBE) a unique school,
dedicated to providing quality education in entrepreneurial
and business leadership in Malaysia. BRSBE was formed
with the view that entrepreneurial activity is one of the
pillars of a strong and vibrant economy. Although big
business is extremely vital for economic health and
prosperity, a strong cadre of SMIs and SMEs is also
essential to ensure a diverse economy and to provide
the required support to big business companies and the
community. In fact the dramatic economic development in
Asia over the past two decades highlights the importance
of understanding entrepreneurship in the region. In
this regard UNIRAZAK through BRSBE is ideally poised
to play both a national and regional role in developing
entrepreneurship and meeting challenges unique to Asia.
For information visit www.unirazak.edu.my
The 2013 report marks the 15th anniversary of the Global
Entrepreneurship Monitor (GEM). GEM was initially conceived in 1997, and the first report was published in 1999.
There have been many changes since we started. First, the
initial title of GEM was the World Enterprise Index, subsequently renamed the Global Entrepreneurship Monitor. The
first report encompassed 10 countries, all of which were
members of the OECD. GEM is now a truly global entity, as
originally conceived, and the current report covers approximately three quarters of the world’s population and 90% of
the world’s GDP. Each region in the world is now represented, and GEM, which in 2013 encompassed 70 economies,
has since the beginning involved more than 100 countries
in total. The second major change is that GEM, originally
conceived by London Business School and Babson College, restructured itself in 2004 in recognition of its growth
and the key role of national teams – in whose interest the
project is now run.
The challenges that we now face are typical of those that
would characterize a mature and large organization. These
challenges have to do with supporting the national teams in
the most effective way possible, including their training and
fundraising; secondly keeping GEM fresh and innovative
and guarding against the fatigue that might set in in terms
of donors and national teams; thirdly addressing the policy
dimension and, specifically, what governments can do to
improve the entrepreneurial environment within which they
operate.
We like to express our sincere gratitude to all the people
around the world who have been part of this initiative.
Michel Hay
Chairman, Global Entrepreneurship Research Association
GEM Founder
9
With this report, the Global Entrepreneurship
Monitor (GEM) has completed fifteen annual cycles.
GEM generates relevant primary information on
entrepreneurship, providing harmonized measures about
the attitudes, activities and characteristics of individuals
who participate in various phases of entrepreneurship.
GEM also analyzes aspirations that these entrepreneurs
hold for their businesses, along with other key features of
their ventures. In 2013, more than 197,000 individuals have
been surveyed and approximately 3,800 national experts
on entrepreneurship participated in the study across 70
economies, collectively representing all global regions of
the world and a broad range of economic development
levels. The samples in the GEM 2013 study represent an
estimated 75% of the world’s population and 90% of the
world’s total GDP. In addition to its annual measures of
entrepreneurship dynamics, GEM analyzed well-being as a
special topic in 2013.
10
Region
Argentina2, Brazil2, Barbados2, Chile2,
Colombia, Ecuador, Guatemala,
Jamaica, Mexico2, Panama2, Peru,
Suriname, Uruguay2
& Caribbean
Europe – NonEU28
North America
Innovation-driven Economies
Factor- Driven Economies
Latin America
Middle East &
North Africa
Sub-Saharan
Africa
Asia Pacific &
South Asia
Europe – EU28
With an increasing number of economies participating in
the project, GEM groups them into geographic regions:
sub-Saharan Africa, the Middle East and North Africa
(MENA), Latin America and the Caribbean, Asia Pacific/
South Asia, Europe (distinguishing economies that are
part of the European Union from those outside the EU),
and North America. GEM additionally considers the
World Economic Forum’s Global Competitiveness Report
classification into three levels: factor-driven, efficiencydriven, and innovation-driven. By using both groupings,
GEM can compare economies across similar development
levels and geographic locations. The table below shows the
economies involved in the GEM 2013 assessment by these
two dimensions.
Algeria1, Iran1, Libya1
Angola1, Botswana1, Ghana,
Malawi, Nigeria, Uganda, Zambia
India, Philippines1, Vietnam
Trinidad and Tobago
Israel
Namibia, South Africa
China, Indonesia, Malaysia2, Thailand
Japan, I\glYc`Zf]Korea, Singapore,
Taiwan
Croatia2, Estonia2, Hungary2, Latvia2,
Lithuania2, Poland2, Romania, Slovak
Republic2
Belgium, Czech Republic, Finland,
France, Germany, Greece, Ireland
Italy, Luxembourg, Netherlands,
Portugal, Slovenia, Spain, Sweden,
United Kingdom
Norway, Switzerland
Bosnia and Herzegovina, Macedonia,
Russian Federation2, Turkey2
Canada, Puerto Rico*, United States
1) In transition phase between Factor-Driven and Efficiency-Driven
2) In transition phase between Efficiency-Driven and Innovation-Driven
* Puerto Rico is considered to be a part of North America for its status as an associate state to the United States, even though this economy shares
many characteristics of Latin American and Caribbean countries.
The main goal of GEM, particularly in its first years
of existence, was to measure differences in the level
of entrepreneurial activity between economies. This
information could help identify factors determining national
levels of entrepreneurial activity as well as policies aimed
at enhancing entrepreneurial activity. Another key goal
of GEM is to help establish the way entrepreneurship
relates to economic growth and, in a longer term
perspective, economic development. Entrepreneurship is
believed to contribute to economic development because
entrepreneurs create new businesses, and new businesses
create jobs, provide people with a variety of products
and services, intensify competition, increase productivity
through technological change and positively impact
individual lives on multiple levels.
As GEM and other studies have shown, entrepreneurship
rates differ among economies at similar stages of
economic development. It is also true regions sharing
the same level of economic development may not share
the same rates of entrepreneurship. Moreover, not all
entrepreneurial efforts appear to have the same impact
on economic development. The GEM data collection
efforts now allow for comparisons across widely varying
sets of economies and regions and for making distinctions
between several types of entrepreneurship. The GEM adult
population survey database has grown to nearly two million
observations in 104 economies that have participated in
GEM between 1999 and 2013. It has led to a growing body
of academic, peer-reviewed research publications. While
summarizing the research outcomes goes beyond the
scope of this report, a common thread in the findings is that
manifestations of entrepreneurship differ depending on the
context and that as such the impact of entrepreneurship on
growth may also be different.
As the past fifteen years have shown serious ups and downs
in the business cycle, the GEM data may also shed new light
on the impact of economic crises like those experienced in
many parts of the world in recent years. Also here, the GEM
findings point to differences in outcomes across the globe,
differences that can be related to the (institutional) context.
When a crisis looms, some individuals with entrepreneurial
intentions may postpone entrepreneurial activities because
of an expected decline in demand. Others may actually
see new opportunities emerging from a crisis. And, of
course, another group may not be driven by opportunity
at all but pushed into entrepreneurship as a result of the
problems on the job market, especially when social security
entitlements are low. The context can therefore influence
both increases and declines in entrepreneurship rates.
GEM National reports, freely available on the GEM website,
make the connection between relevant context factors and
entrepreneurial attitudes, activity and aspirations.
In fifteen years, GEM has helped build an understanding
of the prevalence, nature and role of entrepreneurship
in an economy and society at large. For some of the
participating economies, GEM provided the very first useful
data on entrepreneurship, crucial for developing evidencebased policy on entrepreneurship. This is an important
achievement and has been made possible through the
development and rigorous administration of an annual
data collection methodology consistently across different
economies and over time, involving several hundreds of
dedicated scholars across the globe.
This year, GEM introduced a novel approach to link
entrepreneurship indicators with measures of well-being.
New items included in the GEM assessment involve
subjective well-being, satisfaction with one’s current work
and work-life balance. The GEM Consortium will publish a
separate report dedicated to this topic during 2014.
Initial results indicate that the prevalence of subjective
well-being varies widely across world regions. Sub-Saharan
African economies exhibit the lowest rates, whereas the
American economies, both Latin and North America,
have the highest rates. The “traditional” welfare states
like Nordic countries and well-developed economies like
Switzerland, Singapore and the Netherlands also exhibit
high rates of subjective well-being. Taken together the
findings suggest that in each economy, and in world regions
with close common heritage, framework conditions such as
economic, political, institutional and cultural contexts have
a singular influence on the population’s perception about its
well-being and consequently shapes the entrepreneurship
indicators.
One interesting finding is that in all regions, entrepreneurs
exhibit relatively higher rates of subjective well-being in
comparison to individuals who are not involved in the
process of starting a business or owning-managing a
business. Even though these results are exploratory, they
show initial evidence that involvement in entrepreneurial
activity can be linked to higher levels of subjective well-being.
Not surprisingly, necessity-driven entrepreneurs
(entrepreneurs that are pushed into starting a business
because they have no other options for work), have
considerably lower rates of subjective well-being compared
to opportunity-driven entrepreneurs. This result was
consistent for all three stages of economic development.
Necessity-driven entrepreneurs in factor-driven economies
have the lowest average of subjective well-being.
Opportunity- and necessity-driven entrepreneurs in
innovation- and efficiency-driven economies exhibit lower
differences on their self-assessment of subjective wellbeing. Interestingly, female entrepreneurs in innovationdriven economies exhibit on average a higher degree of
subjective well-being than males. Another interesting
finding is that, in innovation-driven economies, early-stage
entrepreneurs generally exhibit the highest levels subjective
well-being, but they also tend to report more problems in
work-life balance than those in efficiency-driven economies.
11
ENTREPRENEURIAL ATTITUDES
Individuals in factor-driven economies tend to report
more positive attitudes on entrepreneurial measures
such as perceived opportunities to start a business and
perceived skills to start a business, in comparison to those
in efficiency-driven and innovation-driven economies.
Geographic patterns are also visible: individuals in the SubSaharan African economies often see good opportunities
to start a business in the region: on average 69% of all
respondents. This goes together with a high confidence in
their own skills and knowledge required to start a business
(74% of the respondents) and limited fear of failure when
it comes to starting a business (24%). Sub-Saharan
economies also exhibit many individuals having intentions
to start businesses; this applies to as much as 47% of
the respondents who indicated they were not involved in
entrepreneurship during the survey period. By contrast,
economies in the European Union mostly show lower
perceptions on these measures. The EU primarily hosts
innovation-driven economies where the average perception
of what a business entails is likely to differ from the what
people in factor-driven economies associate with having a
business. This could be one explanation of why attitudes
about starting a business tend to decline with greater
economic development levels.
12
But also with similar levels of economic development,
differences in the prevalence and nature of
entrepreneurship become apparent. In the group of
efficiency-driven economies for example, Latin America
and Caribbean economies reported high rates of perceived
opportunities and capabilities, while economies in Eastern
Europe and Asia Pacific scored low on these measures.
In the group of innovation-driven economies, there is
a distinction the levels of capability perception while
even when the presence of opportunity is consistently
high. The capability perception is high in the Nordic
economies (Finland, Sweden and Norway) and lower in
southern Europe - for example Greece and Spain. Not only
geographic and economic factors impact attitudes toward
entrepreneurship, but cultural and social issues also shape
these perceptions.
When it comes to beliefs about the attractiveness of being
an entrepreneur (starting a business is seen as a good
career choice), different patterns emerge based on two
factors: does society favor entrepreneurs with high status,
and how often and to what degree does the media cover
successful entrepreneurs. For example, the 2013 results
show that people in the Sub-Saharan, Latin American
and Caribbean, and MENA economies often believe that
starting a business is considered a good career choice that
being a successful entrepreneur results in and high status.
Economies in the European Union, however, show lower
percentages, particularly in the when it relates to media
attention paid to entrepreneurs.
ENTREPRENEURIAL ACTIVITY
Total early-stage Entrepreneurial Activity (TEA) includes
individuals in the process of starting a business and those
running new businesses less than 3 ½ years old. As a
percentage of the adult population, these rates tend to be
highest for the factor-driven economies, and decline with
increasing levels of GDP. The main reason for this stylized
fact is that higher levels of GDP yield more and better job
opportunities. At the very highest GDP levels, however,
some economies deviate from this trend with higher TEA
levels.
Among the factor-driven economies, the sub-Saharan
African economies have the highest TEA rates, especially
Zambia and Nigeria with 39% of the adult population
(18-64 years old) involved in early-stage entrepreneurial
activity. In the efficiency-driven group, the highest TEA
rates were found in the Latin American and Caribbean
economies, while lower levels were reported in MENA and
Europe. Trinidad and Tobago and the United States showed
the highest TEA rates among the innovation economies.
Italy and Japan have the lowest TEA rates in 2013, 3.4%
and 3.7% respectively.
While the factor-driven economies have the highest TEA
rates, the early-stage entrepreneurs in these economies
also have the highest proportion of necessity-driven
motives. Economies in the innovation-driven stage of
economic development again witnessed the lowest
necessity-driven TEA rates and the highest proportion
of opportunity-driven motives. In these economies,
entrepreneurs recognize and pursue an opportunity
that can improve their incomes and also their degree of
independence. Among innovation-driven economies,
highest proportions of such improvement-driven
opportunity motives by were reported in Canada, Finland,
Netherlands, Singapore, Switzerland: roughly two out
of three early-stage entrepreneurs for each of these
economies. Instead, economies like Jamaica, India and
Malawi have close to 40% of necessity-driven early-stage
entrepreneurs.
Demographic characteristics of early-stage entrepreneurs
are also identified annually. A consistent finding is that
in each phase of economic development, there are
more early-stage entrepreneurs in the 25–34 age group
than in any other age range. Women’s participation in
entrepreneurship relative to men ranges markedly: In
MENA economies more than two-thirds of the early-stage
entrepreneurs are men, while in Sub-Saharan African
economies there are nearly the same number of men and
women involved in starting and owning-managing new
businesses.
An entrepreneurial sector requires dynamics but also a
substantial degree of stability. GEM annually measures the
rate of established business ownership (owner-managers
in businesses that exist 3 ½ years or more). This rate
exhibits large variation across economies. In factor-driven
economies, TEA rates tend to be higher than the rates
of owner-managers in established businesses. In many
Latin American economies, for example, the rates of
established business ownership rates are less than one
third of TEA rates. Zambia has less than one-tenth this level
of established business owners. These findings underline
that in many factor and efficiency-driven economies the
limited sustainability of the many start-up attempts is
a serious concern. Examples of factor- and efficiencydriven economies where the rate of owner-managers
in established businesses exceeds the TEA rate include
Ghana, Uganda, Thailand and India.
Economies that see many businesses being started also
witness high percentages of individuals abandoning or
discontinuing their entrepreneurial activity. The rate of
business discontinuance is highest in the factor-driven
economies —mainly in Sub-Saharan African economies—
citing an unprofitable business, problems getting finance
and personal reasons as the most common motive for
discontinuing. Financial issues (unprofitable businesses or
problems obtaining finance) remain the most important
reason mentioned for business discontinuation in the
majority of economies, also in other stages of economic
development. However, in some (mainly-innovation-driven)
economies, a significant share of entrepreneurs who
discontinued owning and managing their business did so for
“positive” reasons such as being able to sell the business,
or the opportunity to get a good job, and for some an
improvement in their personal situation.
ENTREPRENEURIAL ASPIRATIONS
Growth expectations and aspirations of early-stage
entrepreneurs represent a key dimension of (potential)
entrepreneurial impact and may be linked directly to
many first-priority policy objectives around the world: to
create more jobs. This is an important policy concern for
nearly every government, particularly in the aftermath of
the global financial crisis and the accompanying upswing
in unemployment rates. In many economies, especially
those with high TEA rates, the number of early-stage
entrepreneurs indicating they expect to employ five
employees within the next five years is rather low. In
general, MENA and European economies, pair low TEA
rates with relatively higher percentages of early-stage
entrepreneurs with high-growth expectations. Hence, the
GEM results illustrate that if one is interested in linking
entrepreneurship to indicators of economic performance
(such as job growth) a simple count of start-ups or selfemployed is not sufficient.
Measures dealing with innovative orientation of early-stage
entrepreneurs show some variation among regions. The
average degree to which early-stage entrepreneurs consider
their activities to be new for the region increases with the
level of economic development. Early-stage entrepreneurs
in Asia Pacific and South Asia - with economies that are
now characterized for their high degree of innovative
products like Japan, Korea and China - report most
frequently that their product or service is new, closely
followed by entrepreneurs in North America and the
European Union. Sub-Saharan economies, however, exhibit
lower proportions of innovative orientation, as well as
European economies outside the EU. Focusing on emerging
economies, early-stage entrepreneurs in Colombia,
Chile, Taiwan and South Africa, frequently report offering
products or services that are new to their customers and
see few local competitors.
As for internationalization, the factor-driven economies
revealed the lowest level of international customers, on
average. The EU economies generally showed a high level
of internationalization. Economies with big territories and
relatively big internal markets (for example: Brazil, Russia,
China or India) continue to exhibit lower international
orientation. Instead, innovation-driven economies with
relatively small local markets have a high international
orientation. This is the case in Singapore, Luxemburg and
Israel.
ENTREPRENEURSHIP FRAMEWORK CONDITIONS
Interviews with national experts revealed insights on factors
impacting the environment for entrepreneurship. GEM
calls these factors Entrepreneurial Framework Conditions
(EFCs). Examples of EFCs include financial support, general
government support, specific regulations, market openness,
R&D transfer, entrepreneurship education and cultural
norms and values related to entrepreneurship. In general,
experts in innovation-driven economies (for instance in the
EU and North America) gave higher ratings to the EFCs.
In contrast, experts in Sub-Saharan African economies
gave, on average, low evaluations – particularly related
to R&D transfer. Some of the developing and emerging
economies around the globe—Argentina and Brazil in Latin
America, Malawi and Uganda in Africa, Indonesia and
Philippines in Asia Pacific, Bosnia and Herzegovina and
Romania in Europe— have, in the opinion of the experts,
little support from government regulation. Experts in some
more developed economies (Italy, Croatia and Lithuania)
were also critical of this EFC (government regulation).
The entrepreneurial framework conditions ‘physical
infrastructure’ and ‘commercial and legal infrastructure’
were, relative to the other EFCs, positively assessed across
most of the economies. ‘Education and training’ in primary
and secondary school and regulations impacting new and
growing firms were among the most negatively evaluated
factors.
The results emerging from the 2013 GEM results are
diverse. Given the importance of local conditions, GEM
national reports should be consulted since they provide
the most relevant explanations for the entrepreneurial
profiles observed in the economy under assessment. From
a generic perspective, this report shows that entrepreneurs
tend to assess their subjective well-being more favorably
than individuals who are not in the process of starting a
business, or owning and managing a business. However,
in particular, in innovation-driven economies this goes
together with a more problematic assessment of work-life
balance, especially for early-stage entrepreneurs. Hence,
education and training related to entrepreneurship should
perhaps pay more attention to these ‘softer’ aspects that
13
may get limited attention but could play an important role
for entrepreneurs.
While the GEM 2013 results again confirmed that in most
economies the female entrepreneurs are outnumbered by
males, the results of the special topic suggest that female
entrepreneurs are generally more satisfied: on average they
exhibit higher scores on subjective well-being and worklife balance. Taking this information, a more even genderbalance in entrepreneurship could imply a better work-life
balance for society. For some economies it may therefore
be fruitful to convince talented females considering starting
a business to take the final hurdle, which for some may
be a particularly difficult one. To this end other female
entrepreneurs could play an important function, as a role
model or mentor.
14
Finally, the GEM results have made clear that different
types of entrepreneurship coexist. Identifying these types
provides a better understanding of the entrepreneurial
capacity of an economy. Even though GEM originally
focused on the early-stage entrepreneurial activity rate
(TEA) as the key indicator, accumulated knowledge from
empirical GEM-based research, has led to the notion that
various types and phases of entrepreneurship should be
identified to be able to fully compare the entrepreneurial
landscapes between one economy and the other. Examples
of these phases include the nascent (pre-startup) phase,
but also the phase of opportunity recognition and business
discontinuation. Entrepreneurial aspirations are also
crucial for assessing the quality of entrepreneurship in
terms of potential impact. Additionally, GEM has shown
that a behavioral approach to entrepreneurship, meaning
for example that entrepreneurial activities by employees
are to be considered (outlined in this report), enriches the
entrepreneurial profiles from GEM data. It makes clear how
entrepreneurship manifests itself in particular economies
across the globe and that focusing on increasing the
number of start-ups or self-employment is not the same as
a focus on stimulating entrepreneurship.
The Global Entrepreneurship Monitor, GEM, is the largest
international research initiative that analyzes the propensity of the adult population of a country to participate in
entrepreneurial activities and the conditions that enhance
these entrepreneurship initiatives. To date GEM is one of
the few academic initiatives providing harmonized internationally comparable data systematically and annually.
GEM was developed in 1997 by researchers at the London
Business School, UK and Babson College, USA, and the
first GEM study was formed by a group of 10 economies in
1999. Since then GEM has become a consortium of more
than 90 national teams. In 2004, London Business School
and Babson College transferred GEM’s intellectual capital to the Global Entrepreneurship Research Association,
GERA, non-profit organization run by representatives of
national teams plus the two founding institutions and the
sponsoring institutions.
This effort is accomplished through the collaborative work
of a consortium of national teams consisting of dedicated
entrepreneurship researchers across the globe. Each GEM
national team oversees an annual survey, called Adult Population Survey (APS) that is completed by a representative sample of at least two thousand adults in each economy.
In addition, they consult with national experts on ‘entrepreneurial framework conditions’, factors that can explain
the nature and level of entrepreneurship in their economies
through the National Expert Survey (NES).
15
16
Entrepreneurship has become a term that is increasingly
widespread around the world. According to a broad
spectrum of key players in society, including policymakers,
academics, entrepreneurs themselves as well as for
the population at large, entrepreneurship tends to be
associated with economic development and well-being
of society. Since its beginning, GEM has had as one of its
core principles, the objective to explore and assess the
role of entrepreneurship in national economic growth.
This scope is aligned with the “Schumpeterian” view that
entrepreneurs are ambitious and spur innovation, speed
up structural changes in the economy, introduce new
competition and contribute to productivity, job creation and
national competitiveness.
However, entrepreneurship has many faces and also
includes initiatives that are accompanied by less ambitious
business activities leading to limited or no growth. In
fact, most entrepreneurial activity (as defined by GEM)
falls under this category, as several previous GEM Global
Reports have documented. It is important to note that
different types of entrepreneurship may all have important
implications for socio-economic development. Across the
globe, many individuals pursue a business activity because
alternative options for work are limited or non-existent;
by having the option to engage in self-employment they
are able to take care of themselves and their families.
They may even be able to set aside some money allowing
their children to participate in proper education. This
‘face’ of entrepreneurship is very prominent in developing
economies.
Even though the self-employed contribute to the
flexibility and productivity of the overall economy, some
could possibly be more productive by working as an
employee. Entrepreneurship researchers acknowledge
this and argue that studying causes and consequences
of entrepreneurship requires going beyond viewing
entrepreneurship as an occupation (self-employment; startup rates). Instead the focus has moved to entrepreneurial
behavior, including for example entrepreneurial employee
activity (a term that is closely related to “intrapreneurship”
or “corporate entrepreneurship”, see Bosma et al.# 2013).
Finally, an emerging body of literature is paying attention
to the phenomenon of “social entrepreneurship”, which
is about people starting and developing new initiatives
where the value of the (local, regional) society is put
before the value of the individuals leading these initiatives.
Policy makers are increasingly attempting to implement
policies supporting social entrepreneurship, especially
in areas where governments are forced to cut budgets
and unemployment has been increasing; hence the idea
is that entrepreneurs come up with the solutions to
societal challenges. The holistic view of entrepreneurship,
identifying several types of entrepreneurship that are
relevant to the particular context, is in accordance with the
body of literature stemming from ‘Austrian economics’,
stating that entrepreneurship is an omnipresent aspect of
human action, but that its manifestation depends upon
the institutional environment (Baumol, 1990; Boettke and
Coyne, 2003).
GEM has, over its fifteen-years of existence, adopted
this holistic view of entrepreneurship that was already
encompassing the ambitious and non-ambitions types from
the start (1999) and identifying necessity and opportunitydriven motivation early on in the project (2000). Since
2001 the key GEM indicators have been kept the same
in order to facilitate comparisons over time. While in the
beginning of the project GEM focused on the business
creation process, other behavioral types of entrepreneurial
activity have followed suit, such as social entrepreneurship
(2009) and entrepreneurial employee activity (2011).
Accordingly, following the assessment of entrepreneurial
employee activity, GEM defines entrepreneurship as “any
attempt at new business or new venture creation, such
as self-employment, a new business organization, or the
expansion of an existing business, by an individual, a
team of individuals, or an established business” (Bosma,
Wennekers and Amorós, 2012#g%9).
With this GEM 2013 Global Report we are celebrating
GEM’s fifteen-years of assessing entrepreneurship
across the globe. This report underlines the role that
entrepreneurship may play, not only in accelerating
economic recovery, but also as a real driver of sustainable
development in many economies. In addition, over the
past fifteen years, economies across the globe have
become more connected; they want to keep up with
other economies. At the same time, they appreciate their
unique historical and cultural heritages. Therefore it is
safe to say that in comparison to 1997, when the first
ideas about forming an international entrepreneurship
index were exchanged and the GEM project emerged, the
need for systemic and encompassing knowledge about
entrepreneurship across the globe is even more relevant
today.
The Global Entrepreneurship Monitor was conceived in
September 1997 by Michael Hay of London Business School
(LBS) and Bill Bygrave of Babson College. LBS and Babson
funded a prototype study that year. Ten national teams
(the G7 economies: Canada, France, Germany, Italy, Japan,
United Kingdom and United States and three additional
economies: Denmark, Finland and Israel) conducted the
first GEM study in 1999 with Paul Reynolds as the principal
investigator. Under his supervision the project grew to 31
national economies in 2003. In order to govern the interests
of the GEM National Teams, the Global Entrepreneurship
Research Association (GERA) was formed in 2004 to serve
as the oversight body for GEM. GERA is a not-for-profit
organization governed by representatives of the national teams, the two founding institutions and sponsoring
institutions. Now, fifteen years later, GEM has measured
entrepreneurship in 104 economies, and has gained widespread recognition as the most authoritative longitudinal
study of entrepreneurship in the world. In 2013, more than
197,000 individuals have been surveyed and approximately
3,800 country experts on entrepreneurship participated in
the study across 70 economies, collectively representing
all regions of the world and a broad range of economic
development levels. The samples in the GEM study covered
an estimated 75% of the world’s population and 90% of
the world’s total GDP. In addition to its annual measures
of entrepreneurial attitudes and activity, GEM analyzed
well-being as a special topic focus in 2013.
GERA’s mission is to contribute to global economic
development through entrepreneurship. To achieve this,
GERA seeks to increase worldwide knowledge about
entrepreneurship by conducting and disseminating worldclass research that:
1. uncovers and measures factors impacting the level of
entrepreneurial dynamics among economies,
2. aids in identifying policies that may lead to appropriate
levels of entrepreneurial activity, and
3. increases the influence of education in supporting
successful entrepreneurship.
GEM focuses on these main objectives:
• to allow for comparisons with regard to the level and
characteristics of entrepreneurial activity among different
economies;
• to determine the extent to which entrepreneurial activity
influences economic growth within individual economies;
• to identify factors which encourage and/or hinder
entrepreneurial activity; and
• to guide the formulation of effective and targeted policies
aimed at stimulating entrepreneurship
GEM provides a comprehensive view of entrepreneurship
across the globe by measuring the attitudes of a population,
and the activities and characteristics of individuals involved
in various phases and types of entrepreneurial activity.
Research teams in each participating economy administer
an Adult Population Survey (APS) of at least 2,000 adults
annually. Complementing the APS is a National Expert
Survey (NES), which provides in-depth opinions from
selected national experts on the factors that impact the
nature and level of entrepreneurship in each economy.
GEM is based on the following premises. First, an
economy’s prosperity is highly dependent on a dynamic
entrepreneurship sector. While this is true across all stages
of development, the nature of this activity can vary in
character and impact. Necessity-driven entrepreneurship,
particularly in less developed regions or those experiencing
declines in employment, can help an economy benefit from
self-employment initiatives when there are fewer work
options available. More developed economies, on the other
hand, generate entrepreneurial opportunities as a result
of their wealth and innovation capacity, yet they also offer
more wage employment options to attract those that might
otherwise become independent entrepreneurs. If these
opportunities for entrepreneurship and innovation are to be
captured, such economies need to instill opportunity-based
motives and entrepreneurial incentives.
Second, an economy’s entrepreneurial capacity is based
on individuals with the ability and motivation to start
businesses, and may be strengthened by positive societal
perceptions about entrepreneurship. Entrepreneurship
benefits from participation by all groups in society,
including women, disadvantaged minorities and a range
of age groups and education levels. Finally, high-growth
entrepreneurship is a key contributor to new employment
in an economy, and national competitiveness depends on
innovative and cross-border entrepreneurial ventures.
17
Since its beginning, GEM’s focus has been on individuals,
men and women who are involved in different stages of the
entrepreneurial dynamics, as units of observation. GEM’s
approach enables a more comprehensive account of new
ventures activity compared with measures of formally
registered businesses1 (for example GEM captures both
informal and formal activity that encompasses those in the
process of starting a business as well as those running new
and established businesses). The GEM database allows
the exploration of individual or business characteristics,
as well as the causes and consequences of new venture
creation. This also makes different comparisons particularly
interesting; it is not only about “how many” people are
involved in entrepreneurship in a country or region; it
is also about exploring differences in types and phases
of the entrepreneurship process. As a result, GEM has
created a wide range of entrepreneurial initiatives, such
as a group of high growth-expectation entrepreneurs,
demographic issues (like age and gender) or more recently
entrepreneurial employee activities. Additionally the GEM
project has been producing a series of special topic reports
using the richness of the data that can be combined with
other secondary sources of data. Table 1.1 summarizes all
the special topics reports produced since 2000.
GEM 2012 Sub-Saharan Africa Regional Report
GEM Special Report on Entrepreneurial Employee Activity
GEM YBI Youth Report
GEM 2012 Women’s Report
GEM 2010 Womens Report
18
GEM Endeavor 2011 High Impact Entrepreneurship Report
GEM Special Report on Education and Training
GEM 2009 Report on Social Entrepreneurship
The IIIP Innovation Confidence Indexes 2009 Report
The IIIP Innovation Confidence Index 2008 Report
GEM 2007 Report on Women and Entrepreneurship
The IIIP Innovation Confidence Index 2007 Report
GEM 2007 Report on High-Growth Entrepreneurship
GEM 2006 Report on Women and Entrepreneurship
GEM 2006 Financing Report
GEM 2005 Report on Women and Entrepreneurship
GEM 2005 Report on High Expectation Entrepreneurship
GEM 2004 Financing Report
1
For an explanation about these differences see Bosma et al., 2009# p. 12 “Main distinctions between GEM Adult population Survey
Data and BusinessI\^`jkiXk`fe;XkX%
THE PHASES OF ENTREPRENEURSHIP
The GEM project has focused on entrepreneurship as
a process comprising different phases, from intending
to start, to just starting, to running new or established
enterprises and even discontinuing a business. Given that
the context and conditions that affect entrepreneurship
in different economies are diverse and complex, it is not
possible to conclude that one phase inevitably leads to the
next. For example, an economy may have a large number
of potential entrepreneurs but this may not necessarily
translate into a high rate of entrepreneurial activity. These
categories discerning phases of entrepreneurship are
derived from the raw GEM data using different complex
filter procedures2.
old. Given the challenges associated with starting a new
business, many fledgling businesses fail in the first few
months, hence not all nascent entrepreneurs progress to
the next stage. New business owners are defined as those
former nascent entrepreneurs who have been in business
for more than three months, but less than three and a
half years (42 months). This period is based on a series
of empirical evidence that states that many new ventures
fail between their inception and 42 months, so we focus
on observing the early stages of entrepreneurial activities.
For GEM, the combination of the nascent and the new
business owners together account for the total early-stage
entrepreneurial activity (TEA), one of the key measures of
GEM.
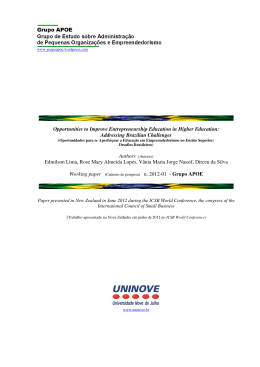
Figure 1.1 shows the entrepreneurship process and
operational definitions, as conceptualized by the GEM
research framework. This multiphase process is useful
for assessing the state of entrepreneurship at different
points. This process starts with the involvement of
potential entrepreneurs—those individuals who manifest
entrepreneurial attitudes as potential prerequisites of the
entrepreneurial. These individuals believe they possess
the capability to start a business, see new business
opportunities and would not be dissuaded from doing so
for fear of failing. Additionally their intention to start a
business is underpinned by the perceptions society holds
of entrepreneurs, the status these individuals enjoy in
their society and whether the media positively represents
entrepreneurs.
Established businesses are those that have been
in existence for more than three and a half years.
Discontinuation of activities in owning and managing a
business are also important aspects of entrepreneurship.
Some recurring GEM survey questions capture
discontinuation and the reasons for it. In many cases,
the reasons appear to be rather positive. Indeed, many
of the individuals who discontinue their business start
again, and become serial entrepreneurs (Bosma and Levie,
2010; Hessels et al., 2010) or they may join established
companies and enact their entrepreneurial ambitions as
employees. It is important to consider both established
business owners as well as entrepreneurs who have
discontinued or exited businesses because these two
categories represent a key resource for other entrepreneurs
(for example, by providing financing, mentorship, advice or
other types of support).
The next phase is nascent entrepreneurial activity—
individuals starting new enterprises less than three months
Discontinuation
of Business
TOTAL EARLY-STAGE ENTREPRENEURIAL ACTIVITY (TEA)
Potential Entrepreneur:
Opportunities, Knowledge
and Skills
Nascent Entrepreneur:
Involved in Setting Up a
Business
(up to 3.5 years old)
Firm Birth
Conception
Owner-Manager of an
Established Business
(more than 3.5 years old)
Owner-Manager
of a New Business
Persistence
Early-stage Entrepreneurship Profile
Socio-demographics
> Sex
> Age
Industry
> Sector
Impact
> Business growth
> Innovation
> Internationalization
For full description of the procedures and variables refer to GEM operation manual available at http://www.gemconsortium.org/docs/2375/gem-manual-design-data-and-quality-control
2
19
GEM METHODOLOGY
As explained at the beginning of this introduction, one
of the key purposes of GEM is to provide reliable data on
entrepreneurship that will be useful in making meaningful
comparisons, both internally and between economies, over
time. For this reason, all participating economies make
use of standard research instruments and methodology.
The GEM data are gathered annually and are derived from
two main sources: Adult Population Survey and National
Experts Survey.
ADULT POPULATION SURVEY (APS)
Each participating economy conducts a survey of a random
representative sample of at least 2,000 adults (over 18
years old). Surveys are conducted at the same time of year
(generally between April and June), using a standardized
questionnaire developed by the GEM consortium. The APS
is generally conducted by an independent survey vendor,
chosen by each economy’s GEM team. The vendor submits
a proposal for the GEM data collection, which is reviewed
by the GEM coordination team on various criteria. The
raw data is sent directly to the GEM data team for review,
quality check and uniform statistical calculations before
being made available to the participating economies.
The most up-to-date information on data collection
methodology is available in the GEM Data Manual,
available on www.gemconsortium.org.
20
NATIONAL EXPERTS SURVEY (NES)
The National Experts Survey provides insights into the
entrepreneurial start-up environment in each economy with
regard to the nine entrepreneurial framework conditions:
•
Financing
•
Governmental policies
•
Governmental programs
•
Education and training
•
Research and development transfer
•
Commercial infrastructure
•
Internal market openness
•
Physical infrastructure
•
Cultural and social norms
The NES sample comprises a minimum of 36 respondents,
with four experts drawn from each of the entrepreneurial
framework condition categories. Out of this sample, a
minimum of 25% must be entrepreneurs or business
owners, and 50% must be professionals.
Additional aspects such as geographic distribution, gender,
the public versus private sector, and level of experience
are also taken into account in selecting the sample. For
more detailed information we again refer to the GEM Data
Manual, available on www.gemconsortium.org.
Since its inception, GEM has pursued and explored the
bi-directional relationship between entrepreneurship and
economic development (Wennekers and Thurik, 1999;
Carree and Thurik, 2003; Acs, 2006; Audretsch, 2007).
To this end, GEM developed a conceptual framework
that sets out key elements of the relationship between
entrepreneurship and economic growth and the way in
which the elements interact. It took as its starting point
the recognition that while other scholars had defined the
general national framework conditions for established
enterprise to thrive (Schwab and Sachs, 1997, 1998), a
different set of “entrepreneurial framework conditions”
(EFCs) and both entrepreneurial capacities and
entrepreneurial opportunities were needed to enable new
business activity. This emergent phase of GEM is described
by Reynolds et al. (2005) and the first conceptual
framework is discussed in detail by Levie and Autio (2008).
Building on that model, the current GEM conceptual
framework reflects the complexity of the causal
relationships between entrepreneurship and economic
development globally (Bosma et al., 2009; Bosma and
Levie, 2010). It acknowledges that the contribution of
entrepreneurs to an economy varies according to its
phase of economic development (Wennekers et al.,
2005; Gries and Naude, 2008), which to certain extent
drives the institutional setting. It also reflects a nuanced
distinction between phases of economic development, in
line with Porter’s typology of “factor-driven economies”,
“efficiency-driven economies” and “innovation-driven
economies” (Porter et al., 2002), and recognizes that
GEM’s unique contribution was to describe and measure,
in detail, the conditions under which entrepreneurship and
innovation can thrive. These categories are based on the
World Economic Forum’s (WEF) Global Competitiveness
Report, which identifies three main phases of economic
development based on GDP per capita and the share of
exports comprising primary goods.
According to the WEF classification, the factor-driven
phase is dominated by subsistence agriculture and
extraction businesses, with a heavy reliance on (unskilled)
labor and natural resources. The focus of development
efforts tends toward building a sufficient foundation of
basic requirements.
In the efficiency-driven phase, an economy has become
more competitive with further development accompanied
by industrialization and an increased reliance on economies
of scale, with capital-intensive large organizations
more dominant. This phase is generally accompanied
by improved (and improving) basic requirements, and
attention is then directed toward developing the efficiency
enhancers.
As development advances into the innovation-driven
phase, businesses are more knowledge-intensive, and
the service sector expands. While entrepreneurship and
innovation factors are more dominant in this phase, it must
be noted that these conditions rely on a healthy set of basic
requirements and efficiency enhancers.
The framework incorporates the three main components
that capture the multi-faceted nature of entrepreneurship:
entrepreneurial attitudes, entrepreneurial activity, and
entrepreneurial aspirations. These are included as
components of a “black box” that produces innovation,
economic growth and job creation, without spelling out
in detail how they affect and reinforce each other. This
ambiguity was deliberate; it reflected the view that all
three elements may affect each other rather than being
components of a linear process and it was expected that
further theoretical and empirical work would open up
this black box. Aspiration or ambition is relevant because
researchers increasingly realize that all entrepreneurial
activity does not equally contribute to development. For
example, in many economies, much employment creation
comes from a small number of ambitious, fast-growing new
businesses (Autio, 2007).
Furthermore, potentially ambitious entrepreneurs react
differently to different regulatory and legal regimes than
those who are less ambitious (Levie and Autio, 2011).
Finally, this revised GEM framework highlights the
contributions of entrepreneurial employees as well as
their role as potential future independent entrepreneurs.
The current ><D conceptual framework is shown in Figure
1.2. This figure also shows how ><D measures different
components, such as entrepreneurial framework conditions
using the national expert survey, and the entrepreneurship
profiles, encompassing entrepreneurial attitudes, activity
and aspirations using the adult population survey.
After 15 years of systematic measurements of
entrepreneurship dynamics, the ><D project continues
to support building evidence on the relevance of
entrepreneurship for national economic growth, innovation
and job creation. The ><D community has continuously
worked on the ><D conceptual framework in order to
better reflect the insights emerging from the
entrepreneurship literature and in particular the
multidimensional characteristics of entrepreneurial
dynamics. This has led to, for example, incorporating
entrepreneurial employee activities and social value
creation. In this fifteenth ><D >lobal Ieport, :hapter 4
reviews the developments in GEM over the course of time
and the results of thirteen years of consistent ><D
indicators. Of course, the impact of the economic
downturn that has been faced by many economies across
the globe since 2008, deserves special attention. The GEM
results suggest that there is not a uniform “entrepreneurial
response” to an economic crisis, nor is the role
entrepreneurship plays for economic recovery similar
across economies. Again, causes and consequences very
much depend on the local context. For a solid
understanding of the relationships that are at play, it is
relevant to refer to the various ><D national reports, freely
available on the GEM website (www.gemconsortium.org).
21
Basic requirements
· Institutions
· Infrastructure
· Macroeconomic stability
· Health and primary education
From other
available
sources
SOCIAL,
CULTURAL,
POLITICAL
CONTEXT
From GEM
National Expert
Surveys (NES)
Efficiency enhancers
· Higher education & training
· Goods market efficiency
· Labor market efficiency
· Financial market sophistication
· Technological readiness
· Market size
Innovation and
entrepreneurship
· Entrepreneurial finance
· Government policy
· Government entrepreneurship
programs
· Entrepreneurship education
· R&D transfer
· Internal market openness
· Physical infrastructure for
entrepreneurship
· Commercial, legal infrastructure
for entrepreneurship
· Cultural and social norms
Established Firms
Employee
Entrepreneurial
Activity
From GEM Adult
Population Surveys
(APS)
Entrepreneurship Profile
Attitudes:
Perceived opportunities & capabilities; Fear of Failure; Status of
entrepreneurship
Activity:
Opportunity/Necessity-driven,
Early-stage; Inclusiveness;
Industry; Exits
Aspirations:
Growth, Innovation
International orientation
Social value creation
From GEM Adult
Population
Surveys (APS)
Socio-Economic
Development
(Jobs,
Innovation,
Social value)
authors and articles with the most impact (measured by
citation counts). Finally, Amorós and colleagues map the
objectives and research questions of GEM-based papers.
Niels Bosma. “The Global Entrepreneurship Monitor
(GEM) and its impact on entrepreneurship research.”
Foundations and Trends© in Entrepreneurship, Volume 9,
Number 2, pages 143–248, February 2013.
José Ernesto Amorós, Niels Bosma and Jonathan
Levie. “Ten years of Global Entrepreneurship Monitor:
Accomplishments and prospects.” International Journal
of Entrepreneurial Venturing, Volume 5, Number 2, pages
120–152, May 2013.
Claudia Álvarez, David Urbano and José Ernesto Amorós.
“GEM research: Achievements and challenges.” Small
Business Economics, in press DOI 10.1007/s11187-0139517-5, October 2013.
RESEARCH ISSUE
In 2013, three studies were published that – in varying ways
- provide an overview on the development of GEM-based
research. Taken together they demonstrate the evolution of
the GEM project and the relevance of GEM-based research
for both entrepreneurship scholars and policymakers.
22
Niels Bosma’s monographic in Foundations and Trends©
in Entrepreneurship and José Ernesto Amorós, Niels
Bosma and Jonathan Levie’s work in International Journal
of Entrepreneurial Venturing share two main objectives
and contributions. The first objective is to document
the evolution of the Global Entrepreneurship Monitor
Project and recognize the relevance of GEM as one of
the world’s largest cross-national collaborative social
science research projects, in terms of methodology
and scholarly impact. The second objective is to offer a
series of recommendations about how the GEM project
might evolve further and make more of an impact on
entrepreneurship research, on entrepreneurship policy and
practice, and ultimately on economic development. Claudia
Álvarez, David Urbano and José Ernesto Amorós’ research
in Small Business Economics shares the latter objective
by analyzing the evolution of GEM-based research and
how the GEM could be better positioned in the academic
community.
THEORY AND METHOD
These three works are based on a systematic and rigorous
search of articles published in journals within the Thomson
Reuters’ Social Sciences Citation Index through an analysis
focused on articles using GEM data. The differences are
in the approaches and scopes of the analyses. Bosma
distinguishes studies aimed at unraveling factors that
determine the level of entrepreneurial activity (micro
and macro level) from studies dealing with (economic)
consequences of entrepreneurial activity. Álvarez and
colleagues base their approach on institutional theory,
identifying the topics, units of analysis and statistical
techniques used throughout these studies, as well as on the
FINDINGS
The three articles all address the evolution of GEM and
highlight the tremendous increase in peer-reviewed
empirical research that uses GEM data. This demonstrates
increasing acceptance of the value of GEM data in
academic circles. While considering the importance of the
topic and the explicit drive of GEM researchers to better
understand the relationship between entrepreneurship
and development, the quantity and quality of the academic
output so far seem rather limited.
All authors agree on a relative gap in the number of GEMrelated papers published in top journals. This issue can be
addressed, however, by enhancing the academic prestige
of GEM. GEM is now in its 15th year, and the richness
of its data and, more importantly, its knowledge capital,
is truly relevant. Additionally, the current availability of
individual- and country-level data enables academics
‘‘outside’’ national teams to use GEM data in their research.
Such researchers could use GEM data to not only increase
the quantity of GEM-related publications, but also to add
new studies that could include, for example, the global
economic crisis of 2008–2010, the Euro crisis, challenges
for emerging regions of the world or some specific topics
related to institutional and socio-demographic variables.
Additionally there is a call for the use of more sophisticated
estimation techniques that can not only contribute to
the empirical knowledge but also to construct better
theoretical frameworks. GEM data involves important
dimensions: micro (individuals), context (nations
and regions) and time (annual assessment for most
economies)3. Thus, this data set is appropriate for
multilevel modeling and lends itself uniquely to the study of
individual, organizational and environmental factors, which
combine to provide a more comprehensive analysis than
any one aspect in isolation.
IMPLICATIONS
These three articles underline significant progress that has
been made in GEM research, positioning the database as
one of the most significant reference sources in leading
high-impact entrepreneurship journals. With an expanding
dataset and growing community of scholars using the
data, care needs to be taken to move GEM-based research
to a higher level, for the benefit of the wider research
community. Care should also be taken to acknowledge
limitations of the data. GEM was certainly not set up
to answer every question related to entrepreneurship,
although sometimes there seems to be an expectation
that it should. There are still big challenges ahead. These
three works highlight some streams of research where
GEM may provide a useful—if not essential—contribution
in the near future. Finally, there is also an invitation for
the GEM consortium to continually show entrepreneurial
behavior and to innovate both in measures and in methods
if it is to remain at the forefront of international research in
entrepreneurship and economic development.
3
A limitation is that the GEM Adult Population Survey is not a longitudinal data set. Hence, even though the time dimension is included since the survey
is held annually, longitudinal analyses cannot be conducted. At the macro-level, panel data analysis and GMM techniques can be used.
23
24
The GEM data collection offers entrepreneurial profiles
of economies along three important dimensions.
Entrepreneurial attitudes and perceptions reflect the
degree to which individuals in economies tend to
appreciate entrepreneurship, both in terms of general
attitudes and in terms of self-perceptions: How many
individuals recognize business opportunities, how many
believe they have the skills and knowledge to exploit such
opportunities and how many would refrain from exploiting
such opportunities through fear of failure? Entrepreneurial
activity measures the observed involvement of individuals
in different phases of entrepreneurial activity. It also
tracks the degree to which entrepreneurial activities are
driven by opportunity and/or necessity. Discontinuations
of entrepreneurial activity (and the reasons for doing so)
are also estimated from GEM Adult Population Surveys.
Finally, entrepreneurial aspirations are of key importance in
addressing the (socio) economic impact of entrepreneurial
behavior. Entrepreneurs that expect to create jobs, to
be involved in international trade and/or to contribute
to society by offering new products and services are of
particular interest. This chapter deals with each of these
components based on the results of the GEM 2013 Adult
Population Survey. Since 2008, GEM Global reports have
categorized the participating economies by phase of
economic development, namely factor-driven, efficiencydriven and innovation-driven economies. Yet as GEM has
continued to grow, its geographic coverage has expanded.
This gives the opportunity to compare results within
and across geographic regions of the world. This report
will therefore analyze the findings from the geographic
perspective (global regions) and by phase of economic
development. Table 2.1 shows the participating economies
by global region and phase of economic development.4
Fostering entrepreneurial awareness and positive
attitudes towards entrepreneurship are high on the
policy agenda of several economies.5 The idea is that, for
individuals, evolving attitudes and perceptions towards
entrepreneurship could affect those venturing into
entrepreneurship. However, the perception of opportunities
for startups and that of (matching) personal capabilities
do not necessarily represent the key determinant of
making the step to entrepreneurial activity. McMullen
and Shepherd (2006), for instance, argue that individuals
first react to opportunities when they see them – only
afterwards are considerations about desirability and
feasibility made. Fear of failure when it comes to starting a
business (and the consequences of failure) could also deter
an individual from exploiting perceived entrepreneurial
opportunities. In addition to these individual
characteristics, elements of the context, such as the
availability of (good) job alternatives in an economy and
the perceptions of others can make a difference for those
perceiving market opportunities and having confidence in
4
In 2013, 70 economies participated in the GEM cycle. However, the results from Turkey, Namibia and some Caribbean States are not included in the
first release due to technical problems uncovered in the inspection by GEM’s central data team. While these problems could not be resolved before the
publishing deadline for this report, their information will be published later in a pdf version.
5
See e.g. OECD (2010, p.76).
6
Those who prefer to be working as an employee in this setting may particularly be inclined to opt for entrepreneurial employee activity, see Chapter 4.
Innovation-driven Economies
Factor- Driven Economies
Argentina2, Brazil2, Barbados2, Chile2, Trinidad and Tobago
Colombia, Ecuador, Guatemala,
Jamaica, Mexico2, Panama2, Peru,
Suriname, Uruguay2
Latin America
& Caribbean
Middle East &
North Africa
Sub-Saharan
Africa
Asia Pacific &
South Asia
Europe – EU28
Europe – NonEU28
Algeria1, Iran1, Libya1
Angola1, Botswana1, Ghana,
Malawi, Nigeria, Uganda, Zambia
India, Philippines1, Vietnam
Israel
Namibia, South Africa
China, Indonesia, Malaysia2, Thailand
Japan, I\glYc`Zf]Korea, Singapore,
Taiwan
Croatia2, Estonia2, Hungary2, Latvia2,
Lithuania2, Poland2, Romania, Slovak
Republic2
Belgium, Czech Republic, Finland,
France, Germany, Greece, Ireland
Italy, Luxembourg, Netherlands,
Portugal, Slovenia, Spain, Sweden,
United Kingdom
Norway, Switzerland
Bosnia and Herzegovina, Macedonia,
Russian Federation2, Turkey2
North America
Canada, Puerto Rico*, United States
1) In transition phase between Factor-Driven and Efficiency-Driven
2) In transition phase between Efficiency-Driven and Innovation-Driven
* Puerto Rico is considered to be a part of North America for its status as an associate state to the United States, even though this economy shares
many characteristics of Latin American and Caribbean countries.
their own entrepreneurial capabilities to actually engage in
independent entrepreneurial activity6%This supports the
notion that there is much in between attitudes and activities
and that a mixture of individual, social and contextual
factors impact on the individual decision making process
when it comes to venturing into entrepreneurial activity.
Table 2.2 shows how economies compare to each other
in terms of entrepreneurial perceptions and attitudes
as measured through the GEM 2013 Adult Population
Survey. While positive attitudes and perceptions towards
entrepreneurship may be instrumental in achieving new
(high-value) entrepreneurial activities in some societies, in
others they seem to matter less. One reason may be that
other alternatives are available to individuals. Appendix
1, KXYc\8%( shows the same information but by phase of
economic development.
25
Latin
America &
:Xi`YY\Xe
26
Middle East &
North Africa
SubSaharan
Africa
Asia Pacific
& South Asia
to successful
entrepreneurs***
High status to
successful
entrepreneurs***
Entrepreneurship
as a good career
choice***
Entrepreneurial
intentions **
Fear
of failure*
Perceived
capabilities
Economies
Perceived
opportunities
REGION
Argentina
40.9
61.7
24.9
31.0
Brazil
50.9
52.6
38.7
27.2
84.6
82.2
84%1
Chile
68.4
59.6
28.0
46.5
69.1
67.2
66.3
Colombia
67.7
57.8
31.8
54.5
90.9
71.4
67.5
Ecuador
57.3
74.3
34,9
39.9
66.5
67.7
79.1
Guatemala
58.8
66.4
33.3
39.0
86.8
71.5
55.1
Jamaica
51.2
79.1
27.0
39.5
79.4
80.9
81.7
Mexico
53.6
58.5
31.6
16.9
57.8
62.3
50.8
Panama
58.7
66.4
28.9
27.0
64.4
59.2
70.4
Peru
61.0
62.2
25,7
33.9
70.4
71.2
71.5
Suriname
52.7
53.5
24.4
13.1
75.6
79.3
65,9
Trinidad and
Tobago
58.0
75.3
19.8
28.7
79.5
72.0
61.0
Uruguay
47.9
61.1
26.9
25.3
58.1
56.0
57.5
Average+
55.9
63.7
28.9
32.5
73.6
70.1
67.6
Algeria
61.9
55.5
32.9
36.0
79.6
84.2
47.4
Iran
37.0
56.5
36.4
30.6
64.1
82.4
59.9
Israel
46.5
36.2
51.8
24.0
60.6
80.3
49.1
Libya
52.3
58.6
33.0
62.1
85.2
84.3
38.2
Average
49.4
51.7
38.5
38.2
72.4
82.8
48.6
Angola
56.7
56.3
63.7
38.3
66.8
72.6
62.1
Botswana
65.9
67.4
18.6
59.2
80.7
83.7
85.6
Ghana
69.3
85.8
24.6
45.6
81.6
94.1
82.4
Malawi
78.9
89.5
15.1
66.7
Nigeria
84.7
87.0
16.3
46.8
81.2
61.9
76.5
South Africa
37.9
42.7
27.3
12.8
74.0
74.7
78.4
Uganda
81.1
83.8
15.0
60.7
88.3
95.3
87.5
Zambia
76.8
79.6
15.4
44.5
66.5
71.2
69.0
Average
68.9
74.0
24.5
46.8
77.0
79.1
77.4
China
33.0
36.2
34.3
14.4
69.6
73.5
71.3
India
41.4
55.7
38.9
22.7
61.4
70.3
61.3
Indonesia
46.6
62.0
35.1
35.0
70.8
79.8
75.2
7.6
12.8
49.3
4.0
31.3
52.7
57.6
12.7
28.1
42.2
12.0
51.3
67.8
67.5
Malaysia
40.7
27.9
33.3
11.8
41.8
44.9
62.2
Philippines
47.9
68.4
36.1
44.1
84.8
79.2
86.7
Japan
Korea,
Republic of
Singapore
22.2
24.7
39.7
15.0
50.9
59.3
75.3
Taiwan
42.0
27.2
40.6
27.8
72.9
64.4
87.0
Thailand
45.3
44.3
49.3
18.4
74.5
74.8
77.1
Europe –
EU28
North
America
to successful
entrepreneurs***
High status to
successful
entrepreneurs***
Entrepreneurship
as a good career
choice***
Entrepreneurial
intentions **
Fear
of failure*
Vietnam
36.8
48.7
56.7
24.1
81.5
80.5
80.5
Average
34.2
39.7
41.5
20.9
61.2
68.1
72.9
Belgium
31.5
33.8
46.6
7.8
54.8
52.2
43.9
Croatia
17.6
47.2
35.2
19.6
61.5
43.1
42.9
Czech
Republic
23.1
42.6
35.8
13.7
Estonia
46.1
40.0
38.8
19.4
53.2
58.6
40.7
Finland
43.8
33.3
36.7
8.3
44.3
85.5
68.5
France
22.9
33.2
41.1
12.6
55.3
70.0
41.4
Germany
31.3
37.7
38.6
6.8
49.4
75.2
49.9
Greece
13.5
46.0
49.3
8.8
60.1
65.1
32.4
Hungary
18.9
37.5
44.8
13.7
45.7
74.1
28.4
Ireland
28.3
43.1
40.4
12.6
49.6
81.2
59.9
17.3
29.1
48.6
9.8
65.6
72.4
48.1
Latvia
34.8
47.8
41.6
22.7
61.4
59.5
58.6
Lithuania
28.7
35.4
41.7
22.4
68.6
57.2
47.6
Luxembourg
45.6
43.3
42.9
14.1
39.4
70.6
36.3
Netherlands
32.7
42.4
36.8
9.1
79.5
66.2
55.2
Poland
26.1
51.8
46.7
17.3
66.8
59.9
58.5
Portugal
20.2
48.7
40.1
13.2
Romania
28.9
45.9
37.3
23.7
73.6
72.6
61.3
Slovakia
16.1
51.0
33.2
16.4
49.2
58.5
51.7
Slovenia
16.1
51.5
29.6
12.4
57.4
68.1
50.5
Spain
16.0
48.4
36.3
8.4
54.3
52.3
45.6
Sweden
64.4
38.8
36.6
9.5
52.0
71.5
58.5
United
Kingdom
35.5
43.8
36.4
7.2
54.1
79.3
49.6
Average
28.7
42.3
39.8
13.5
56.9
65.5
49.0
Bosnia and
Herzegovina
23.3
50.5
26.1
21.8
82.3
71.9
39.2
Macedonia
37.2
49.7
35.6
29.1
69.5
67.9
66.8
Norway
63.7
34.2
35.3
5.2
49.3
75.5
56.9
Russia
18.2
28.2
29.0
2.6
65.7
68.0
49.0
Switzerland
41.5
44.7
28.2
9.8
40.5
65.0
47.8
Average
36.8
41.5
30.8
13.7
61.5
69.7
51.9
Canada
57.4
48.5
35.2
13.5
60.6
70.1
69.6
Puerto Rico
28.3
53.0
24.6
13.1
17.9
50.1
68.8
United States
47.2
55.7
31.1
12.2
Average
44.3
52.4
30.3
12.9
39.3
60.1
69.2
Italy
Europe –
Non-EU28
Perceived
capabilities
Economies
Perceived
opportunities
REGION
47.8
* Denominator: 18-64 age group perceiving good opportunities to start a business.
** Respondent expects to start a business within three years. Denominator: 18-64 age group that is currently not involved in entrepreneurial activity
(including involvement in early-stage and established entrepreneurship).
*** This is an optional item in the GEM 2013 Adult Population Survey.
+
Unweighted averages
27
INDIVIDUALS’ PERCEPTIONS:
OPPORTUNITIES, CAPABILITIES AND FEAR
OF FAILURE
The perception of entrepreneurial opportunities measured
in Table 2.2 reflects the percentage of individuals who
believe there are opportunities to start a business in
the area they live in. Perceived capabilities reflect the
percentages of individuals who believe they have the
required skills, knowledge and experience to start a new
business. The measure of fear of failure (when it comes to
starting your own business) applies to those who perceive
opportunities only. For all three measures, individuals
in various countries are likely to have different kinds of
business in mind. The results show high variations across
\Zfefd`\j. High prevalence rates of perceived
opportunities are not always associated with high
prevalence rates of perceived capabilities. It is interesting
to note that Sub-Saharan countries exhibit on average the
highest evaluation in these three perceptions. In these
countries, entrepreneurship rates tend to be high,
suggesting that g\fgc\Xi\n`cc`e^kfXZkfek_\
opportunities they see and believe they are capable of
starting a business. On the other hand, European countries,
mainly EU)/ countries, show the lowest rates. This pattern
is clear in Figure 2.1 whichshows that perceived
opportunities and capabilities tend to decline with greater
development levels. For example, perceived opportunities
and perceived capabilities measures are almost twice as
high in factor-driven economies, 60% and 69%,
respectively, than in innovation-driven economies, 33% and
40%, respectively. Fear of failure is higher in the Asia
Pacific and South Asia region, with Vietnam having the
highest rate with 56%, followed by Japan and Thailand with
49%. EU)/ countries also exhibit this. It is important to
note, however, that these perceptions may reflect different
businesses one generally has in mind, showing the value of
GEM measures of necessity versus opportunity motives,
industry participation, growth orientation and so forth. This
measure will be analyzed in further sections.
28
90%
Percentage of adult population (18-64)
80%
70%
60%
50%
40%
Factor - Driven
Economies
30%
Efficency - Driven
Economies
20%
Innovation - Driven
Economies
10%
0
Perceived
oppotunities
Perceived
capabilities
Fear of
failure
Entrepreneurial Entrepreneurship High status Media attention
intentions
as a good career to succesful
for
choice
entrepreneurs entrepreneurship
ENTREPRENEURIAL INTENTIONS
The next stage in the entrepreneurship process takes
place when a potential entrepreneur expresses the
intention to start a new business in the foreseeable future.
Entrepreneurial intentions, defined by the percentage
of individuals who expect to start a business within
the next three years (those who are currently already
entrepreneurially active are excluded from this measure
presented in Table 2.2) also differ widely across the
economies in each stage of economic development. On
average they tend to be highest in factor-driven economies
where fewer good job alternatives are available and more
necessity-based entrepreneurship can be expected. In
efficiency-driven economies and especially in innovationdriven economies, entrepreneurial intentions are typically
lower as is show on Figure 2.1. Russia and Japan exhibit the
lowest entrepreneurial intention rates, while expectations
to start a business are extremely high in some other
African economies such as Malawi, Botswana and Uganda,
but also in Latin American countries such as Colombia and
Chile. For many of these countries, it should be noted that
economic disparities are high and that the entrepreneurial
intentions cover a wide range from substantial amounts
of local, necessity-based self-employment to relatively
scarce high aspiration and internationally oriented
entrepreneurship
NATIONAL ATTITUDES: CAREER CHOICE, STATUS AND
MEDIA ATTENTION
The last three attitude measures assess societal
impressions about entrepreneurship as a career choice and
whether entrepreneurs are afforded high status and receive
positive media attention. These perceptions assess the
visibility and attractiveness of entrepreneurship. Positive
views on these measures can influence the willingness of
individuals to become entrepreneurs, but also the likelihood
that others in society will support their efforts, with
some possibly becoming stakeholders such as investors,
suppliers, customers and advisors.
When asked about their judgment of the degree to which
entrepreneurship is accepted as a good career choice,
individuals around the globe tend to be overwhelmingly
positive, but on average, the percentage of positive
assessments is lower in innovation-driven economies than
in the other two groups (Figure ).1). With the exception
of relative high-income economies like Japan, Singapore,
Finland, Norway, Luxemburg, Switzerland and Ireland and
some other high-growth emergent economies like Malaysia
or Puerto Rico, more than half of the inhabitants believe that
entrepreneurship is considered to be a good career choice.
When we consider the status of successful entrepreneurs,
the average judgment appears to be similar in efficiencydriven economies and innovation-driven economies, while
it is higher in factor-driven economies. Again, African
countries (including both from North Africa and SubSaharan) have the highest rates of high status to successful
entrepreneurs.
Finally about attitudes, media attention for
entrepreneurship is assessed by asking the individuals
whether they believe that there are plenty of reports of new
and growing firms in the news and in other communication
media. Economies from several global regions and covering
all three economic phases score high on this item, including
Brazil, Uganda, Taiwan, Finland and Canada. The lowest
scores are observed for Greece, Hungary, Luxemburg and
Libya, where only around one-third of responses were
affirmative. In general, Europe exhibited low levels on all
attitude measures. Even during the economic crisis, some
countries maintained high economic development, so it is
probable that people found other employment alternatives
attractive, such as working for corporations, government or
other entities, where entrepreneurial activity can also take
place (Bosma \kXc., 2013).
PHASES OF ENTREPRENEURIAL ACTIVITY
As shown in Figure 1.1 earlier in this report, GEM
conceptualizes entrepreneurship as a continuous process
that includes nascent entrepreneurs involved in setting
up a business, entrepreneurs who own and manage a
new business and entrepreneurs who own and manage
an established business. In addition, GEM assesses the
rate and nature of business discontinuations. As a result,
indicators on several phases of the entrepreneurial process
are available. Table 2.3 shows these entrepreneurial activity
prevalence rates per phase of economic development.
Taken together, these prevalence rates form a first glance
of entrepreneurial dynamics for each of the economies.
In the remainder of this section, we elaborate on these
phases of entrepreneurial activity. As usual, most attention
is paid to the central measure of GEM, the Total EarlyStage Entrepreneurial Activity (TEA) rate, which consists
of the percentage of individuals aged 18–64 in an economy
who are in the process of starting or are already running
new businesses. This is the phase that is crucial for most
entrepreneurs. While at the macro level, most dynamism,
future job creation and innovation can be expected
from this group of entrepreneurs. Appendix 1, Table A%2
shows the same information but by phase of economic
development.
29
Latin
America &
:Xi`YY\Xe
Argentina
Improvement-driven
opportunity
(% of TEA)
Necessity-driven
(% of TEA)
9.6
5.5
29.8
47.4
Brazil
5.1
12.6
17.3
15.4
4.7
28.6
57.4
Chile
15.4
9.6
24.3
8.5
7.6
20.1
57.7
Colombia
13.6
10.3
23.7
5.9
5.4
18.1
26.7
Ecuador
25.3
13.6
36
18
8.3
33.6
32.1
7.6
4.9
12.3
5.1
3
31.4
44.2
Jamaica
8
6
13.8
6.3
7.4
40.6
34.2
Mexico
11.9
3.3
14.8
4.2
6.6
6.7
26.3
Panama
15.4
5.2
20.6
3.5
3.4
18.6
39.8
Peru
17.8
5.9
23.4
5.4
4.2
22.5
54.2
Suriname
3.9
1.3
5.1
1.7
0.8
17.8
57.6
Trinidad and
Tobago
11.4
8.5
19.5
11.4
4.1
11.2
76
Uruguay
8.5
5.7
14.1
4.9
3.4
12
36.8
11.9
7.1
18.5
7.7
4.9
22.4
45.4
Algeria
2.2
2.6
4.9
5.4
3.3
21.3
62.3
Iran
6.4
6.1
12.3
10.6
5.7
38
35.8
Israel
5.3
4.8
10
5.9
4.8
17.4
49.2
Libya
6.6
4.7
11.2
3.4
8.1
8.1
60.3
5.1
4.6
9.6
6.4
5.5
21.2
51.9
Angola
8
14.7
22.2
8.5
24.1
26.1
40.3
Botswana
11
10.2
20.9
3.4
17.7
26.3
52
Ghana
8.5
17.7
25.8
25.9
8.3
33.3
44.1
Malawi
10.1
18.8
28.1
12
30.2
43.7
29.4
Nigeria
20
20.7
39.9
17.5
7.9
25.4
52.3
South Africa
6.6
4
10.6
2.9
4.9
30.3
31.5
Uganda
5.6
20
25.2
36.1
20.1
25.1
47.5
Zambia
22.6
18
39.9
16.6
19.8
38.8
37.2
11.5
15.5
26.6
15.4
16.6
31.1
41.8
China
5.2
8.9
14
11
2.7
33.9
35.9
India
5.1
4.9
9.9
10.7
1.5
38.8
35.9
Indonesia
5.7
20.4
25.5
21.2
2.4
25.4
43.7
Average
Asia
Pacific &
South Asia
Discontinuation
of businesses
15.9
Average
SubSaharan
Africa
Established
business ownership
rate
5.6
Average
Middle East &
North Africa
Early-stage
entrepreneurial
activity (TEA)
10.5
Guatemala
30
New business
ownership rate
Economies
Nascent
entrepreneur-ship
rate
Region
Japan
2.2
1.5
3.7
5.7
1.5
25
59.6
Korea
Republic of
2.7
4.2
6.9
9
2.5
36.5
51.1
Malaysia
1.5
5.2
6.6
6
1.5
18.4
64.9
Philippines
12
6.7
18.5
6.6
12.3
43.6
38
Singapore
6.4
4.4
10.7
4.2
3.3
8.4
68.8
Taiwan
3.3
5
8.2
8.3
5
28.7
45.8
Improvement-driven
opportunity
(% of TEA)
Necessity-driven
(% of TEA)
Discontinuation
of businesses
10.4
17.7
28
3.5
18.7
67.8
4
11.5
15.4
16.4
4.2
25.1
62.2
5.1
7.6
12.4
11.6
3.7
27.5
52.2
Belgium
3.1
1.9
4.9
5.9
1.9
29
43.9
Croatia
6.3
2
8.3
3.3
4.5
37.4
29.8
Czech
Republic
4.9
2.7
7.3
5.3
3.4
22.7
60.3
Estonia
8.8
4.5
13.1
5
2.1
14.8
50.1
Finland
2.7
2.7
5.3
6.6
2
17.9
66
France
2.7
1.8
4.6
4.1
1.9
15.7
60.9
Germany
3.1
2
5
5.1
1.5
18.7
55.7
Greece
3.3
2.3
5.5
12.6
5
23.5
35.8
6
3.7
9.7
7.2
2.9
28
38.7
Ireland
5.5
3.8
9.2
7.5
2.5
18
43.8
Italy
2.4
1.1
3.4
3.7
1.9
18.7
18.4
Latvia
8.1
5.3
13.3
8.8
3.5
21.2
52.7
Lithuania
6.1
6.4
12.4
8.3
3.5
23.3
55.2
Luxembourg
6
2.8
8.7
2.4
2.8
5.6
56.6
Netherlands
4.7
4.8
9.3
8.7
2.1
8
67.1
Poland
5.1
4.3
9.3
6.5
4
47.4
32.7
Portugal
4.2
4.2
8.2
7.7
2.8
21.4
50.7
Romania
6.2
4.2
10.1
5.3
4.3
31.6
31.6
Slovakia
6.1
3.6
9.5
5.4
5.5
40.2
40.2
Slovenia
3.6
2.9
6.5
5.7
2.6
24.1
53.4
Spain
3.1
2.2
5.2
8.4
1.9
29.2
33.2
Sweden
5.9
2.5
8.2
6
2.4
9.7
58.4
United
Kingdom
3.6
3.6
7.1
6.6
1.9
16.1
45.2
4.8
3.3
8.0
6.4
2.9
22.7
47.0
Bosnia and
Herzegovina
5.8
4.6
10.3
4.5
6.2
58.9
22
Macedonia
3.4
3.5
6.6
7.3
3.3
61
22.9
Norway
2.9
3.4
6.3
6.2
1.6
4
60.8
3
2.8
5.8
3.4
1.6
35.4
42
Switzerland
4.5
3.7
8.2
10
2.3
7.5
67.2
Average
Russia
North
America
Established
business ownership
rate
7.9
Vietnam
Hungary
Europe –
Non-EU28
Early-stage
entrepreneurial
activity (TEA)
Thailand
Average
European
Union
New business
ownership rate
Economies
Nascent
entrepreneur-ship
rate
Region
Average
3.9
3.6
7.4
6.3
3
33.4
43
Canada
7.8
4.7
12.2
8.4
4.4
15.1
66.9
Puerto Rico
6.6
1.8
8.3
2
1.8
21.5
42.9
United States
9.2
3.7
12.7
7.5
3.8
21.2
57.4
Average
7.8
3.4
11.1
6
3.3
19.3
55.7
31
TOTAL EARLY-STAGE ENTREPRENEURIAL
ACTIVITY
An economy’s Total Early-stage Entrepreneurial Activity
(TEA) rate is defined as the prevalence rate of individuals
in the working age population who are actively involved in
business start-ups, either in the phase in advance of the
birth of the firm (nascent entrepreneurs), or the phase
spanning 42 months after the birth of the firm (ownermanagers of new firms). As such, GEM takes the payment
of any wages for more than three months as the “birth
event” of the firm. Several other definitions for what
constitutes the birth of a firm have been put forward in the
entrepreneurship literature, using different perspectives.
The payment of wages proved to be the best approach
for making international comparisons. Individuals who
are actively committing resources to start a business
(that they expect to own or co-own) but for whom the
business has not yet yielded wages or salaries are labeled
nascent entrepreneurs. The individuals who did pass this
“birth event” but are operational for less than 42 months
are labeled as owner-managers in new firms. The cut-off
point of 42 months has been made on a combination of
theoretical and practical considerations7.
32
Figure 2.2 shows the point estimates of the TEA rates for
each of the 67 economies in 2013 by phase of economic
development. The confidence intervals facilitate in
interpreting differences between economies. They
constitute the range within which the average value of 95
out of 100 replications of the survey would be expected
to lie. Economies with large samples, like Spain or Brazil
(see Appendix 2), exhibit lower confidence intervals.
Thus, where the vertical bars do not overlap, as is the case
comparing Chile and Brazil, the TEA rates are statistically
different adopting 95% certainty, also denoted as
statistically different at the 0.05 level.
From Figure 2.2 it is clear that higher rates of TEA are not
necessarily positively related with economic development.
For example, Sub-Saharan economies and Ecuador exhibit
the highest TEA rates in 2013. Interestingly, Trinidad and
Tobago, recently labeled as an innovation-driven country by
the World Economic Forum, presents many characteristics
of the Caribbean economies including a high rate of
TEA. Indeed, TEA rates should not be linked to economic
development directly. What matters more is the particular
profile and context of entrepreneurship as indicated in
Figure 1.1; the profiles and (institutional) contexts are
discussed in the remainder of this report. Previous GEM
reports have reported TEA rates (in general) to decline
with increasing levels of GDP per capita, up to some point
(see e.g. Kelley et al., 2011). The decline follows the
increasing availability of job opportunities as economies
progress and develop institutions accordingly.8 Chapter 4
analyzes early-stage entrepreneurial activity over time for
some economies.
INDIVIDUAL DRIVERS: MOTIVATIONS TO START
BUSINESSES
Motivations to start businesses differ vastly across the
globe. Individual drivers are traditionally captured within
the GEM framework with a simple contrast between
necessity-driven motives and opportunity-driven motives.
A necessity-driven entrepreneur is one who indicates
in the GEM Adult Population Survey that s/he started
the business because there were no better options for
work, rather than because s/he saw the startup as an
opportunity. For those who did see the startup as an
opportunity (rather than no other options for work),
a further assessment was made on the nature of this
opportunity. Improvement-driven opportunity (IDO)
entrepreneurs are defined as those opportunity-driven
entrepreneurs who sought to either earn more money or
be more independent, as opposed to maintain income. As
=`^li\)%* shows, entrepreneurs in factor-driven
economies tend to have more entrepreneurs by necessity.
With higher economic development levels, necessity
gradually falls off as a motivator, while IDO motives
increase.
Necessity motives can be impacted by economic
conditions. For example, people in early development
stage economies may start businesses because there
is an insufficient supply of jobs and a low level of social
security entitlements, and they are pushed into creating
a source of income. As economies develop, the supply of
jobs generally increases, so fewer people are pushed into
entrepreneurship. Table 2.3 shows for instance that in 2013
many developing economies exhibited more than 40% of
their early-stage entrepreneurs driven by necessity. This is
the case of Jamaica, Malawi, Philippines, Poland, Slovakia
and Bosnia and Herzegovina, while for Scandinavian
economies like Norway and Sweden, or Luxembourg and
Switzerland less than 10% are motivated by necessity.
Chapter 4 shows that the percentage of necessity-driven
early-stage entrepreneurs can also fluctuate considerably
over time, mostly in tandem with unemployment rates.
Improvement-driven opportunity motives may be less
dependent on the economic environment and of more
intrinsic nature, as the individual opts for pursuing an
opportunity that is believed to increase income and/
or independence. One could question whether this
can be stimulated by, for example, greater exposure to
entrepreneurial opportunities in one’s environment. On
average, improvement-driven opportunity motives tend to
be more prevalent among early-stage entrepreneurs as the
economy develops (Figure 2.3), a finding that is consistent
with results in previous years. The GEM 2010 Global Report
(Kelley et al., 2011) highlights a number of factors which
can have a marked impact on the level of improvementdriven opportunity motivation within an economy.
See also Reynolds et al. (2005).
See Bosma et al. (2009) and Acs and Szerb (2011) for a more extensive assessment on the relation between entrepreneurship
and stages of economic development.
7
8
Percentage of
0%
0%
Algeria
India
Libya
Iran
Vietnam
Philippines
Botswana
Angola
Uganda
Ghana
Malawi
Nigeria
Zambia
Suriname
Russia
Malaysia
Macedonia
Croatia
Poland
Slovakia
Hungary
Romania
Bosnia and Herzegovina
South Africa
Guatemala
Lithuania
Estonia
Latvia
Jamaica
China
Uruguay
Mexico
Argentina
Brazil
Thailand
Panama
Peru
Colombia
Chile
Indonesia
Ecuador
Italy
Japan
France
Belgium
Germany
Spain
Finland
Greece
Norway
Slovenia
Korea#I\glYc`Zf]
United Kingdom
Czech Republic
Taiwan
Switzerland
Portugal
Sweden
Puerto Rico
Luxembourg
Ireland
Netherlands
Israel
Singapore
Canada
United States
Trinidad and Tobago
Percentage of adult population (18-64 years)
45%
40%
35%
30%
25%
20%
15%
10%
5%
Factor - driven economies
Factor-Driven
Economies
Efficiency - driven economies
Efficency-Driven
Economies
Innovation-Driven
Economies
Innovation - driven economies
Note: Vertical bars represent 95% confidence intervals for the point estimates of TEA
60%
50%
40%
30%
20%
10%
Necessity-driven
Improvement-driven opportunity
33
ESTABLISHED BUSINESS OWNERSHIP
While early-stage entrepreneurs contribute to dynamism
and innovation in an economy, established businesses and
their owner-managers often provide stable employment
and exploit the knowledge and social capital accumulated
in past experiences. Established businesses are also an
important source of new businesses. Owner-managers
of established businesses may contribute greatly to their
societies even if they are small or even solo entrepreneurs.
As KXYc\)%* shows, there are substantial regional
differences in established business ownership rates,
particularly when compared with TEA rates. TEA rates
tend to be high in emerging economies, but established
business activity is often low. The opposite pattern tends
to dominate the innovation-driven economies. Two factors
may contribute to this result. First, as mentioned previously,
there are more employment alternatives in societies
where industrialization and institutionalization have taken
hold; more people may choose employment over starting
businesses in the more developed economies, accounting
for lower TEA rates. Second, where there are sophisticated
ecosystems for business, people that do start businesses
are more able to sustain them because of more favorable
conditions, such as access to finance, a highly educated
workforce, rule of law and so on.
34
The European economies outside the EU and the MENA
regions have low rates of both TEA and established
business ownership, while Sub-Saharan Africa has high
rates of both. Latin America, however, along with SubSaharan Africa, have far more TEA entrepreneurs – over
twice as many – than established business owners. In Asia
and the European Union, there are almost about equal
numbers in each phase.
The balance between TEA and established business
ownership rates may also be unbalanced. For example, in
Sub-Saharan Africa, Ghana and Uganda, and also Thailand,
have an established business ownership rate higher than
their TEA rate. In many Latin American countries such
as Panama, Peru and Mexico, and also South Africa,
the established business ownership rates are less than
a third of their TEA rate, suggesting that even though
entrepreneurship is popular the activities have limited
sustainability over time. The most extreme case in 2013
concerns Zambia, which has the highest early-stage
entrepreneurship rate across the entire sample, yet has less
than one-tenth this level of established business owners.
This phenomenon could partly reflect the demographic
trend in Sub-Saharan Africa: a growth in the youth
population facing limited opportunities only on the job
market. Hence, high rates of early stage entrepreneurship
should not be translated directly into a high number of
sustainable established firms. The example for Zambia
shows that factors leading to discontinuation of early-stage
entrepreneurship activities need particular attention.
ENTREPRENEURIAL EMPLOYEE ACTIVITY
A major distinction in the entrepreneurship domain
exists between “independent entrepreneurship” and
10
See http://www.oecd.org/cfe/leed/inclusive-entrepreneurship.htm
“entrepreneurship within an existing organization.” Both
fields are large research areas, employing a wide range
of definitions and perspectives. Until 2011 GEM has
focused mainly on various aspects related to independent
entrepreneurship and the start-up phase in particular.
After a pilot was held in 2008, the GEM project has
inquired about one particular facet of entrepreneurship
within existing organizations, namely entrepreneurial
activities of individual employees in 2011 (see Bosma
et al., 2012; 2013). As mentioned in the introduction,
entrepreneurial employee activity (EEA) is increasingly
accepted as a relevant type of entrepreneurship in
the sense that it aims at new venture creation and the
introduction of new products and services. It also shares
many behavioral characteristics with the overall concept
of entrepreneurship, such as taking initiative, pursuit of
opportunities and innovativeness. GEM operationalizes
entrepreneurial employee activity as “employees
developing new activities for their main employer, such as
developing or launching new goods or services, or setting
up a new business unit, a new establishment or subsidiary”
(Bosma et al., 2012). This definition is wider than new
organization creation, but it excludes employee initiatives
that mainly aim at optimizing internal work processes.
Some economies continue to measure EEA rates according
to the prevalence of entrepreneurial employee activity
and according to employees who, in the past three years,
were actively involved in and had a leading role in at least
one of these phases (i.e., “idea development for a new
activity” and/or “preparation and implementation of a new
activity”)9. Figure 2.4 shows the 2013 economies by phase
of economic development which measured the EEA also
in 2013. The rates shown refer to the percentage of the
population (18-64 years old) involved in EEA. Similar to
Figure 2.2, the confidence intervals constitute the range
within which the average value of 95 out of 100 replications
of the survey would be expected to lie.
On average the incidence of entrepreneurial employee
activity in the employed adult population is by either
definition substantially lower than that of total early-stage
entrepreneurial activity as presented in Table 2.2 and
Figure 2.2 of this report. In some, the factor and efficiencydriven economies, entrepreneurial employee activity is
extremely scarce, while early-stage self-employment is
abundant. In some cases, the differences are smaller, but
early-stage entrepreneurial activity is still several times
as prevalent as entrepreneurial employee activity. Only
in the innovation-driven economies, the incidence of
entrepreneurial employee activity in the adult population is
in the same order of magnitude as that of total early-stage
entrepreneurial activity. The GEM project continues to
evaluate the possibility to include of permanently including
the EEA rate in order to have a more accurate picture of the
entrepreneurship phenomenon across economies.
BUSINESS DISCONTINUATIONS
As new businesses emerge, others close. Those individuals
selling or closing their businesses may once again benefit
10%
8%
7%
6%
5%
4%
3%
2%
Factor - driven economies
their societies by re-entering the entrepreneurship process.
Recognizing the importance of this measure, GEM tracks
the number of individuals who have discontinued a
business in the last 12 months. Discontinuance may be
considered along with TEA and established businesses as
a component of entrepreneurial dynamism in an economy.
GEM Survey respondents who had discontinued a business
in the previous 12 months were asked to give the main
reason for doing so. KXYc\)%*shows the prevalence rates
of business discontinuation, and Figure 2.5 summarizes
these reasons by geographic regions.
The rate of business discontinuance generally declines
as economic development increases. Factor-driven
economies have higher levels of entrepreneurship activity,
so it would make sense that this would be accompanied
by more discontinuance. However, when the TEA rate is
taken into account, there is still a higher discontinuance
rate per entrepreneur in the factor-driven economies. In
Sub-Saharan Africa, which shows the highest regional TEA
rates, there are high rates of discontinuance relative to
TEA. 8e^fcX and DXcXn` have a higher business
discontinuation rate than TEA. However, in some
developed economies that have had economic crises like
Spain and Greece, the business discontinuation rate is
higher than TEA too.
There are a number of reasons for discontinuing a
business; the most prevalent among all geographic regions
Efficiency - driven economies
United Kingdom
Slovenia
Finland
Puerto Rico
Korea#
I\glYc`Zf]
Lithuania
Uruguay
Romania
Slovakia
Poland
Hungary
Bosnia and
Herzegovina
Chile
Ecuador
Thailand
Peru
South Africa
China
Malaysia
Vietnam
Iran
Botswana
Algeria
0%
Nigeria
1%
Philippines
Percentage of adult population (18-64 years)
9%
Innovation - driven economies
relate to the business not being profitable and problems
obtaining financing. Compared to other regions, problems
with financing were less an issue in North America. Not
surprisingly, it was identified as the key issue in business
stops in Sub-Saharan Africa. In Europe and North America,
individuals cited other jobs or business opportunities as
a reason for business discontinuance more often than
those in other regions – it makes clear that not all business
discontinuances by individuals are caused by ‘negative’
factors, some are actually quite positive.
DEMOGRAPHICS AND EARLY-STAGE
ENTREPRENEURIAL ACTIVITY
YOUTH AND SENIOR ENTREPRENEURSHIP
A society can benefit from entrepreneurs of all ages. For
example, young people are relatively likely to have fresh
ideas, to be “born-digitals” and in some societies to have
received more education than their parents. They are less
likely to have responsibilities like mortgages and families,
factors that generally make individuals more cautious
and risk-averse. Older people may be less open to new
experiences and change but they can capitalize on relevant
experience, contacts and financial resources built over long
careers. Moreover, the 50+ age group in many economies
is now also familiar with information and communication
technologies, making home-based start-ups an interesting
option for this group. While entrepreneurship is often more
35
prevalent in the age groups in between, policymakers might
look to harness the entrepreneurial potential on either
side of these seemingly more likely prospects. GEM also is
putting emphasis on young entrepreneurs by publishing a
special report on this topic (Kew et al., 2013). In addition,
the OECD is publishing a series of reports and seminars
related to ‘inclusive entrepreneurs’, partly using GEM
data10.
Figure 2.6 shows that the distribution of early-stage entrepreneurship is roughly similar for all regions, with highest
prevalence rates in the 25-34 and 35-44 age groups. Again,
some differences between economies should be noted. For
example, younger early-stage entrepreneurs (18-24 year
olds) were often observed in EU and North America. The
oldest ages (55-64) are observed in Sub-Saharan Africa.
100%
90%
80%
70%
60%
50%
36
40%
Retirement
30%
Exit was planned in advance
Opportunity to sell
20%
An incident
Another job or business opportunity
Personal reasons
10%
Problems getting finance
Business not profitable
0%
Sub-Saharan
Africa
Middle East &
North Africa
Latin America &
:Xi`YY\Xe
Asia Pacific & Europe – EU28
South Asia
WOMEN AND ENTREPRENEURSHIP
GEM has consistently shown that women’s involvement
in early-stage entrepreneurship varies greatly across the
globe. These differences reflect distinctions in culture and
customs regarding women’s participation in the economy,
for example, societal views about women’s role in the
labor force and in business more specifically. Women
enter entrepreneurship for many of the same reasons as
men, such as to support themselves and their families, to
enrich their lives with careers as well as to attain financial
independence. Yet aside from different participation
rates, women show marked differences from men in many
characteristics, as the most recent GEM women’s report
shows (Kelley et al., 2013). Individual results by economy,
including the proportion of necessity and opportunitydriven entrepreneurs by gender, can be found in
8gg\e[`o(# Table 8%3.
10
See http://www.oecd.org/cfe/leed/inclusive-entrepreneurship.htm
Europe – Non
EU28
North
America
As can be seen in Figure 2.7, Sub-Saharan African rates
of female early-stage entrepreneurship are comparable
to their male equivalents. Notable cases are Ghana,
Nigeria and Zambia which exhibit more participation of
women than men. Other economies like Brazil, Indonesia,
Philippines, Thailand, Russia and Switzerland that come
from various global regions and represent every phase of
economic development, also have a similar proportion
of women and men entrepreneurs. In the remaining
economies participating in the GEM 2013 assessment,
entrepreneurship rates are lower among women relative
to men. The lowest relative rates of involvement in
entrepreneurship by women can be found in several MENA
economies and some European economies, where less than
50% of the early-stage entrepreneurs are women.
Percentage of adult population (18-64 years)
30%
18 - 24 years
25 - 35 years
35 - 44 years
25%
45 - 54 years
55 - 64 years
20%
15%
10%
5%
37
0
Latin America &
:Xi`YY\Xe
Middle East & North
8frica
Asia Pacific &
Sub-Saharan Africa
South Asia
An analysis of opportunity and necessity motives shows
that men in Latin America and Sub-Saharan Africa are
more likely opportunity-motivated, while women have
higher necessity motives. Even though these regions show
limited differences in TEA rates by gender, relatively more
women are driven by necessity. In contrast, women in
the MENA region are proportionately more likely to be
opportunity-motivated. Together with the observed low
TEA rates among women in this region, it suggests that
entrepreneurial activity may be a difficult challenge for
women with limited resources and access to the labor
market.
To get an idea about the economic impact of entrepreneurs
across the globe, GEM measures the job (growth)
expectation, innovation and internationalization profiles
of entrepreneurs. These forms of entrepreneurial
aspirations have been positively associated with economic
development (see e.g. Wong et al., 2005; Wennekers et al.,
2010; Bosma, 2011). In this section, these impact profiles
are assessed for early-stage entrepreneurs.
Europe – EU28
Europe –
Non EU28
North America
GROWTH ORIENTATION
Growth aspirations constitute a key dimension of the
impact profiles by early-stage entrepreneurs. It is the
clearest manifestation of entrepreneurship that can
directly be linked to the number one objective of most
governments: to create more jobs. The typical GEM-based
measures in the domain of growth aspirations deal with
job (growth) expectations. By tracking growth perceptions,
GEM enhances the TEA measure of the prevalence of
entrepreneurship with an indication of the differential
impact entrepreneurs can have on their economies. Second,
growth expectations relate to job creation potential, which
is an important policy concern for nearly every government,
particularly in the aftermath of the global financial crisis
and the accompanying upswing in unemployment rates.
GEM asks early-stage entrepreneurs how many employees
(other than the owners) they currently have and expect
to have in the next five years. This measure relates to
the entrepreneurs’ expectations about the potential for
their businesses, but in most cases this is also reflecting
their ambitions to grow their ventures. Stated differently,
entrepreneurs may either have solid reasons to believe
that their business has high growth potential or they
Percentage of Adult Population (18-64 years)
30%
38
25%
20%
15%
10%
Male (%TEA)
5%
Female (%TEA)
0%
Latin America
& :Xi`YY\Xe
Middle East &
North Africa
Sub- Saharan
Africa
Asia Pacific &
South Asia
simply endeavor to pursue growth. It should therefore
be acknowledged that early-stage entrepreneurs may be
optimistic in their expectations and that expectations for
job creation certainly does not always lead to realizations.
At the same time, it is also well established that growth
realization is seldom achieved without having expectations
or ambitions for growth (Stam et al., 2012). Thus, building
on these findings, country variations in the degree of (high)
job expectations can be assumed to approximate variations
in realized job creation.
European
Union
Non-European
Union
North
America
expectation composition” of TEA rates is important, given
that there are a high number of entrepreneurs in Africa,
and illustrating that a simple count of entrepreneurs does
not tell the whole story. In other words, Sub-Saharan
African entrepreneurs create a lot of employment based on
entrepreneurial new businesses, but the owner-managers
of these enterprises have, provided even that they can
get the business started and sustained, little prospect for
growth.
Figure 2.8 shows job expectations as a percentage of
TEA for each geographic region. Results for individual
economies can be found in Appendix 1, KXYc\8%+. Three
levels of growth are shown here: the proportion of
entrepreneurs projecting low (0–5 new employees in five
years), medium (6–19 new employees), or high (20+ new
employees) growth in their businesses.
In contrast, the EU and North American economies, despite
their relative low TEA rates, have more than 10% of the
entrepreneurs projecting growth of 20 or more employees.
With relatively few individuals having low growth
projections entering entrepreneurship, perhaps there
are conditions or attitudes that make this activity more
worthwhile when there is growth potential or ambition – or
less worthwhile if one will not, or cannot, pursue growth.
The results show that Sub-Saharan Africa generally exhibits
limited growth aspirations, with more than 80% of the
entrepreneurs indicating they expect to add less than
five employees within the next five years and only 4%
projecting 20 or more new jobs. Analyzing the “growth
INNOVATIVE ORIENTATION
While job growth expectations and realizations arguably
constitute the most visible medium-term impact of
entrepreneurship, innovative orientation impacts structural
renewal in the long term. Innovation is viewed from
100%
90%
80%
Percentage of TEA
70%
60%
50%
40%
30%
Job expectations1 20
or more job
Job expectations1 5 - 19 jobs
20%
Job expectations1 0 -5 jobs
10%
0
Latin America
& Caribbean
Middle East &
North Africa
Sub-Saharan
Africa
Asia Pacific &
South Asia
the perspective of the market and industry, in line with
Schumpeter’s view of innovative entrepreneurship as
new product-market combinations destructing older,
obsolete products and services and pushing the production
frontier forwards (Schumpeter, 1942). It represents the
perceived extent to which an entrepreneur’s product or
service is new to some or all customers and where few
or no other businesses offer the same product. When
comparing economies, it must be kept in mind that what
may seem new to customers in one economy may already
be familiar to customers in another. Nevertheless, a high
degree of innovative orientation in the former economy
is still expected to have a positive impact on economic
development. Innovative orientation as measured in the
GEM framework is therefore a context-dependent measure.
Figure 2.9 shows the percentage of early-stage
entrepreneurs with innovative orientations. We use two
measures: the percentage of TEA that declare they have a
product or service that is a novelty (new) for all or some or
their consumers, and the percentage of TEA that declare
they are new in the market with few or no other businesses
that offer the same product or service. The average level of
innovation in each regional group increases with the level
Europe
– EU28
Europe – Non
EU28
North
America
of economic development. North America and European
Union exhibit the largest proportion in both indicators.
Asia Pacific and South Asia, with economies that are now
characterized for their high degree of innovative products
like Japan, Korea or China, show the largest proportion
of new products. In contrast, Sub-Saharan economies
exhibit lower proportions of new product with European
economies. Outside the EU. Interestingly, growing
emergent economies like Colombia, Chile, Taiwan and
South Africa have high rates of new products (over 70%)
but also high proportions in new markets (over 50%).
39
60%
Percentage of TEA
50%
40%
30%
% TEA: product is new
to all or some customers
20%
% TEA: new market
(few/no businesses offer the
same product)
10%
0%
40
Latin America
& :Xi`YY\Xe
Middle East &
North Africa
Sub- Saharan
Africa
Asia Pacific &
South Asia
Europe – EU28
INTERNATIONAL ORIENTATION
In an ever more global economy, countries’ global trade
becomes increasingly important. Not only multinational
enterprises have international orientations; new and
smaller firms are – by using the latest technologies –
increasingly well equipped to broaden the scope of their
business. It is obvious that entrepreneurs in economies
with small internal markets place even more emphasis on
this than economies with large internal markets such as
Brazil, China, Russia, India and the United States. A specific
GEM measure assesses the extent to which entrepreneurs
sell to customers outside their economies. =`^li\)%('
shows four categories of early-stage entrepreneurs related
to the degree of internationalization, from 0% of their
customers living outside the origin country, to high degrees
of internationalization with 75-100% of the customers
living outside the country. As was expected, EU economies,
with a large tradition of international commerce and
their geographic proximity, exhibit a high proportion of
entrepreneurs with at least 25% of their customers living
outside of the country. In contrast, Latin American and
Sub-Saharan economies show a lower proportion of high
international oriented entrepreneurs.
Three key observations related to groups that stand
out on either end of the internationalization spectrum,
as identified earlier in e.g. Kelley et al. (2012) remain
paramount. First, there is a group of economies with large
Europe – Non
EU28
North
America
populations and large land mass showing very low rates
of internationalization of early-stage entrepreneurial
activity: China, India, Indonesia, Thailand, Brazil, Mexico
and Russia. Second, the largest market in the world, United
States, exhibits medium internationalization rates, although
still higher than the large efficiency-driven economies.
Entrepreneurs in the U.S. have a large and diverse market
with relatively high disposable income, but also high
competitive intensity. Third, there are economies that stand
out for their high levels of international trade by earlystage entrepreneurs. One of the characteristics is that they
have a relatively small local market but they face a high
innovative orientation in services and some tech products.
This is the case for Singapore, Luxemburg and Israel.
Also, some economies from the EU like Croatia, Ireland
and Slovenia face high levels of international orientation,
because they are relatively small economies with a great
need to participate in, and have a history of, international
trade.
100%
90%
80%
Percentage of TEA
70%
60%
50%
40%
30%
20%
41
10%
0%
Latin America &
:Xi`YY\Xe
TEA: Export:
75 - 100% of customers
outside country
Middle East &
North Africa
Sub-Saharan
Africa
TEA: Export:
25 - 75% of customers
outside country
Asia Pacific &
South Asia
TEA: Export:
1 - 25% of customers
outside country
Europe – EU28
TEA:
No customers
outside country
Europe – Non
EU28
North
America
Kim Klyver, Suna Løwe Nielsen and Majbritt Rostgaard
Evald. “Women’s self-employment: An act of institutional
(dis)integration? A multilevel, cross-country study.”
Journal of Business Venturing, Volume 28, Issue 4, pages
474–488, July 2013.
42
RESEARCH ISSUE
Intuitively, a nation’s gender equality policies, aimed at
constructing and maintaining an environment that is both
accommodating and supportive of women, are expected to
have a positive impact on women’s participation in selfemployment (Bruton et al., 2010). Paradoxically, anecdotal
evidence in women’s entrepreneurship literature shows
that in economies considering themselves highly egalitarian
at an institutional level, only women’s employment is
integrated, whereas women’s self-employment seems to
involve acts of institutional disintegration (Nielsen et al.,
2010). Seemingly, national-level institutions for gender
equality unintentionally lead to lower participation in
self-employment among women than among men. The
gender equality policies in these economies focus solely on
women’s employment rights in the labor market, resulting
in a preferential situation whereby women’s employment
options are favored over their self-employment options.
However, as this evidence is mainly anecdotal and
originates primarily from the Nordic economies with
distinctive welfare regimes and gender equality discourses,
Klyver, Nielsen and Evald set out to test this proposition
beyond the context of the Nordic economies. They further
investigate whether this disparity is contingent upon a
country’s development stage and industries.
THEORY AND METHOD
Klyver, Nielsen and Evald take an institutional reading
of Mead’s (1934) symbolic interactionism to argue that
women’s employment choices emerge from dynamic
interactions between individual, social and institutional
forces. Symbolic interactionism is a social-psychological
theory of the self, which is constructed from closely
interrelated conversations between the “I” and the
“Me.” The “I” signifies the creative destructive part
of the individual, which provides the woman with the
opportunity to raise her self-employment choice “...
above the institutionalized individual” (Mead, 1934:
p. 211), whereas the “Me” represents the external and
socially directed part of the individual, which takes the
social gendered institutional discourses of reality into
consideration. The authors argue that self-employment is
an act of disintegration in cases where individuals do not
follow the “Me” and integrate their conduct accordingly
to the institutional discourse, but in fact break with that
discourse. Based on observations that women might be
more fettered by the “Me” compared to men, the authors
argue that women are more likely socialized away from
self-employment compared to men. Finally, the impact
of national-level gender equality on women’s selfemployment choice compared to that of men is stronger
in developed economies and male-oriented industries. An
extensive merged GEM-based dataset is used covering
561,164 individuals across 61 economies to test our three
hypotheses.
FINDINGS AND CONTRIBUTIONS
The national-level gender equality negatively impacts
women’s self-employment choice compared to that of
men, and this negative impact is stronger in developing
economies and male-oriented industries. The authors
foremost contribute to the women’s entrepreneurship
literature by expanding the research object from an
individualistic focus, searching for individual and sociodemographic factors that might influence women’s
self-employment towards accounting for interactive
factors outside the individuals. Secondly, the authors
attempt to shift the epistemological position in the
women’s entrepreneurship literature from an objectivist
epistemology towards a constructionist epistemology
by placing women and men within wider and multiple
gendered institutional discourses, allowing both sexes to
interpret and react differently thereto. This leads to the
third contribution to institutional theory’s central ideas
of embedded agency. Institutional theory calls for further
insight into the micro foundation of embedded agency.
The authors advance previous discussions on embedded
agency by introducing the interplay between the “I” and
“Me” as a way to link individual, social and institutional
processes.
IMPLICATIONS
The research takes important steps forward in building
and testing a symbolic interactionism institutional
perspective on women’s self-employment choice. The
strength of our research is that it is highly generalizable
across various institutional contexts. More detailed and
deep knowledge is needed on the psychological and
sociological consequences of integrative and disintegrative
self-employment choices of women. A likely consequence
might be that as long as self-employment is an act of
disintegration, women may disguise their entrepreneurial
self from their surroundings in order to remain accepted
by the institutional environment and miss out on
essential networks and resources. This again may be a
decisive explanatory factor to understand women’s low
performance compared to men’s.
43
Since its inception, the GEM project has proposed that
entrepreneurial activity is shaped by a distinct set of factors
called Entrepreneurial Framework Conditions (EFCs). These
EFCs are “the necessary oxygen of resources, incentives,
markets and supporting institutions to the growth of new
firms” (Bosma et al., 2008# p. 40). Hence, it is expected
that different countries and regions have different EFCs
or different “rules of the game,”11 and that these affect the
inputs and outputs of entrepreneurial activity. The original and revised GEM conceptual frameworks established
a clear relationship between the EFCs, entrepreneurship
dynamics and economic growth (see Figure 3.1). In the
1999 Executive Report, Paul D. Reynolds, Michael Hay and
S. Michael Camp stated: “The model captures a number
of things ignored in the conventional framework. First is
the recognition that entrepreneurial activity is shaped by
a distinct set of factors (referred to as Entrepreneurial
Framework Conditions). Such factors include training in
entrepreneurship and the availability of start-up financing”
(p. 10).
Entrepreneurial
Opportunities
44
Social, Cultural,
Political, context
Entrepreneurial
Framework Conditions
Business
Dynamics
National Economic
Growth (GDP, Jobs)
Entrepreneurial Capacity
and Preferences
Source: Reynolds, Hay and Camp (1999)
The EFCs can be considered an indispensable part of
the puzzle in understanding business creation. The state
of these conditions directly influences the existence of
entrepreneurial opportunities and entrepreneurial capacity
and preferences, which in turn determines business
dynamics. That is why, since the beginning, the GEM
project needed a source of information to assess the state
of EFCs. This source of information is the National Experts
Survey.
The National Experts Survey (NES) is part of the standard
GEM methodology and it assesses various EFCs as well
as other topics related to entrepreneurship. The NES was
initiated due to a lack of nationally harmonized measures
that could be utilized as indices of specific EFCs (Reynolds
et al., 2005). While more recently other sources provide
alternative measures for some EFCs(), the NES remains the
sole source of harmonized, internationally comparable
data that really addresses the environment for new and
growing firms.
The NES was carefully designed and refined to capture
informed judgments of national, and in some cases
regional, key informants regarding the status of EFCs
in their own economies and/or regions. National and
regional experts are selected on the basis of reputation and
experience (a convenience sample approach). The NES
11
These EFCs could be related to Baumol´s concept of “rules of the game” that determine to what extent entrepreneurial activity in a given society is
productive (Baumol, 1990).
12
For NES results and linkage of EFCs with other international measurements, see Bosma et al. (2008).
is similar to other surveys that capture expert judgments
to evaluate specific national conditions. For example,
the WEF´s GCI uses similar surveys to construct its
indices (Sala-i-Martin et al., 2010). In this case, the main
methodological difference between the GCI and the NES
is that the latter focuses only on EFCs, rather than
general economic factors(*.
NES METHODOLOGY
The NES questionnaire obtains the views of experts on a
wide range of items, each of which was designed to capture
a different dimension of a specific EFC14. Each year at least
36 experts15 are personally interviewed or surveyed in each
GEM economy and asked to complete the NES self-administered questionnaire16. Table 3.1 summarizes the main
nine EFCs who are the core of the questionnaire. Experts
also give valuations on other topics related to additional
entrepreneurship conditions fore example women entrepreneurship support, high growth business encouragement and
questions related to the special topic included in current
GEM cycle.
1.
Entrepreneurial Finance. The availability of financial resources-equity and debt-for small and medium
enterprises (SMEs) (including grants and subsidies).
2.
Government Policy. The extent to which public policies give support to entrepreneurship. This EFC has two
components:
2a. Entrepreneurship as a relevant economic issue and
2b. Taxes or regulations are either size-neutral or encourage new and SMEs.
3.
Government Entrepreneurship Programs. The presence and quality of programs directly assisting SMEs at all
levels of government (national, regional, municipal).
4.
Entrepreneurship Education. The extent to which training in creating or managing SMEs is incorporated within the education and training system at all levels. This EFC has two components:
4a. Entrepreneurship Education at basic school (primary and secondary)m and
4b. Entrepreneurship Education at post-secondary levels (higher education such as vocational, college,
business schools, etc.).
5.
R&D Transfer. The extent to which national research and development will lead to new commercial
opportunities and is available to SMEs.
6.
Commercial and Legal Infrastructure. The presence of property rights, commercial, accounting and other legal
and assessment services and institutions that support or promote SMEs.
7.
Entry Regulation. Contains two components:
7a. Market Dynamics: the level of change in markets from year to year, and
7b. Market Openness: the extent to which new firms are free to enter existing markets.
8.
Physical Infrastructure. Ease of access to physical resources-communication, utilities, transportation, land or
space—at a price that does not discriminate against SMEs.
9.
Cultural and Social Norms. The extent to which social and cultural norms encourage or allow actions leading
to new business methods or activities that can potentially increase personal wealth and income.
13
As the first GEM theoretical model stated, the general national conditions influence the entrepreneurial conditions, so there is room to argue that these
two sources of information are related but not exactly the same.
14
When all data are collected, the national and regional files are harmonized centrally. The harmonization process includes an internal quality control
and the calculation of composite variables that summarize each of the blocks of questions designed to measure a certain aspect of the EFCs. Due
to this methodology, individual values are assigned to each expert in each country, so that international comparisons can be made. To illustrate the
way each EFC is created, the first condition, “finance for entrepreneurs,” is constructed by a block of six items that includes information on access to
different sources of finance, including equity, government funding, debt, business angels and IPOs. The same logic is applied to the rest of the EFCs.
The responses of the items follow a five-point Likert scale, where 1 means the statement is completely false according to the expert and 5 means
the statement is completely true. Experts are also asked to their view about the most important institutional successes and constraints for fostering
entrepreneurship in their country in their view. They also provide some key recommendations for fostering entrepreneurship in their country. Finally,
some background information on the experts is recorded. NES questionnaires are copyrighted; they are available at the GEM Web site:
www.gemconsortium.org
15
These experts are selected following a strict protocol: National and/or Regional GEM Teams are instructed to select at least four experts considered
particularly knowledgeable in each of the general EFCs (9 EFCs x 4 experts = 36 respondents)-at least one entrepreneur, at least two “suppliers” of the
EFC (for example, policymakers involved in shaping the EFCs) and at least one observer, such as an academic with specific expertise in the area. The
typical rotation is around 25% of new experts each year.
16
Since 2010, a standardized online survey is available in English and Spanish using the web-based survey tool, Qualtrics®. Some National Teams also
implement their own systems in their languages.
45
Table 3.2 provides a general overview of the results of each EFC for the 69 economies(. participating in the NES in 2013,
by geographic regions adopted in this report. The table shows the main rates for each economy and all EFCs.
REGION
1
2a
2b
3
4a
4b
5
6
7a
7b
8
9
LATINAMERICA &
CARIBBEAN
46
Argentina
2.2
2.0
1.5
2.8
2.2
3.3
2.7
3.0
3.2
2.6
3.5
3.2
Barbados
2.0
2.8
2.0
2.3
2.0
2.7
1.6
3.0
2.5
2.4
3.4
2.5
Brazil
2.3
2.5
1.7
2.3
1.5
2.4
2.0
2.4
3.0
2.1
3.0
2.7
Chile
2.5
3.4
3.2
3.1
1.7
2.7
2.2
2.7
2.4
2.3
4.2
2.8
Colombia
2.3
2.8
2.6
3.0
2.3
3.2
2.4
2.8
2.9
2.8
3.3
3.1
Ecuador
2.2
2.9
2.1
2.5
2.0
3.2
2.1
2.9
2.3
2.4
4.2
3.1
Guatemala
2,2
2.2
2.1
2.4
1.8
3.2
2.2
3.4
2.4
2.4
3.8
2.6
Jamaica
2.9
2.6
2.2
2.3
2.2
3.5
2.3
3.2
3.8
2.7
3.8
3.5
Mexico
2.4
3.0
2.2
3.1
2.0
3.3
2.6
2.7
2.5
2.4
3.9
3.1
Panama
2.4
2.7
2.8
3.1
1.6
2.8
2.3
2.8
2.8
2.4
3.8
3.0
Peru
2.3
2.0
2.1
2.2
2.1
2.8
1.9
2.7
2.6
2.6
3.4
2.9
Suriname
2.4
2.4
2.2
2.0
2.1
3.3
1.8
2.8
2.7
2.2
3.3
2.8
Trinidad and Tobago
3.1
2.2
2.2
2.4
2.1
3.0
2.0
3.1
2.8
2.0
3.8
3.0
Uruguay
2.2
2.3
2.8
3.2
1.7
3.5
3.0
3.1
2.0
2.8
3.8
2.4
2.4
2.6
2.3
2.6
2.0
3.1
2.2
2.9
2.7
2.4
3.7
2.9
Algeria
3.4
3.2
2.6
2.7
2.4
3.2
2.9
2.9
4.0
3.0
3.5
3.2
Iran
2.0
1.9
1.6
1.5
1.5
2.1
1.9
2.1
3.2
1.8
4.1
2.2
Israel
2.8
2.0
1.7
2.2
2.0
3.0
2.3
3.3
2.7
2.2
4.1
3.8
Average
Middle Est & North Africa
2.1
2.0
2.6
1.7
1.4
2.3
1.8
2.9
3.2
2.8
3.0
2.5
2.6
2.3
2.1
2.1
1.8
2.7
2.2
2.8
3.3
2.4
3.6
2.9
Angola
2.6
2.9
2.2
2.2
1.6
2.1
1.8
2.5
3.1
2.0
2.3
2.8
Botswana
2.7
2.6
2.7
2.6
2.3
3.1
2.1
2.7
3.1
2.8
3.3
2.8
Ghana
2.6
2.7
2.2
2.3
2.1
2.9
2.1
3.0
3.1
3.0
3.0
3.1
Malawi
1.9
2.3
1.9
2.0
2.2
2.9
1.9
2.8
3.4
2.7
2.8
2.4
Libya
Average
Sub-Saharan Africa
Namibia
2.6
3.0
2.1
2.4
2.8
3.1
2.0
2.8
3.0
2.6
3.5
3.2
Nigeria
2.1
2.0
1.8
2.2
2.1
2.8
1.7
2.6
3.3
2.3
3.0
3.3
South Africa
3.3
2.9
2.1
2.2
1.8
2.3
2.1
2.7
2.8
3.1
2.8
3.0
Uganda
2.5
2.3
2.0
2.4
2.2
3.1
2.1
3.3
3.8
2.7
3.4
3.1
Zambia
1.9
2.1
2.3
2.1
2.1
2.5
1.7
2.6
3.1
2.7
2.9
2.6
2.5
2.5
2.2
2.3
2.1
2.7
2.0
2.8
3.2
2.7
3.0
2.9
China
2.5
2.7
2.6
2.6
1.6
2.7
2.5
2.6
3.9
2.6
4.0
3.0
India
2.8
1.9
1.8
2.1
1.5
2.4
1.9
3.0
3.5
2.5
3.7
2.7
Indonesia
3.1
2.7
2.2
2.5
2.5
3.3
2.3
3.2
3.9
2.8
3.5
3.3
Korea, Republic of
2.3
3.4
2,7
3.0
2.1
2.5
2.5
2.3
4.1
2.3
4.0
3,1
Malaysia
3.4
3.1
2,5
3.0
2.3
3.0
2.9
3.2
3.4
2.7
4.1
3.1
Average
Asia pacific & South Asia
As we explained in Chapter 2, some economies did not fully comply with the requirements for the Adult Population Survey but complete the NES data.
This was the case for Barbados, Namibia and Turkey. Japan did not conduct the NES survey in 2013.
17
1
REGION
2a
Philippines
3.2
2b
3.0
3
2,3
4a
3.1
4b
5
3.1
3.4
2.5
6
7a
3.4
3.8
7b
8
9
2.9
3.7
3.5
Singapore
3.5
3.7
4.1
3.7
2.8
3.2
3.2
3.5
3.5
3.4
4.5
3.2
Taiwan
3.7
2.7
2.8
2.3
2.0
2.7
2.5
3.4
3.0
2.8
3.0
3.6
Thailand
3.0
2.5
2.4
2.4
2.3
3.1
2.5
3.4
3.7
2.8
4.1
3.0
Vietnam
2.4
2.9
2.8
2.5
2.0
2.6
2.5
2.9
3.5
2.7
3.6
3.1
3.0
2.8
2.6
2.7
2.2
2.9
2.6
3.1
3.6
2.7
3.8
3.2
Average
Europe – Non EU28
Bosnia and Herzegovina
2.2
2.0
1.8
2.0
2.0
2.6
1.9
2.7
3.4
2.0
3.3
2.2
Macedonia
2.3
2.6
2.9
2.5
2.3
3.0
2.4
3.0
3.0
2.4
3.5
2.8
Norway
2.8
2.4
2.8
3.0
2.6
2.6
2.9
3.6
2.9
2.6
4.1
2.8
Russia
2.0
1.9
1.9
1.8
2.2
2.7
2.1
3.1
3.2
2.1
3.1
2.5
Switzerland
3.0
3.4
3.7
3.5
2.4
3.4
3.5
3.6
2.7
3.2
4.7
3.3
Romania
2.3
2.4
2.0
2.4
2.3
2.9
2.6
3.0
3.3
2.7
2.9
2.3
Turkey
2.7
2.9
2.7
2.7
2.3
2.9
2.5
3.1
3.2
2.7
3.8
3.2
2.5
2.5
2.5
2.6
2.3
2.9
2.5
3.1
3.1
2.5
3.6
2.7
Belgium
2.6
2.6
2.2
3.3
2.0
3.1
2.6
3.3
2.8
2.7
3.7
2.2
Average
Europe – EU28
Croatia
2.3
2.2
1.8
2.5
1.9
2.6
2.1
2.7
3.6
2.1
3.5
2.0
Czech Rep
2.5
2.0
2.0
2.3
1.6
2.4
2.2
3.1
2.6
2.6
4.0
2.0
Estonia
2.7
2.5
3.1
3.3
2.3
3.0
2.9
3.0
3.6
2.5
4.3
3.5
Finland
2.8
3.3
3.1
2.9
2.7
2.9
3.0
3.5
2.8
2.9
4.3
2.9
France
2.9
3.3
3.0
3.2
1.7
2.7
2.5
3.0
3.2
2.4
4.2
2.2
Germany
2.8
2.6
2.6
3.4
1.9
2.6
2.8
3.3
3.2
2,8
3.7
2.8
Greece
2.0
2.1
1.8
2.0
1.7
2.6
2.2
3.2
3.2
2.2
3.6
2.3
Hungary
2.8
2.3
1.9
2.3
1.9
2.8
2.5
3.4
3.1
2.7
3.9
2.6
Ireland
2.6
2.9
2.8
3.2
2.0
2.8
2.9
3.4
2.7
2.9
3.9
3.0
Italy
2.5
2.0
1.5
2.1
1.7
2.6
2.5
3.1
3.5
2.5
3.3
2.1
Latvia
2.9
2.9
3.0
3.0
2.7
3.3
2.4
3.4
2.6
3.0
4.1
3.1
Lithuania
2.8
2.4
2.0
2.6
2.4
2.8
2.4
3.5
4.0
2.5
4.2
3.0
Luxembourg
2.6
3.4
3.4
3.6
2.2
2.9
2.8
3.3
3.0
2.9
3.9
2.4
Neteherlands
2.8
3.0
3.2
3.0
3.1
3.3
2.8
3.8
2.9
3.3
4.6
3.1
Poland
2.7
2.6
2.1
2.7
1.8
2.4
2.1
3.0
3.8
2.8
3.6
2,8
Portugal
2.9
2.6
1.8
2.9
2.2
2.9
2.7
3.4
2.4
2.5
4.4
2.6
Slovakia
2.2
1.9
1.9
2.2
1.9
2.8
1.9
2.8
3.0
2.5
3.9
1.9
Slovenia
2.2
1.9
2.1
2.5
2.1
2.8
2.4
2.8
3.1
2.4
3.9
2.2
Spain
1.8
2.3
2.0
3.1
1.4
2.3
2.2
2.5
2.1
2.3
3.9
2.1
Sweden
2.3
2.7
2.5
2.7
2.3
2.4
2.4
3.0
3.4
2.6
4.2
3.2
2.7
3.0
2.6
2.7
2.2
2.6
2.5
3.1
2.8
2.7
3.9
3.1
2.6
2.6
2.4
2.8
2.1
2.8
2.5
3.2
3.1
2.6
4.0
2.6
Canada
2.6
2.9
2.3
2.8
2.2
2.7
2.5
3.1
3.0
2.6
3.9
3.2
Puerto Rico
1.9
2.3
1.5
2.5
1.6
3.0
2.1
2.9
3.0
2.2
3.4
2.5
2.6
2.8
2.2
2.6
2.2
3.1
2.4
3.2
3.2
2.9
4.2
3.9
2.4
2.7
2.0
2.6
2.0
2.9
2.3
3.1
3.1
2.6
3.8
3.2
United Kingdom
Average
North America
United States
Average
1 Finance
2a Nat. Policy – General Policy
2b Nat. Policy – Regulation
3 Government Programs
4a Education – Prim. & Second.
4b Education – Post-School
5 R&D Transfer
6 Commercial Infrastructure
7a Internal Market – Dynamics
7b Internal Market – Openness
8 Physical Infrastructure
9 Cultural and Social Norms
47
Finance
0.30
0.10
Education - Post-School
National Policy - General Policy
-0.10
-0.30
-0.50
Education - Primary and
Secondary
48
National Policy - Regulation
Government Programs
Factor-Driven Economies
Efficiency - Driven Economies
Table 3.2 also shows the highest rated EFCs in each country
in green and the lowest rated EFCs in red. Even though clear
patterns among country-groups are not easy to discern,
the averages presented in the table reflect, for example,
that education of entrepreneurship at basic levels (primary
and secondary school) is judged rather unfavorably in the
majority of the economies. Only The Netherlands has a
score above 3 (confirming the pattern that emerged last
year). In contrast, physical infrastructure tends to have the
highest evaluations in experts’ judgments with averages
over 4, for example in the EU. Hence it does not seem to be
a big constraint in most economies across the globe. Only
Sub-Saharan economies have lower evaluation in physical
infrastructure to support entrepreneurship.
In general, experts in more economically developed countries
(EU and North America) gave higher ratings to the EFCs. In
contrast, Sub-Saharan African countries gave, on average,
low evaluations mainly in research and development transfer.
This pattern is also present in small Caribbean countries and
Peru which also evaluated R&D with low rates. Interestingly,
some developing and emerging economies around the
globe—Argentina and Brazil in Latin America, Malawi and
Uganda in Africa, Indonesia and Philippines in Asia Pacific,
Bosnia and Herzegovina and Romania in EuropeÇhave, in
the opinion of the experts, little support from government
policy-related regulation. Experts in the more developed
economies (Italy, Croatia and Lithuania) were also critical of
this EFC. A more positive evaluation for the internal market
dynamics is one of the best-evaluated EFCs in many
countries, especially in Europe (EU)/ and non-EU)/).
Innovation-Driven Economies
To some degree, the observed higher rates in innovationdriven economies are consistent with the GEM conceptual
framework and the notion that EFCs have higher priorities
among more economically developed countries. At the
same time, it should be noted that reference points may
differ across economies: What is perceived to be good
in one country may be perceived to be poor in others. To
visualize the differences that exist, standardized mean
Z-scores are shown for each EFC in Figure 3.2 and Figure
3.3. These figures display that many EFCs do differ by
economic development phase. The clearest differences in
the 2013 NES results are government programs, national
policy regulation (Figure 3.2) and physical infrastructure
and R&D transfer (Figure 3.3). However, some other EFCs
do not present such clear differences; for example, cultural
and social norms. Also, on average, less developed countries
show higher rates in post-school entrepreneurship education
and in internal market dynamics which is evaluated best
by factor-driven economies. For these two examples, the
explanation is likely that some markets in innovation-driven
economies are mature and consolidated (versus factordriven) and face a lot of new opportunities for further
development in their internal markets. The same could be
true at middle- and high-education levels where efficiencydriven economies advance more quickly with relative new
programs and efforts to train and better educate people on
the value of entrepreneurship, while educational institutions
in developed economies might be less quick to adapt and
remain stuck in established routines.
Note: Values of indicators are based on averaging the Z-scores (standardized values) for the economies in each of the three phases of economic
development.
R&D Transfer
0.40
0.20
0.00
Cultural and Social Norms
Commercial & Services
Infrastructure
-0.20
-0.40
-0.60
Education - Primary and
Secondary
Internal Market - Dynamics
49
Internal Market - Openness
Factor-Driven Economies
Efficiency - Driven Economies
Innovation-Driven Economies
Saul Estrin, Julia Korosteleva and Tomasz Mickiewicz.
“Which institutions encourage entrepreneurial growth
aspirations?” Journal of Business Venturing, Volume 28,
Issue 4, pages 564–580, July 2013.
50
RESEARCH ISSUE
In this study, which builds upon the entrepreneurship and
institutional literature, Estrin, Korosteleva and Mickiewicz
investigate how the institutional environment and
individual characteristics of entrepreneurs, independently
and interactively, explain growth aspirations of young firms
across economies. More specifically, they explore the effect
of macro-level institutions, notably corruption, security of
property rights and government activity, on entrepreneurs’
aspirations to increase employment. Moreover, they
investigate if and to which extent entrepreneurs’ social
ties compensate for weaknesses in national institutions.
Growth aspirations of entrepreneurs, rather than simply
the decision to become an entrepreneur, are important
because there is a body of empirical research showing
that entrepreneurial aspirations matter for subsequent
firm growth. Another reason why it is important to study
what determines entrepreneurial aspirations stems from
the need to understand expansion as an entrepreneurial
decision, defined not just by resource constraints but by
managerial attitudes and predispositions, which are in turn
shaped by the complexity of the external environment.
A decision to grow a business may play a particularly
significant role at the stage of entrepreneurial process
when young firms already survived the initial period of
incubation and their owners and managers face a choice
of either preserving status quo or expanding, staying
continuously alert to those entrepreneurial opportunities
with scope for growth.
THEORY AND METHOD
Authors build both upon Williamson’s (2000) hierarchical
approach to institutions and on social micro level
perspective on institutions developed by Granovetter
(1985). Based on the former, they first identify three
fundamental institutional dimensions—the level of
corruption, the strength of property rights and the scale
of government activities—all of which are likely to affect
the growth aspirations of entrepreneurs. Second, they
employ the sociological perspective to extend Williamson’s
framework further by exploring whether individual
social networks (captured here by “knowing other
entrepreneurs”), also play an important role in enhancing
entrepreneurs’ growth aspirations both directly, and more
importantly, through compensating for the macro-level
institutional weakness.
The authors test the hypotheses concerning these effects
on entrepreneurs’ growth aspirations by using GEM
data combined with a number of institutional datasets.
Their sample covers more than 8,000 individuals in 42
economies worldwide over the period of 2001–2006. The
authors employ multilevel modeling to take into account
the hierarchical structure of the data in which individuals
represent level one, country-years samples represent level
two and economies represent level three.
FINDINGS
The authors find that higher levels of corruption, weaker
property rights and larger government size (associated with
governance and allocative disincentives) all significantly
constrain entrepreneurial employment growth aspirations.
At the same time, embeddedness in local social networks
emerge to play an important role in directly enhancing
aspirations of entrepreneurs to grow their businesses, and
also through reducing (although, importantly, not fully
eliminating), the negative effect of some institutional voids,
notably higher levels of corruption and weaker property
rights protection.
IMPLICATIONS
These findings have significant policy implications.
Although social ties are shown to positively moderate the
effect of macro institutions, notably property rights and
corruption, they do not fully eliminate the deficiencies of
these institutions. Therefore relying on the development
of local social networks to substitute for institutional
reform would not be an adequate solution to ensure that
entrepreneurs create jobs. The higher order institutions
remain important for growth aspiration entrepreneurship,
even when we account for moderating impact of local
social structures. It is important for policymakers to create
an environment allowing for the adequate protection of
property rights, smaller-scale governments and lower
levels of corruption. Moreover, distinctions in institutional
features are important. While corruption is harmful, weak
property rights (government arbitrariness) create an even
more fundamental threat to entrepreneurship.
51
52
It is hard to imagine that three decades ago there was only
limited attention for the role entrepreneurs play in socioeconomic development. By the end of the 1980s however,
interest in the role of entrepreneurship in economic
development had increased. This was based, arguably, on
a rediscovery of Joseph Schumpeter’s (1942) seminal work
on the role of innovative entrepreneurs for macro-economic
performance. He argued that, by introducing new productmarket combinations, these entrepreneurs generated
new and more efficient ways of production and pushed
underperforming firms out of the market: a process of
“creative destruction”. While several studies underscored
the importance of entrepreneurship (starting with Birch#
1979) and a field of entrepreneurship studies emerged
and developed rapidly, it also became clear that there was
no comparable international data on entrepreneurship
and venture creation (Reynolds, Storey and Westhead,
1994). Government databases were primarily based on
registrations by new firms. These registration databases, in
some economies overseen by the Chambers of Commerce,
were based on differing requirements for registration,
resulting in different rules for similar entrepreneurs across
different sides of national borders - in some economies
registration would be mandatory, in others not. Aside
from this, in many economies across the globe, data on
new venture creation was not systematically collected.
It was this situation that led to a group of academic
scholars to star GEM in 1997. Its main goal, particularly in
its first years of existence, was to measure differences in
the level of entrepreneurial activity between economies.
With this information, factors determining national levels
of entrepreneurial activity could be identified, as well
as policies to enhance national levels of entrepreneurial
activity.
Achieving this goal would also help establish how
entrepreneurship relates to economic growth and, in
a longer-term perspective, economic development.
Entrepreneurship is believed to contribute to economic
development because entrepreneurs create new
businesses, and new businesses create jobs, ensure variety,
intensify competition, and may even increase productivity
through technological change. Some studies argue that in
recent decades, several trends such as the development
of new technologies have resulted in new business models
that suit small and new ventures better than before; hence
they see a shift from large corporations to small and new
ventures (Blau, 1987; Thurow, 2003) or put it differently:
to the rise of an entrepreneurial economy (Thurik etXc%#
2013).
As GEM and other studies have shown, entrepreneurship
rates differ not only among economies at similar or
different stages of economic development but also
among regions in a single country. Moreover, not all
entrepreneurial efforts appear to have the same impact
on economic development. The GEM data collection
efforts now allow for comparisons across widely varying
sets of economies and regions and for making distinctions
between several types of entrepreneurship. The GEM adult
population survey database has grown to nearly two million
observations in 104 economies that have participated in
GEM between 1999 and 2013. Future studies exploiting
the GEM data may therefore be of tremendous help
in substantiating the impact of (specific types of)
entrepreneurship on economic growth and economic
development.
In the fifteen years of existence, GEM has evolved
considerably (Bosma, 2013). While keeping an eye
on the original objectives of GEM, related to providing
international comparative measures of entrepreneurship
activities, several modifications and additions have
been implemented, based on new knowledge offered
by the research field of entrepreneurship as well as
from accumulating evidence that emerged from GEMbased research. Next to implementing these academic
contributions into the project, GEM has also contributed
to academia itself. The remainder of this section discusses
two key developments highlighting the development
GEM has seen throughout the past fifteen years, namely
(i) moving from a focus on one indicator to a more
encompassing view of entrepreneurial profiles; and (ii)
broadening the scope of GEM indicators by introducing
special topics. To demonstrate the value of in-depth
analysis of special topics related to entrepreneurship,
the example of ‘entrepreneurial employee activity’ is
highlighted. This section concludes by assessing the rapidly
emerging research output from the GEM data.
FROM ‘TEA’ TO ENTREPRENEURIAL PROFILES
Since its founding, GEM has focused on the phase that
combines the stage in advance of the start of a new firm
(nascent entrepreneurship) and the stage directly after
the start of a new firm (owning-managing a new firm).
Taken together this phase is denoted as “early-stage
entrepreneurial activity” (TEA, see Chapter 2). In addition,
individuals involved as owner-managers in established
firms are identified. It is important to realize that the TEA
rate is a participation rate – of individuals involved in the
early-stage of venture creation - and as such does not
reflect a linear relationship between entrepreneurship and
economic development (Acs, 2006). Neither does it reflect
any entrepreneurial activity taking place in established,
more mature businesses, other than new business spinoffs
sponsored by parent companies. The GEM studies found
that developing economies often exhibited much higher
TEA rates than developed economies, however with
more necessity-driven motivations. An important policy
implication from these results, and mirrored by findings
from other studies, was to not measure the entrepreneurial
climate on the number of start-ups (or TEA rates) only, but
to really appreciate the nature of entrepreneurial activity
(Shane# 2009)18%
Indeed, as shown by the revised GEM conceptual
framework (see Figure 1.2) with its focus on a dynamic
interaction between the ‘three entrepreneurial A’s
(attitudes, activity and aspirations), the relationship
between entrepreneurship and development is not
straightforward, and TEA should therefore not be used
as a simple ranking of entrepreneurship among nations.
In factor-driven economies, for example, a reduction in
the TEA rate may be seen as a good sign. If a modest
share of entrepreneurs managed to create good jobs for
others, this means more individuals have been provided
with alternatives to earn a living. For many a paid job
will be preferred over an uncertain spell of necessitydriven entrepreneurship. Hence, more entrepreneurial
opportunities would here induce a lower rate of new
venture creation: fewer numbers of new startups but with a
higher impact on the economy.
Increases in the TEA rate may also occur when the general
economic climate is on a cyclical growth trend and market
opportunities are growing. A high TEA rate may be specific
to regional economic, demographic and cultural contexts.
The same TEA rate in two nations or regions may mask
differences in type and aspiration of entrepreneurs between
these locations.
Figure 4.1 demonstrates that the entrepreneurial profile
of Greece differs quite a lot from the ‘average’ profile
of an innovation-driven economy. The profile is based
on the most recent GEM results; in order to get more
statistical precision the indicators on job expectations
were based on the merged 2011-2013 data. To make for
a better comparison among indicators, each indicator
has been adjusted in such way that the average across all
economies is set at zero and the standard deviation across
all economies equals one. This implies that differences
of one (from zero or from the average of ‘innovationdriven economies’) can be considered substantial. Even
though Greece’s TEA rate is slightly higher than (but still
comparable to) other economies, other indicators tell a
more nuanced picture. First, it is apparent that due to the
crisis in Greece, perceived opportunities to start a business
are dramatically low, even though perceived capabilities are
quite high. Second, the nature of entrepreneurial activities
tends to be one of low ambition and relatively driven by
necessity. Also, entrepreneurial employee activity, as
measured by the GEM 2011 assessment (see the next
section and Bosma et al%, 2013) is quite low in Greece.
The entrepreneurial profile in Figure 4.2 shows that
Chile outperforms the “average” efficiency-driven
economy (according to the classification by the Global
Competitiveness Report) on every single indicator. Thus,
not only entrepreneurial activity but also entrepreneurial
attitudes and perceptions are high. It should be pointed out
that this also includes necessity-driven entrepreneurship.
However, ambitious types of early-entrepreneurship (in
terms of job expectations) are perhaps the most striking
feature of the entrepreneurial profile of Chile. Thus, the
overall picture is one of a high entrepreneurial spirit
and ambitions. Even though Chile is also developing
entrepreneurial employee activity, the rates appeared
to be lower than in most innovation-driven economies.
Stimulating corporate entrepreneurship and entrepreneurial
behavior among employees –requiring an appropriate,
enabling institutional setting - is perhaps a key ingredient
for Chile in making the next step in terms of economic
development.
18
Necessity-driven does not exclude high-impact entrepreneurship, even though the odds of making a substantial positive impact are considerably lower
among necessity-driven entrepreneurs.
53
Perceived Oppotunities
1.5
1.0
Entrepreneurial Employee
Activity (EEA)
0.5
Perceived Capabilities
0.0
-0.5
-1.0
-1.5
TEA: Solo & Low Job
Expectation (SLEA)
Early-Stage Entrepreneurial
Activity (TEA)
Greece
Innovation Driven- Economies
TEA: Medium-High Job
Expectation (MHEA)
TEA: Necessity-Driven
54
Note: All indicators refer to 2013 data, except for EEA (2011), MHEA and SLEA (2011-2013)
Perceived Oppotunities
2.5
2.0
Entrepreneurial Employee
Activity (EEA)
1.5
Perceived Capabilities
1.0
0.5
0.0
-0.5
TEA: Solo & Low Job
Expectation (SLEA)
Early-Stage Entrepreneurial
Activity (TEA)
Chile
Efficiency - Driven Economies
TEA: Medium-High Job
Expectation (MHEA)
TEA: Necessity-Driven
BROADENING THE SCOPE OF ENTREPRENEURSHIP:
GEM SPECIAL TOPICS
Entrepreneurship is a multifaceted phenomenon. Even
though the monitoring of entrepreneurial attitudes,
activity and aspirations following a tested procedure
across economies and over time has many benefits,
several important aspects of entrepreneurship remain
underexplored in an international context. By 2009 GEM
had positioned itself as the world largest data collection
initiative on entrepreneurship indicators, involving more
than 50 economies each year, and efforts were made to
simplify the adult population survey questionnaire and
create space for assessing “special topics”.
Special topics involved a set of dedicated questions in both
the adult population survey and the expert survey, for all
participating economies. Special topics are selected on
several criteria, the main one being that the cross-country
results that will be generated should bring new information
to the entrepreneurship research community and could
as such help exploration of new research questions. The
key advantage is that existing GEM procedures can be
exploited to generate a wealth of data at the individual
level (including entrepreneurs, potential entrepreneurs and
other individuals) and across economies (allowing for an
assessment of specific country contexts). Special topics
conducted so far included for example an assessment
of education and training for entrepreneurs, social
entrepreneurship, entrepreneurial employee activity,
immigrant entrepreneurship. This report introduces
linkages between entrepreneurship and well-being in
Chapter 5. In addition to these topics, the regular GEM data
collection also resulted in GEM special reports on women
entrepreneurship, entrepreneurial finance, high-growth
entrepreneurship and youth entrepreneurship. A full list
of the special reports published by GEM is provided in the
Introduction.
While each of these special reports, freely available on the
GEM website, have important findings and implications, it
is useful to highlight here some of the main findings on the
recent study comparing Entrepreneurial Employee Activity
(EEA) across economies, since the information is very much
complementary to what is presented elsewhere in this
report. As stated earlier, the general pattern that emerged
from the GEM data showed a negative association between
phases of economic development and involvement in TEA
(i.e., active involvement in the early-phase of the start-up
process), the expectation was that developed economies
host more ‘entrepreneurial employees’: employees who
are, on their own initiative or that of their employer, actively
involved in entrepreneurial activities such as developing a
new product, entering new markets with existing products,
or setting up new establishments. Indeed, Figure 4.3
confirms that, unlike TEA (and in particular the component
with limited ambitions for job creation), EEA tends to
increase by phase of economic development. Developed
economies tend to provide better jobs, while still offering
individuals the opportunity to take initiative and some risks
within their role as an employee.
12%
Percentage Adult Population (18-64 years)
10%
40%
30%
20%
10%
Entrepreneurial Employee Activity (EEA)
Medium-High Job Expectation TEA (MHEA)
Solo & Low Job Expectation TEA (SLEA)
0%
Factor-Driven
Economies
Source: Bosma et al. (2012)
Efficiency-Driven
Economies
Innovation-Driven
Economies
55
However, the second important result was that even though
this general pattern emerges when putting all economies
within three major stages of economic development
together, significant differences within these three groups
remain. This is shown in Table 4.1, where a classification
emerges based on just two relatively simple indicators from
GEM: the percentage of individuals involved in independent
entrepreneurship with medium-to-high job expectations
for the next five years on the horizontal axis and their
‘counterparts’ who function as an employee (EEA-MH) on
the vertical axis. While there may be some outliers in this
single-shot study, the overall pattern makes a lot of sense
intuitively19. Type A (high EEA-MH and low TEA-MH) is
prevakent in five small open economies in North-West
Europe, that have a high score on the World Values Survey
index of secular-rational values and a high level of social
security for employees. In some of these economies the
EEA rate actually exceeded the TEA rate.
Type B (high rates of both types of entrepreneurship) is
active in of three Anglo-Saxon heritage economies with
relatively traditional cultural values and a high degree of
income inequality. In addition, Types A and B share a high
level of self-expression values (from the World Values
Survey), suggesting a relatively high degree of autonomy
for employees, and a relatively high rate of employers’
support for employees who come up with new ideas.
Type C (low rates of both types of entrepreneurship) is
exhibited in eight other European economies plus Japan
that on average have a relatively low average per capita
income, a relatively low percentage of employees with
post-secondary and higher education, and a low emphasis
in the education system on innovative and pro-active
behavior. Finally, Type D (low EEA-MH and high TEA-MH)
includes four ‘Asian tigers’ plus the Czech Republic. These
economies share a low level of self-expression values
and the GEM Adult Population Survey results point at a
relatively low rate of employers’ support for employees
who come up with new ideas.
Bosma et al. (2013) suggest several implications of these
findings for researchers, policy makers and the business
community. Importantly, the findings provide support for
the notion that entrepreneurship goes beyond starting new,
independent firms. A significant share of entrepreneurial
activity is happening within existing firms. While this is
not a new observation in itself, the initial international
comparison provided by GEM allows for a more complete
picture when drawing entrepreneurial profiles for
economies across the globe.
56
TEA-MH: LOW
TEA-MH: HIGH
EEA-MH: HIGH
Type A
Belgium
Denmark
Finland
Netherlands
Sweden
Type B
Australia
Ireland
United States
EEA-MH: LOW
Type C
France
Germany
Greece
Japan
Portugal
Slovenia
Spain
Switzerland
United Kingdom
Type D
Czech Republic
Korea, Republic of
Singapore
Taiwan
UAE
*Note: Below versus above the unweighted average for innovation-driven economies in 2011
Some economies have continued to measure EEA, see Chapter 2. A second complete assessment is scheduled for 2014 and more are expected to
follow.
19
OUTCOMES IN DIFFERENT WAVES OF GEM RESEARCH
As more and more data became available, the topics
explored using GEM data, as well as the methodologies
used, underwent considerable changes. Consequently
several ‘waves’ of GEM-based research emerged after the
first GEM Global report was published in 1999. The first
wave merely provides country-level information, based on
the questionnaires to adult individuals and experts in the
participating economies, and is primarily captured in GEM
Global and National reports. These benchmarking exercises
led to some refinements in the survey instruments; almost
all GEM-based articles to appear later on are based on data
from 2001 onwards.
The second wave saw the first peer-reviewed GEM-based
articles in international peer-reviewed academic journals.
In 2005, nine papers presented at the very first GEM
Research Conference in Berlin, 2004, were bundled in
a special issue of Small Business Economics, edited by
Rolf Sternberg and Sander Wennekers. Examining these
articles, it gives – in hindsight – a good taste of what was
to be offered later on. The introduction article in that
special issue makes the critical point that manifestations
of entrepreneurship can differ depending on the context
and that as such the impact of entrepreneurship on growth
may be different (Sternberg and Wennekers, 2005). The
collection of papers in this special issue reflected a variety
of topics and summarized the academic contributions
emerging from GEM data up to that date. Each of these
papers has been cited widely, indicating that the set of
papers provided for a new and relevant contribution to the
existing body of knowledge.
and state financial systems (e.g., Greece, Iceland).
Compared to multinationals, small and new firms may be
considered individually more vulnerable due to their size,
lack of diversification, and weak financial structure (OECD,
2009). A growing body of research indicates that new,
small firms may react differently to large, established firms
in a recession (Moscarini and Postel-Vinay, 2012). This
is an important observation, as entrepreneurial firms are
the backbone of local, regional, and national economies,
traditionally providing the majority of employment and
innovation (Acs and Audretsch, 2000). Furthermore,
recent work suggests that entrepreneurial activity
can play a key role in aiding recovery from recessions
(Koellinger and Thurik, 2012). According to Parker (2011:xi)
more knowledge is required as regards the “real-world
manifestations” of the phenomenon of entrepreneurship
and the recession. This section elaborates on this using
evidence from GEM, however without claiming to provide
definite answers as different situations call for different
interpretations. GEM national reports, carefully drafted by
GEM national teams, should be consulted as these offer
more relevant information on the national contexts.
The third important wave of GEM research has set in more
recently: it is characterized by adopting more advanced
methods next to (and because of) the increasing time
observations and numbers of economies. Grasping policy
effects (GEM’s third objective) have therefore become
increasingly possible. In addition, more scholars from
outside the GEM network have been using its data.
The academic contributions are also characterized by
an increasing amount of regional differentiation and
providing more reliable links with economic development.
Increasingly, GEM-based studies reach a wider academic
audience, witness the list of more than 20 journals that
are listed in the ‘Social Science Citation Index’ and have
published GEM-based papers (Bosma, 2013; Alvarez,
Urbano and Amorós# 2013).
As has become clear earlier in this report, the local context
shapes the nature of entrepreneurial activity - the way in
which entrepreneurship manifests itself. Even though in
the sophisticated econometric analysis of Koellinger and
Thurik (2012) it appeared that indicators of (nascent)
entrepreneurship rates fell before GDP indicators did,
leading them to conclude that entrepreneurship may be
a procyclical indicator, it should be stressed that this is a
general effect found across a set of developed economies.
For specific, individual economies, the pattern may look
very different, as responses in opposite directions may be
in action at the same time, in the same region or country.
In some economies, entrepreneurs may indeed act as
visionary individuals, spotting and acting on opportunities.
When a crisis looms on the horizon some individuals with
entrepreneurial intentions may postpone entrepreneurial
activities because of the expected decline in demand.
Others may actually see new opportunities emerging
from a crisis (see Bosma and Terjesen, 2014 for an initial
analysis). And, of course, another group may not at all be
driven by opportunity but pushed into entrepreneurship as
a result of the problems on the job market, especially when
social security entitlements are low. The overall response
for the economy will then depend on how the context
influences the balance to go either direction.
The recent economic crisis is regarded as the worst
since the Great Depression, with significant parts of the
world economy still struggling to recover. Policymakers,
business leaders, and academics have been – and still are extremely concerned about the crises’ impact on economic
activity (e.g., Agarwal et al., 2009; Hausman and Johnston,
2014; OECD, 2009; Parker, 2012). However most attention
tends to focus on the downfall of large established
multinationals (e.g., Lehman Brothers, Saab Automobile)
For example, combining GEM data with economic
indicators published by IMF, Figure 4.4 shows that for the
United States, nascent entrepreneurship rates (the purple,
dashed lines) tend to follow rather than to announce
annual rates of GDP growth, while entrepreneurial activity
represented by owner-managers in new firms seems to be
affected less. The blue surface indicates the percentage of
early-stage entrepreneurs whom are necessity-driven. It is
clear that, while the number of early-stage entrepreneurs
(in particular nascent entrepreneurs) decreased between
2005 and 2010, these were driven more frequently out
of necessity. Whereas in 2001 one in ten early-stage
57
entrepreneurs reported to have no better option for work,
this amounted to as much as one in three in 2010. In 2013
it has dropped to one in five early-stage entrepreneurs
reporting to be driven out of necessity, still twice as many
as in 2001. It is no coincidence that the peak of necessitydriven entrepreneurship occurs in the same year as the
peak in the unemployment rate, one year after GDP rates
picked up.
A similar pattern can be observed for Japan, even though
important differences are also notable. Figure 4.5 shows
that also for Japan, peaks in unemployment go together
with peaks in necessity-driven entrepreneurship. These
peaks can be observed in 2002, when the Asian crisis
was at its height, and in 2010. Dramatic changes in GDP
are, in comparison to the United States, accompanied
by less dramatic changes in both unemployment rates
and entrepreneurial activity rates. The rates of nascent
12
40
10
35
8
30
6
25
4
20
2
15
0
10
-2
5
0
-4
2001
58
2002
2003
2004
2005
2006
2007
2008
2009
2010
2011
2012
2013
Necessity-driven entrepreneurship, % of TEA (right axis)
Nascent entrepreneurship, % in 18-64 population
Owner-managers in new firms, % in 18-64 population
Unemployment rate, % of labor force
GDP growth, % change
Sources: GEM Adult Population Surveys and IMF World Economic Outlook, October 2013
10
40
8
35
6
30
4
25
2
20
0
15
-2
10
-4
5
-6
0
2001
2002
2003
2004
2005
2006
2007
2008
2009
2010
Necessity-driven entrepreneurship, % of TEA (right axis)
Nascent entrepreneurship, % in 18-64 population
Owner-managers in new firms, % in 18-64 population
Unemployment rate, % of labor force
GDP growth, % change
Sources: GEM Adult Population Surveys and IMF World Economic Outlook, October 2013
2011
2012
2013
entrepreneurial activity and owner-managers in new
firms have been consistently low throughout 2001-2013.
It reflects the relatively rigid institutional setting and the
emphasis on large, established firms, even though the
overall trend does point at an increasing rate of early-stage
entrepreneurial activity.
Having assessed indicators over time for two major
innovation-driven economies, we now consider economies
that are classified in the efficiency-driven phase by
the World Economic Forum. An interesting example is
Argentina, which has been struggling with several economic
setbacks in the past fifteen years. As Figure 4.6 indicates,
the major crisis during 2000-2002 had a significant impact
on entrepreneurial activity. Both nascent and new firm
activity grew, at the same time almost half of the earlystage entrepreneurs were involved in this activity because
they had no other options for work. Thus, the decrease in
TEA rates after 2003 actually signaled a period of economic
recovery. Confidence in the institutional setting increased,
creating opportunities for entrepreneurs to create jobs
and reducing the need for many to earn a living as selfemployed while they fare better working as an employee.
The global crisis also affected Argentina even though
unemployment rates were kept under ten percent, much
lower than the soaring 22 percent in 2002. Necessitydriven entrepreneurship is still prevalent in Argentina, like in
many other efficiency-driven economies.
The final example refers to another country that has
faced significant changes in the past fifteen years. Croatia
has experienced several major reforms since it declared
independence from the former socialist state Yugoslavia in
1991. War devastations in the period of 1991-1995 slowed
down many planned reforms and had long-term impact
on high proportion of the necessity based entrepreneurs
even in the period up to 2005. From 2000 the focus was
on joining the European Union and to this end investments
were made in terms of human development, infrastructure
and education, while also supporting culture through
several institutions. The prospect of joining the EU boosted
the economy as can be seen from the economic indicators
in Figure 4.6 Annual GDP growth was steady at five percent
and unemployment rates decreased from 20.5 percent
to 8.4 percent between 2001 and 2008. After 2008
the financial crisis hit several EU economies particularly
hard and Croatia also faced the consequences. Hence,
when Croatia formally became the 28th EU Member
State on 1 July 2013, this was still an important event but
accompanied with a less positive atmosphere than was
hoped for in the beginning of the negotiations. From Figure
4.7 it can be seen that increasing unemployment rates
from 2008 were accompanied by higher percentages
of necessity-driven early-stage entrepreneurial activity.
The pattern also shows a widening gap between nascent
entrepreneurship and rates of owner-managers in new
firms, suggesting that it is rather difficult for nascent
entrepreneurs to get their ventures up and running.
60
25
50
20
15
40
10
30
5
20
0
-5
10
-10
0
-15
2001
2002
2003
2004
2005
2006
2007
2008
2009
2010
Necessity-driven entrepreneurship, % of TEA (right axis)
Nascent entrepreneurship, % in 18-64 population
Owner-managers in new firms, % in 18-64 population
Unemployment rate, % of labor force
GDP growth, % change
Sources: GEM Adult Population Surveys and IMF World Economic Outlook, October 2013
2011
2012
2013
59
25
60
20
50
15
40
10
30
5
20
0
10
-5
Necessity-driven entrepreneurship,
% of TEA (right axis)
Nascent entrepreneurship,
% in 18-64 population
Owner-managers in new firms,
% in 18-64 population
Unemployment rate, % of labor force
-10
0
2001
2002
2003
2004
2005
2006 2007
2008 2009
2010 2011
2012
GDP growth, % change
2013
Sources: GEM Adult Population Surveys and IMF World Economic Outlook, October 2013
Note: Croatia participated in GEM since 2003
60
At this point, looking back at a significant but still relatively
short period of fifteen years of GEM data collection, a
fair number of observations have been done that now
seem trivial, but were basically unknown before the
project started. Before the start of this century, leading
scholars had no information that discredited the view
that “average new firm birth rates are roughly similar
across economies” (cf. Reynolds et al%, 1994, p. 443.).
GEM has shown that early-stage entrepreneurial activity
rates can vary by a factor of ten across economies.
Before GEM started, there were basically two opposing
views on whether entrepreneurship made an important
contribution to economic growth or not. Partly thanks to
GEM-based research, now it is known that the link is much
more complex and interesting than the “all or nothing”
arguments of the past; the two groups have in fact moved
towards the middle and are collaborating increasingly.
GEM also underlined that not all entrepreneurship is
about the pursuit of opportunity, especially in developing
economies, and the ratio of necessity to opportunity
entrepreneurship seems to be systematically linked to a
country’s stage of economic development (Acs, 2006, Acs
and Amorós, 2008). It is perhaps these contributions –
uncovering the vastly different quantity and quality of new
business activity across nations, and fuelling study of the
links between entrepreneurship and economic growth –
that are GEM’s main achievements to date.
There are still big challenges ahead. The advantage
of GEM data is that different types of entrepreneurial
activity as practiced by individuals can be examined,
across economies or regions and over time. Different
types of entrepreneurship may prove to have different
effects on economic growth, at different stages of
economic development. This chapter only showed a sneak
preview of evidence on how economic crises may affect
entrepreneurship in different institutional settings. More
research in this area is to be expected, and important policy
implications are likely to be derived from this. In turn this
will also shed more light on the role of entrepreneurial
activity in overcoming crises. For example, Bosma and
Terjesen (2014) document initial evidence on how
entrepreneurs respond to economic downturns. They
show that owner-managers in new firms report to see
additional opportunities resulting from the crisis, especially
in national contexts characterized by lower performance
on economic growth, higher unemployment rates (i.e.,
when the crisis is more severe) and less regulation in term
of the number of procedures required to start a business.
These entrepreneurs also tend to be opportunity-driven
and ambitious in terms of job creation, innovativeness
and international orientation. This information adds to the
finding by Klapper and Love (2009), who found that in
economies that were struck by the crisis, fewer new entries
of firms have been observed.
The above makes clear that GEM has helped in
understanding the prevalence, nature and role of
entrepreneurship in the economy and the society at
large. This is an important achievement and has been
This section draws partly on overview articles by Bosma (2013) and Alvarez et al. (2013) and reflects the personal opinions of the authors of this
report. It should be stressed that these does not necessarily coincide with the point of view of the Global Entrepreneurship Research Association, the
formal entity that hosts GEM.
20
made possible by applying an annual data collection
methodology consistently across different economies and
over time, by in sum several hundreds of dedicated scholars
across the globe. For some of the participating economies,
GEM enabled evidence-based policy on entrepreneurship
for the first time.
It is definitely worth looking to the future and enabling
dynamic capabilities within GEM to respond to
important changes that the world has seen in these fifteen
years. GEM was initiated in a time when email was still a
novelty,
the possibilities of the Internet were highly underestimated
and social media were basically non-existent. In the near
future, new forms of data collection may be explored and
adopted, recognizing opportunities offered by new (digital)
technologies, capitalizing on the professional expertise and
hands-on knowledge on entrepreneurship that exists with
the national team members. Without a doubt there will be
plenty of opportunities for enhancing our understanding
of the economic and social impact of entrepreneurs across
the globe.
61
62
Economic development has traditionally been measured
using strictly finance-oriented indicators like GDP per
capita. However, this material component of economic
development represents only one dimension. As economics
is a social science, it is quite surprising that the social
component has, until recently, not been regarded as a key
indicator for scholars and policy makers. It is exemplary
that a different term is being used for this: well-being . The
topic of well-being21 has been gaining presence rapidly in
social sciences and economics. The promotion of factors
that could increase well-being of the population—for
example, how people are satisfied with their lives and
their jobs—is progressively seen as essential objectives of
policy. Since the Kingdom of Bhutan introduced the notion
of “gross national happiness,” many measures have been
developed to provide additional elements to the traditional
economic-oriented measures of development (Angner,
2010). Stiglitz, Sen and Fitoussi (2009) suggest exploring
the use of indicators of well-being to develop better
policies: “The time is ripe for our measurement system to
shift emphasis from measuring economic production to
measuring people’s well-being.”22 “Happiness” can now be
wisely compared across economies. Some recent examples
are the World Happiness Report (Helliwell et al., 2013),
edited under the endorsement of the United Nations, or the
OECD measures of subjective well-being (OECD, 2013).
Considering GEM’s objectives, some questions that
emerge intuitively from this topic are the following: Do
entrepreneurs (self-employed) experience more personal
well-being than employees? Is personal well-being a
driver to be an entrepreneur? Are opportunity-driven
entrepreneurs experiencing higher levels of well-being than
necessity-driven entrepreneurs? And what about ambitious
versus non-ambitious entrepreneurs? And to what extent
are differences, if any, contingent on the regional or
national context? Surprisingly, there is not much literature
and empirical evidence about the relationship between
well-being (happiness or satisfaction) and entrepreneurial
activities on an individual level (Cooper and Artz, 1995;
Carree and Verheul, 2012). Specifically, there is a lack of
evidence to consider whether and how entrepreneurship
may matter for happiness and how happiness may matter
for entrepreneurship (Naude et al., 2011).
As GEM data shows, in several economies, between 10%
and 30% of a country’s labor force could be considered
early-stage entrepreneurs or business owners (see Chapter
2 in this report). If entrepreneurs generally experience
higher levels of well-being, they can significantly raise
aggregate well-being scores. Some empirical evidence
shows that entrepreneurs do indeed experience higher
levels of job satisfaction than employees. Empirical
research suggests that this is because they value the
independence and lifestyle flexibility of running their
own business (Benz and Frey, 2004; Blanchflower, 2004;
Lange, 2012; Moskowitz and Vissing-Jorgensen, 2002;
Ajayi-Obe and Parker, 2005; Taylor, 2004). Furthermore,
entrepreneurs experience “procedural utility,” that the
process of being an entrepreneur provides enjoyment over
and above the material success of being an entrepreneur
(Block and Koellinger, 2009). However, this initial evidence
is still based on samples in a limited set of economies.
The main objective of this special topic is to measure
different aspects of well-being of the individuals that
participate in the GEM Project and to correlate these
measures with entrepreneurship dynamics across
21
GEM was not an exception in this. Even though the social context has always played a critical role in the GEM conceptual framework as an input factor,
the social component as an output was only introduced in the GEM 2009 assessment (Bosma and Levie, 2010)
22
The Commission on the Measurement of Economic Performance and Social Progress (Stiglitz et al., 2009).
economies. Following the scope and methodology of the
GEM project, this special topic has produced relevant
information at the country level as well as primary data
from individuals about their own perception of well-being
and entrepreneurial activities. This approach with large
samples is unique and one of the first attempts to study the
relationship between well-being and entrepreneurship at
the individual level.
In 2013, the GEM surveys (APS and NES) included a
special set of questions that provided evidence of the
entrepreneurial activities and motivations in relation to
well-being measures from the 2013 participant economies.
One set of APS questions and NES questions related to
Subjective Well-being were compulsory. The rest of the
questions were optional. The general analysis contrasts
the well-being indicators of the different stages of
entrepreneurial activity with the population not involved in
entrepreneurship. The motivation to become entrepreneurs
was also analyzed.
Well-being is a complex construct, and there is not a clear
consensus about how to measure well-being (Conceição
and Bandura, 2008). This special topic adopts a set of
tested constructs related to subjective well-being (life
satisfaction), work-life balance and satisfaction with
the job. These measures were included as a module in
the GEM Adult Population Survey for 2013. Additionally
four questions were developed to assess the framework
conditions related to well-being within a country (or region)
and included in the NES survey.
SUBJECTIVE WELL-BEING
Subjective well-being is related to the manner in which
people experience the quality of their lives, and it comprises
both emotional reactions and cognitive judgments (Diener,
1984). To measure subjective well-being, the Satisfaction
With Life Scale SWLS (Pavot and Diener, 2008), a five-item
instrument designed to measure global cognitive
judgments of satisfaction with one’s life, was adopted23%
The scale is in the public domain (not copyrighted). Credit
is given to the authors of the scale: Ed Diener, Robert A.
Emmons, Randy J. Larsen and Sharon Griffin as noted in the
1985 article in the Journal of Personality Assessment24%These
are the questions using five-point Likert scales, from 1
“Strongly Disagree” to 5 “Strong Agree”:
1. In most ways, my life is close to my ideal.
2. The conditions of my life are excellent.
3. I am satisfied with my life.
4. So far I have obtained the important things I want in life.
5. If I could live my life again, I would not change anything.
These questions were posed to all employed and selfemployed individuals in every country. Single indicators
for each participant economies were calculated using
similar procedures as described in Chapter 3 to calculate
summarized variables for NES constructs.
WORK CONDITIONS AND WORK-LIFE BALANCE
An additional set of questions that relates to work
conditions and work-life balance was included as an
optional section, and included by 54 economies. Work
conditions questions were designed to identify similarities
and differences in current working conditions among
employees and the self-employed, including selfdetermination and meaning, which are important elements
of empowerment (Spreitzer et al., 1997), and stress at
work25%The latter is an important component to measure
psychological well-being (Blustein, 2008). Satisfaction
with the work-life balance is defined as “an overall level of
contentment resulting from an assessment of one’s degree
of success at meeting work and family role demands”
(Valcour 2007#g% 1512). By focusing on overall satisfaction
with the way work and personal life are managed, the fact
that the significance of work or family life differs between
individuals and that private life encompasses more than the
family role alone is taken into account (Abendroth and den
Dulk, 2011)26%
ENTREPRENEURSHIP FRAMEWORK CONDITIONS AND
WELL-BEING
To corroborate the opinions provided by the adult
population, NES included four questions that inquire
whether the national (or regional) conditions help the
work-life balance of individuals and measure the perception
that entrepreneurs have, in general, more work and life
satisfaction:
1. In my country, the general conditions (economic, social,
political, cultural) allow people to perfectly harmonize personal
and working (professional/labor) life.
2. In my country, existing regulations allow people to perfectly
harmonize personal and working (professional/labor) life.
3. In my country, entrepreneurs are more satisfied with their
working (professional/labor) life than non-entrepreneurs.
4. In my country, entrepreneurs are more satisfied with their
personal life than non-entrepreneurs.
This report provides an initial assessment based mainly
on compulsory indicators of subjective well-being. These
indicators will be related to early-stage entrepreneurial
activity (TEA) and established business owners.
Additionally some analyzes about the motivation to become
an entrepreneur are shown. Motivations are strongly linked
to well-being, so this initial assessment will highlight these
23
For example, UNDP adopted this scale to measure life satisfaction in some countries. The Coca-Cola Happiness Institute (created in Spain in 2008 to
provide credible scientific information to support the link between happiness and wellness) also uses the SWLS.
24
A set of translations in the most common languages is available at http://internal.psychology.illinois.edu/~ediener/SWLS.html.
25
These questions were adapted from the additional set of questions required by the EU Commission to the GEM project since 2011. These questions
also have a five-point Likert scale: (1) I can decide on my own how I go about doing my work; (2) The work I do is meaningful to me; (3) At my work, I
am not exposed to excessive stress; (4) I am satisfied with my current work; (5) I am satisfied with my current income from work. Income includes both
salary and non-salary income such as payments in kind and other benefits.
26
We adapted Valcour (2007) original scale to three items, using the five-point Likert scale: (1) I am satisfied with the way my time is divided between
work and private life; (2) I am satisfied with my ability to balance the needs of my work with those of my personal or family life; (3) I am satisfied with the
opportunity to perform well at work and to substantially contribute to home-related responsibilities at the same time.
63
relationships. Further analyzes with more detail will be
produced in a full special topic report.
is that the prevalence of subjective well-being indicators
varies widely across world regions. Sub-Saharan African
economies exhibit the lowest rates, whereas Latin and
North Americans have the highest rates. Single country
analysis shows that the “traditional” welfare states like
Nordic economies and well-developed economies like
Netherlands, Switzerland and Singapore also exhibit high
rates of subjective well-being, confirming the results of
other studies adopting similar studies (Helliwell et al.,
2013; OECD, 2013). These differences suggest that in
each country and in world regions with close common
heritage, framework conditions such as economic,
political, institutional and cultural contexts have singular
influence on the population perception about their wellbeing and by consequences that shape the indicators of
entrepreneurship activities.
Table 5.1 presents the prevalence indicators of the
standardized scale27 of SWLS. This scale has the
hypothetical range of -1.7 (less subjective well-being
at country-level) to 1.7 (higher rate of subjective wellbeing). Each column deals with the scores for individuals
involved in typical phases and types of entrepreneurship
GEM discerns (such as TEA and owner-managers of
established businesses, motivation and gender; see also
Chapter 2) and those of employees who are not involved
in such entrepreneurship activities. One first observation
Non TEA or Established
Established business ownership
Innovation-Driven Economies
64
Efficiency-Driven Economies
Factor-Driven Economies
Early-stage entrepreneurial activity (TEA)
18-64 population
-0.60
-0.40
-0.20
0.00
0.20
0.40
Average SWB
One interesting finding is that in all regions, the average
of both TEA and established entrepreneurs exhibit
relatively higher rates of subjective well-being contrasted
with all populations and individuals not involved in
entrepreneurship activities. In addition, owner-managers
in established firms tend to rate their level of subjective
well-being higher than early-stage entrepreneurs, who
may have to deal with more uncertainty and pressure to
develop the firm into a sustainable situation. Figure 5.1
shows the differences by phase of economic development.
As was commented, less-developed economies, mainly
in Sub-Saharan Africa, have the lowest rates of subjective
well-being. Efficiency-driven and innovation-driven
economies do not differ substantially related to TEA
population. Established entrepreneurs exhibit the highest
rates of subjective well-being on the three development
stages. Even though these results are exploratory in nature
and need to be treated in this manner, they show initial
evidence that involvement in entrepreneurial activities,
both in the early-stage and established phases, is related
to personal evaluation of higher subjective well-being28.
Additional analyses will be presented in a forthcoming
report dedicated to this topic.
An analysis of opportunity-based versus necessitymotivated entrepreneurship, confirms that necessity-based
entrepreneurs across the three development stages have
considerably lower rates of subjective well-being (Figure
5.2). Necessity-based entrepreneurs in factor-driven
economies have the lowest average of subjective well-being
(-0.5). Innovation- and efficiency-driven economies do not
exhibit great differences in scores on subjective well-being
for both opportunity- and necessity-based entrepreneurs.
The extreme cases involve Zambia, with a rate of -1.26
on necessity-driven entrepreneurs (and also exhibiting
a low score on opportunity-based TEA with -1.31) and
Switzerland with 0.78 on opportunity-based entrepreneurs.
=`^li\,%) also shows the well-being indicators for early-
This scale has mean=0
For example, it should be noted that the category ‘employees’ includes those individuals who can be identified as ‘entrepreneurial employees’. Therefore, if these would have been singled out a better comparison between entrepreneurial active individuals in the labor force and their counterparts would
be achieved and differences may actually be more pronounced for economies exhibiting a large number of entrepreneurial employees (for example in
Scandinavia, see Bosma et al.#2013).
27
28
TEA female
TEA male
Innovation-Driven Economies
Efficiency-Driven Economies
TEA Necessity
Factor-Driven Economies
TEA Opportunity
-0.60
-0.40
-0.20
0.00
0.20
0.40
Average SWB
stage entrepreneurs by gender. Interestingly, female
entrepreneurs in innovation-driven economies exhibit on
average a higher degree of subjective well-being (0.25).
At country level, Puerto Rican male entrepreneurs (on
average) exhibit a higher degree of subjective-well-being
with 0.9; the highest rate across all the groups identified in
Kable 5.1. In counterpart, Zambia’s women entrepreneurs
exhibit the lowest degrees of subjective well-being (-1.3).
As was highlighted, these results are exploratory but show
initial evidence that for women, being an entrepreneur is
correlated with more subjective well-being. It should be
stressed that this is not a cause-effect conclusion, and
further analyses will be required inferring causality. For
example, women in many developed economies have
been increasing their education, have more egalitarian
environments and by consequence have more active
participation not only in the labor force but also in other
spheres such as politics and social issues. Conditions that
support the well-being of women, that could also shape
women entrepreneurs.
One interesting finding is that in all regions, the average
of both TEA and established entrepreneurs exhibit
relatively higher rates of subjective well-being contrasted
with all populations and individuals not involved in
entrepreneurship activities. In addition, owner-managers
in established firms tend to rate their level of subjective
well-being higher than early-stage entrepreneurs, who may
have to deal with more uncertainty and pressure to develop
the firm into a sustainable situation. Figure 5.1 shows the
differences by phase of economic development. As was
commented, less-developed economies, mainly in SubSaharan Africa, have the lowest rates of subjective wellbeing. Efficiency-driven and innovation-driven economies
do not differ substantially related to TEA population.
Established entrepreneurs exhibit the highest rates of
subjective well-being on the three development stages.
Even though these results are exploratory in nature and
need to be treated in this manner, they show initial evidence
that involvement in entrepreneurial activities, both in the
early-stage and established phases, is related to personal
evaluation of higher subjective well-being28. Additional
analyses will be presented in a forthcoming report
dedicated to this topic.
An analysis of opportunity-based versus necessitymotivated entrepreneurship, confirms that necessity-based
entrepreneurs across the three development stages have
considerably lower rates of subjective well-being (Figure
5.2). Necessity-based entrepreneurs in factor-driven
economies have the lowest average of subjective well-being
(-0.5). Innovation- and efficiency-driven economies do not
exhibit great differences in scores on subjective well-being
for both opportunity- and necessity-based entrepreneurs.
The extreme cases involve Zambia, with a rate of -1.26
on necessity-driven entrepreneurs (and also exhibiting
a low score on opportunity-based TEA with -1.31) and
Switzerland with 0.78 on opportunity-based entrepreneurs.
Figure 5.2 also shows the well-being indicators for earlystage entrepreneurs by gender. Interestingly, female
entrepreneurs in innovation-driven economies exhibit on
average a higher degree of subjective well-being (0.25).
At country level, Puerto Rican male entrepreneurs (on
average) exhibit a higher degree of subjective-well-being
with 0.9; the highest rate across all the groups identified in
Kable 5.1. In counterpart, Zambia’s women entrepreneurs
exhibit the lowest degrees of subjective well-being (-1.3).
As was highlighted, these results are exploratory but show
initial evidence that for women, being an entrepreneur is
correlated with more subjective well-being. It should be
stressed that this is not a cause-effect conclusion, and
further analyses will be required inferring causality. For
example, women in many developed economies have
been increasing their education, have more egalitarian
environments and by consequence have more active
participation not only in the labor force but also in other
spheres such as politics and social issues. Conditions that
support the well-being of women, that could also shape
women entrepreneurs.
65
TEA
Female
TEA
Male
TEA
Necessity
TEA
Opportunity
Non TEA or
Established
Established
business
ownership
Early-stage
entrepreneurial
activity (TEA)
Economies
18-64
population
REGION
LATINAMERICA & CARIBBEAN
Argentina
0.41
0.39
0.52
0.41
0.46
0.20
0.40
0.38
Brazil
0.17
0.14
0.22
0.17
0.28
-0.21
0.23
0.05
Chile
0.58
0.65
0.76
0.57
0.73
0.30
0.67
0.61
Colombia
0.17
0.27
0.31
0.17
0.33
0.03
0.30
0.24
Ecuador
0.54
0.62
0.56
0.54
0.68
0.49
0.69
0.54
Guatemala
0.37
0.44
0.40
0.37
0.49
0.32
0.46
0.41
Jamaica
-0.53
-0.42
-0.44
-0.54
-0.44
-0.37
-0.23
-0.63
Mexico
0.39
0.21
0.37
0.07
0.18
0.28
0.21
0.22
Panama
0.72
0.66
0.73
0.72
0.67
0.61
0.73
0.55
Peru
0.46
0.71
0.42
0.46
0.77
0.51
0.75
0.66
Suriname
0.01
0.39
0.02
0.01
0.50
-0.01
0.42
0.34
Uruguay
0.29
0.34
0.43
0.28
0.34
0.33
0.33
0.35
Trinidad and Tobago
0.38
0.37
0.70
0.38
0.37
0.38
0.36
0.39
Average
0.29
0.37
0.39
0.29
0.43
0.20
0.41
0.32
0.29
0.37
0.39
0.29
0.43
0.20
0.41
0.32
Algeria
-0.43
-0.33
-0.31
-0.43
-0.29
-0.44
-0.34
-0.32
Iran
-0.15
-0.11
-0.09
-0.15
0.01
-0.31
-0.19
0.14
Israel
0.07
0.16
0.24
0.08
0.23
-0.08
0.04
0.41
Average
66
MIDDLE EAST & NORTH AFRICA
-0.42
-0.31
-0.21
-0.42
-0.28
-0.49
-0.24
-0.44
-0.23
-0.15
-0.09
-0.23
-0.08
-0.33
-0.18
-0.05
Angola
-0.31
-0.02
0.38
-0.31
0.15
-0.45
0.13
-0.18
Botswana
-1.06
-0.96
-0.73
-1.06
-0.90
-1.12
-0.88
-1,05
Ghana
-0.55
-0.55
-0.37
-0.55
-0.41
-0.80
-0.48
-0.61
Malawi
-0.70
-0.65
-0.61
-0.70
-0.57
-0.75
-0.64
-0.66
Libya
Average
SUB-SAHARAN AFRICA
Nigeria
-0.22
-0.24
-0.05
-0.22
-0.26
-0.18
-0.31
-0.17
South Africa
-0.49
-0.11
-0.07
-0.49
-0.06
-0.20
-0.16
-0.04
Uganda
-0.47
-0.55
-0.66
-0.46
-0.68
-0.13
-0.63
-0.47
Zambia
-1.26
-1.29
-1.23
-1.26
-1.31
-1.26
-1.28
-1.30
-0.63
-0.55
-0.42
-0.63
-0.51
-0.61
-0.53
-0.56
-0.32
-0.28
-0.09
-0.32
-0.25
-0.34
-0.25
-0.32
Average
ASIA PACIFIC & SOUTH ASIA
China
0.27
-0.01
0.52
0.26
0.03
-0.10
-0.07
0.13
Indonesia
India
-0.05
-0.02
0.02
-0.05
-0.01
-0.07
-0.04
-0.01
Japan
-0.23
-0.31
-0.08
-0.23
-0.26
-0.43
-0.55
0.14
Korea, Republic of
-0.42
-0.42
-0.47
-0.42
-0.27
-0.69
-0.49
-0.24
Malaysia
-0.04
-0.01
0.31
-0.04
0.15
-0.70
-0.11
0.15
Philippines
-0.23
-0.03
0.00
-0.23
0.01
-0.11
-0.24
0.18
Singapore
0.18
0.25
0.23
0.18
0.25
0.26
0.17
0.39
-0.12
-0.08
-0.05
-0.12
0.01
-0.31
-0.11
-0.03
Taiwan
TEA
Female
TEA
Male
TEA
Necessity
TEA
Opportunity
Non TEA or
Established
Established
business
ownership
Early-stage
entrepreneurial
activity (TEA)
Economies
18-64
population
REGION
Thailand
-0.01
0.06
0.17
-0.02
0.07
-0.03
0.02
0.09
Vietnam
-0.26
-0.27
0.07
-0.27
-0.23
-0.41
-0.32
-0.22
-0.11
-0.10
0.06
-0.11
-0.05
-0.27
-0.18
0.02
Belgium
0.16
0.16
0.27
0.16
0.18
0.17
0.12
0.25
Croatia
-0.31
-0.05
-0.14
-0.32
0.12
-0.35
-0.08
0.03
Czech Republic
-0.03
0.00
0.10
-0.03
0.05
-0.15
-0.02
0.05
Average
ELIFG<$<L)/
Estonia
-0.12
0.20
0.07
-0.12
0.21
-0.04
0.07
0.41
Finland
0.40
0.39
0.58
0.40
0.42
0.21
0.36
0.44
France
-0.03
0.09
0.08
-0.03
0.17
-0.62
-0.01
0.30
0.12
0.06
0.27
0.12
0.18
-0.40
-0.04
0.22
Greece
-0.50
-0.30
-0.48
-0.50
-0.25
-0.46
-0.23
-0.50
Hungary
-0.29
-0.19
-0.06
-0.29
0.03
-0.77
-0.27
-0.06
Ireland
0.24
0.31
0.43
0.24
0.31
0.36
0.30
0.34
Italy
0.02
-0.01
0.19
0.02
0.13
-0.64
0.01
-0.06
Latvia
-0.20
0.02
-0.13
-0.20
0.12
-0.34
-0.01
0.08
Lithuania
-0.08
0.11
0.18
-0.08
0.15
-0.06
0.13
0.05
Luxembourg
0.36
0.23
0.08
0.36
0.21
-0.51
0.16
0.37
Netherlands
0.29
0.47
0.42
0.28
0.50
0.26
0.55
0.35
Germany
Poland
-0.16
0.00
-0.03
-0.16
0.13
-0.12
-0.05
0.11
Portugal
-0.14
0.11
0.07
-0.14
0.20
-0.13
0%10
0%13
Romania
-0.11
0.17
0.19
-0.12
0.27
-0.06
0,18
0%15
Slovakia
-0.21
-0.09
0.04
-0.21
0.13
-0.41
-0%16
0%02
Slovenia
0.08
0.16
0.19
0.08
0.23
-0.09
0%16
0%16
Spain
0.08
0.15
0,15
0.08
0.23
0.01
0,13
0%19
Sweden
0.24
0.31
0.30
0.24
0.40
-0.34
0%15
0%59
United Kingdom
0.30
0,11
0.32
0.29
0.22
-0.45
0.22
-0%03
0.00
0.10
0.13
0.00
0.19
-0.21
0.08
0%16
Bosnia and Herzegovina
-0.14
0.11
0.10
-0.14
0.34
-0.06
0.13
0.06
Macedonia
-0.11
0.04
0.17
-0.12
0.23
-0.05
-0.05
0.24
Norway
0.61
0.53
0.70
0.61
0.51
0.44
0.49
0.63
Russia
-0.81
-0.60
-0.27
-0.81
-0.46
-0.83
-0.55
-0.64
Switzerland
0.62
0.74
0.85
0.62
0.78
0.06
0.63
0.85
0.03
0.16
0.31
0.03
0.28
-0.09
0.13
0.23
Canada
0.33
0.32
0.51
0.33
0.41
-0.22
0.22
0.46
Puerto Rico
0.49
0.79
0.91
0.49
0.78
0.75
0.90
0.60
United States
0.22
0.14
0.54
0.22
0.26
-0.38
0.14
0.14
0.35
0.42
0.65
0.35
0.48
0.05
0.42
0.40
Average
<LIFG<$EFE<L)/
Average
NORTH AMERICA
Average
Note: In green are the most satisfied populations, and in red are the less satisfied populations.
67
Fifty-four economies29 agreed to participate in the noncompulsory questions of the special topic module. A very
brief analysis shown in Figure 5.3 relates to the scale
of work-life balance30. It is interesting that, for the three
stages, entrepreneurs exhibit more work-life balance
satisfaction than people not involved in entrepreneurial
activities. Highest rates among developing economies
are observed in Malawi, Philippines, Algeria and Ecuador,
and among developed economies in Italy and Puerto
Rico. The lowest rates are in Uganda and Mexico. Some
developed economies also exhibit fairly low work-life
balance assessments, including Korea and Belgium.
Women entrepreneurs are also more satisfied with their
work-life balance than men. Highest evaluations from
women entrepreneurs are from Ecuador and Trinidad and
Tobago. Lowest rates are from Mexico and Uganda. On
average, the entrepreneurs in efficiency-driven economies
exhibit higher degrees of satisfaction with their work-life
balance. Necessity-based entrepreneurs in innovation
driven economies, have the lowest degrees of work-life
balance. One possible explanation, which will require more
analysis, is that several necessity-based entrepreneurs in
innovation-driven economies that are living the economic
downturn were displaced from the job market compared to
employees, losing many of their privileges.
Figure 5.4 shows one indicator related to general work
satisfaction. This indicator is the average value of the
single question: “I am satisfied with my current work.”
The scale is 1 to 531%The indicators exhibit similar
behaviors to other indicators of well-being: entrepreneurs
in factor-driven economies have less satisfaction with
their activities. This is accentuated on necessity-based
entrepreneurs. Opportunity-based entrepreneurs average
18-64 population
0.15
0.10
68
TEA female
0.05
Early-stage entrepreneurial activity
(TEA)
0.00
-0.05
-0.10
TEA male
-0.15
TEA Necessity
Established business ownership
Non TEA or Established
TEA Opportunity
Factor-Driven Economies
Efficiency - Driven Economies
Innovation-Driven Economies
Algeria, Angola, Belgium, Bosnia and Herzegovina, Botswana, Canada, Chile, China, Colombia, Croatia, Ecuador, Estonia, Finland, France, Ghana,
Greece, Hungary, India, Indonesia, Iran, Israel, Italy, Jamaica, Japan, Korea, Latvia, Libya, Lithuania, Luxembourg, Macedonia, Malawi, Malaysia, Mexico,
Netherlands, Nigeria, Panama, Peru, Philippines, Portugal, Puerto Rico, Romania, Russia, Slovakia, Slovenia, South Africa, Spain, Suriname, Sweden,
Trinidad and Tobago, Uganda, United Kingdom, Uruguay, Vietnam and Zambia.
30
Principal component analyzes standardized scale adapted from Valcour (2007) original scale to three items and was described on footnote 26 in this
chapter.
31
Because the figure is not using a normalized scale, in order to show clear difference among the three stages, the scale only shows values from 3 to 4.5.
29
18-64 population
4.4
TEA female
4.2
4.0
Early-stage entrepreneurial activity
(TEA)
3.8
3.6
3.4
3.2
TEA male
3.0
Established business ownership
Non TEA or Established
TEA Necessity
TEA Opportunity
Factor-Driven Economies
Efficiency - Driven Economies
a little more work satisfaction than people not involved
in entrepreneurship activities. Again it is important to
emphasize that these results are exploratory and need
to be treated in this manner. Additional analysis with all
the variables included in the well-being special topic and
more detail of the economies will be presented in a further
specific report.
Finally, this section makes a brief analysis that correlates
with the NES´ variables related to well-being, as was
defined previously in this chapter. The analysis compares
the prevalence rate of subjective well-being among
individuals involved in TEA (from the GEM APS) against
similar evaluations made by experts in each participating
economy (from the GEM NES). This latest variable was
calculated in the similar way of NES EFCs (see Chapter
3) summarizing the two questions related to the life and
work satisfaction of entrepreneurs within a country. Figure
Innovation-Driven Economies
5.5 shows that there is a weak but positive relationship
between both variables. As was highlighted in Section
5.3, the perceived subjective well-being increases with
the degree of development. The counterpart of experts’
opinions also reflects this phenomenon: Experts from more
developed countries evaluate the general satisfaction with
the work and life of the entrepreneur with higher rates.
69
4.30
Experts evaluation of life and work satisfaction of the entrepreneurs
4.10
3.90
R2=0.2)
3.70
3.50
3.30
3.10
2.90
2.70
70
2.50
-1.5
-1
-0.5
0
Standardized rates of subjetive well-being of individuals involved in TEA
This preliminary assessment of entrepreneurship and
well-being opens the possibility to explore the role of the
women and men entrepreneurs beyond the traditional
notion of development generally associated with economic
indicators. As Layard (2003:3) claimed: “GDP is a hopeless
measure of welfare.” Therefore, the relationship between
GDP and entrepreneurship can explain only part of the
role of entrepreneurship in human development (Naude,
Amorós and Cristi, 2013).
0,5
1
71
human and social capital. However, the effect of their
financial capital on the likelihood to start a new business
does not vary across different institutional settings.
IMPLICATIONS
Dirk De Clercq, Dominic S.K. Lim and Chang Hoon Oh.
“Individual-level resources and new business activity: The
contingent role of institutional context.” Entrepreneurship
Theory and Practice, Volume 37, Issue 2, pages 303–330,
March 2013.
72
RESEARCH ISSUE
The new business creation process occurs across multiple
levels of society, influenced by individual-level factors
such as a person’s resources as well as country-level
institutions. Thus, the allocation of individual resources
to the exploitation of new business opportunities cannot
be considered in isolation from the broader institutional
context in which such opportunity exploitation takes
place. However, few studies have considered how the
combination of individual- and country-level factors
drives new business activity. This oversight has great
significance, in that individual resource endowments may
matter for new business creation, but so does whether
and how people share and complement their resources
effectively with those of other members of society. In
this study, Dirk De Clercq, Dominic Lim and Chang Hoon
Oh address this gap by investigating whether and how a
country’s institutional context is instrumental in channeling
individual-level resources from its members toward new
business activities.
THEORY AND METHOD
The researchers investigate the contingency effects
of a country’s formal and informal institutions on the
instrumentality of individual-level resources in people’s
engagement in new business activity. They theorize
that while formal institutions (entrepreneurship-friendly
financial and educational systems) increase the extent to
which individuals can complement their personal resources
(financial, human and social capital) with relevant
resources that reside in their institutional environment,
informal institutions (trust, lack of hierarchy and lack of
conservatism) increase the extent to which individual
resources are easily shared and distributed across actors.
The study combines data from GEM’s Adult Population
Survey and National Expert Survey with data from the
World Values Survey and Schwartz’ work on cultural values.
The analyses apply multilevel hierarchical logit regression
to a panel data set consisting of 181,450 observations from
32 economies spanning the 2003–2007 period.
FINDINGS
The study highlights that people’s access to
financial capital (household income), human capital
(entrepreneurship-specific knowledge) and social capital
(exposure to other entrepreneurs) enhances the likelihood
to start a new business. Further, a country’s institutions
significantly influence individuals’ leverage of both their
The study suggests that policymakers should take a
targeted approach to stimulate and sustain new business
activity by implementing specific policy tools to promote
new businesses, depending on the individual resource they
want to exploit the most. For example, when the emphasis
is on leveraging networks of entrepreneurs who live in close
proximity (for example social capital), the customization
of both the financial and educational systems to
support entrepreneurship and the promotion of trustbased relationships appears most effective. In cultures
characterized by high levels of hierarchy and conservatism,
government should focus not just on providing people with
easier access to different capital types but also to ensure
that external resources can be combined effectively with
the skills and experiences that aspiring entrepreneurs
already possess. Otherwise, their knowledge, even if
inherently useful for entrepreneurship, may be channeled
toward alternative activities that demand less effort and
confront less uncertainty.
GEM itself is a great example of social entrepreneurship.
It is the largest entrepreneurship research organization
anywhere in the world. It surely must be one of the largest
multi-national research projects in the business sciences
and probably the social sciences. Looking back at its
first few years, GEM was fortunate that it was started in
1997 when the world was gripped with entrepreneurial
fever because of the astounding things that Internet
entrepreneurs were doing. We were blessed to have
the Internet for facilitating our email communications;
for enabling us to use the Web for our research; and for
disseminating the results of our research. Also we were
fortunate that GEM was started when the Kauffman
Foundation was in its infancy and was looking for big
entrepreneurship projects that it could support; that the
Foundation was already a substantial benefactor of Babson
College; and that I and my late Babson colleague Jeff
Timmons were closely connected with the leaders of the
Foundation. GEM could not have been started at a better
time. As I like to say, there is no luck in entrepreneurship
except in the timing.
What turned out to be a major turning point occurred in the
late spring/early summer of 1998. Tony Blair became the
UK prime minister in 1997 and was keen to stimulate British
competitiveness. Michael Hay had good connections with
Tony Blair’s new administration, including connections to
Tony Blair himself. Michael arranged for LBS and Babson
to make a presentation on the preliminary GEM results to
a UK government seminar entitled “Enterprising Nation:
Building an Entrepreneurial Culture.” The seminar was
sponsored by the Chancellor of the Exchequer and the
President of the Board of Trade. It was attended by about
30 British opinion makers including three members of
Blair’s cabinet. The GEM delegation comprised Michael
Hay, Paul Reynolds, David Potter (Psion/Symbian), and me.
Our presentation and subsequent discussion were wellreceived by the policy makers. It gave us confidence that
GEM had potential—lots of potential. Equally important, it
was a boost to our raising money and recruiting additional
teams.
I want to thank everyone who has ever been involved with
GEM for building such an enduring organization. GEM
has published 15 Annual Global Reports and many special
reports. National teams have published almost 1000
national reports. Countries comprising about 95% of the
world’s GDP and more than two-thirds of its population
have participated in GEM. It’s amazing.
As GEM looks some things to consider are:
Quality of entrepreneurship. As the USA and many other
nations struggle to pull out of the slumping economies
that resulted from the banking collapse in 2008, there is
more and more concern about the quality of the jobs being
created—or perhaps I should say lack of quality. In the
USA for example, the unemployment rate has dropped
to its lowest level in 5 years. Unfortunately, the majority
of the new jobs are “low quality” because they are parttime and/or low paying. I wonder if the same applies to
entrepreneurship. What percent of new businesses are
part-time and/or in industries where wages and profits
are low? For example, about half of all the 29 million
businesses in the USA are part-time undertakings and
half are full-time. Only 6 million of them are employer
companies with one or more employees in addition to the
self-employed owner.
Internet and the Web. The Internet and the Web
have transformed entrepreneurship by creating
new opportunities and facilitating the way in which
entrepreneurs run their businesses. For example, almost
750,000 Americans reported that selling things on eBay
was their primary or secondary source of income in 2005.
Financing entrepreneurship. GEM in recent years has
not paid enough attention to the financing aspects of
entrepreneurship. It’s time to address this deficiency
in the APS, and to be bold and add topics such as
microfinance and crowdfinancing. The Venture Capital
Journal, for instance, recently devoted an entire edition to
crowdfinancing.
Vision. Bill Gates said that the vision thing is easy; it’s the
implementation that’s so hard. Michael Hay and I found
that out with GEM. Our early vision was to use GEM as the
basis for what I will call a “World Entrepreneurship Forum”
modeled along the lines of the World Economic Forum, but
not nearly as grand. So far our vision remains just that…
nothing but a vision. Now that GEM is well-established
and recognized worldwide, it would be wonderful if it could
move towards that vision.
* William D. Bygrave, B.A., Boston University; M.A., B.A., D.Phil., Oxford
University; M.B.A., Northeastern University; Ph.D. (hon), University
of Ghent; Ph.D. (hon), Glasgow Caledonian University. Dr. Bygrave
joined Babson College in 1993. He spent the 1992-1993 academic year
at INSEAD where he introduced an MBA course in Entrepreneurial
Finance and led a pan-European team from eight nations that studied
entrepreneurs’ attitudes toward realizing value and harvesting their
companies. One of the outcomes of that research was the initiative that
led to the founding of EASDAQ (the European equivalent of NASDAQ).
Dr. Bygrave has founded a venture-capital-backed high-tech company,
managed a division of a NYSE-listed high-tech company, co-founded a
pharmaceutical database company, and was a member of the investment
committee of a venture capital firm. He has written more than 50 papers
on topics that include venture capital, entrepreneurship, nuclear physics,
hospital pharmaceuticals, and philosophy of science. He is co-editor of
Entrepreneurship (2007); The Venture Capital Handbook (1999); The
Portable MBA in Entrepreneurship (third edition, 2003); among other
books, as serving as an editor of Entrepreneurship Theory and Practice.
73
Abendroth, A. and den Dulk, L. (2011). Support for the
work-life balance in Europe: The impact of state, workplace
and family support on work-life balance satisfaction. Work,
Employment and Society, 25(2), 234-256.
Acs, Z. J. (2006). How is entrepreneurship good for
economic growth? Innovations, 1(1), 97-107.
Acs, Z. J. and Amorós, J. E. (2008). Entrepreneurship and
competitiveness dynamics in Latin America. Small Business
Economics, 31(3), 305–322.
Acs, Z.J., and Audretsch, D.B. (2000). Innovation and small
firms. Cambridge: MIT Press.
Acs, Z. and Szerb, L. (2011). Global Entrepreneurship and
Development Index 2011. Cheltenham, UK: Edward Elgar
Publishing.
Agarwal, R., Barney, J., Foss, N. and Klein, P. (2009).
Heterogeneous Resources and the Financial Crisis:
Implications of Strategic Management Theory. Strategic
Organization, 7(4), 467-484.
74
Ajayi-Obe, O. and Parker, S.C. (2005). The changing nature
of work among self-employed in the 1990s: Evidence in
Britain. Journal of Labor Research, 26(3), 501-517.
Álvarez, C., Urbano, D. and Amorós, J.E. (2013) GEM
research: Achievements and challenges. Small Business
Economics, in press DOI 10.1007/s11187-013-9517-5.
Angner, E. (2010). Subjective well-being. Journal of SocioEconomics, 39, 361–368.
Audretsch (2007). Entrepreneurship Capital and Economic
Growth. Oxford Review of Economic Policy, 23(1), 63-78.
Autio, E. (2007). Global Entrepreneurship Monitor 2007
Global Report on High-Growth Entrepreneurship. London,
U.K: London Business School; and Babson Park, MA:
Babson College.
Baumol, W.J. (1990). Entrepreneurship: Productive,
Unproductive and Destructive. Journal of Political Economy,
98, 893–919.
Benz, M. and Frey, B. S. (2004). Being independent raises
happiness at work. Swedish Economic Policy Review, 11(2),
95–134.
Birch, D.L., (1979). The Job Generation Process.
Unpublished report prepared by the MIT Program on
Neighborhood and Regional Change for the Economic
Development Administration, U.S. Department of
Commerce, Washington, DC.
Blanchflower, D. G. (2004). Self-employment: More may
not be better. National Bureau of Economic Research.
Blau, D.M. (1987). A Time Series Analysis of Self
Employment in the United States. Journal of Political
Economy, 95(3), 445-467.
Block, J. and Koellinger, P. (2009). I can’t get no
satisfaction—Necessity entrepreneurship and procedural
utility. Kyklos, 62(2), 191- 20.
Blustein, D.L. (2008). The role of work in psychological
health and wellbeing. American Psychologist, 63, 228-240.
Boettke, P. and Coyne, C. (2003). Entrepreneurship and
Development: Cause or Consequence? Advances in
Austrian Economics, 6, 67-88.
Bosma, N. (2013). The Global Entrepreneurship Monitor
(GEM) and Its Impact on Entrepreneurship Research.
Foundations and Trends® in Entrepreneurship, 9(2), 143248.
Bosma, N. and Terjesen, S. (2014). The Impact of the
Global Economic Crises on Entrepreneurial Activity. Tjalling
C. Koopmans Research Institute Discussion Paper Series,
Utrecht University School of Economics, forthcoming.
Bosma, N., Wennekers, S. and Amorós, J.E. (2012). Global
Entrepreneurship Monitor 2011 Extended Report. Babson
College, Universidad del Desarrollo, Universiti Tun Abdul
Razak: Wellesley MA, Santiago Chile, Kuala Lumpur,
Malaysia.
Bosma, N., Wennekers, S.# Guerrero, M., Amorós, J.E.,
Martiarena, A. and Singer, S. (2013). GEM Special Report
On Entrepreneurial Employee Activity. Wellesley MA,
Santiago Chile, Kuala Lumpur, Malaysia: Babson College,
Universidad del Desarrollo, Universiti Tun Abdul Razak.
Bosma, N.S. (2011). Entrepreneurship, Urbanization
Economies and Productivity of European Regions, in M.F.
Fritsch (ed.). Handbook of Research on Entrepreneurship
and Regional Development, Cheltenham (UK);
Northampton, MA (USA): Edward Elgar, pp.,107-132.
Bosma, N.S. and Levie, J. (2010). Global Entrepreneurship
Monitor, 2009 Executive Report. Babson Park, MA, U.S.:
Babson College; Santiago, Chile: Universidad del Desarrollo;
Reykjavík, Iceland: Háskólinn Reykjavík University;
and London, U.K.: Global Entrepreneurship Research
Association.
Bosma, N.S. and Schutjens, V. (2011). Understanding
regional variation in entrepreneurial activity and
entrepreneurial attitude in Europe. The Annals of Regional
Science, 47(3), 711-742.
Bosma, N.S., Acs, Z., Autio, E., Coduras, A. and Levie, J.
(2009). Global Entrepreneurship Monitor 2008 Executive
Report. London Business School, London, UK, Universidad
del Desarrollo, Santiago, Chile, and Babson College,
Wellesley, MA, US.
Bosma, N.S., Jones, K., Autio, E. and Levie, J. (2008). Global
Entrepreneurship Monitor 2007 Executive Report. London:
Global Entrepreneurship Research Association.
Carree, M. and Verheul, I. (2012). What makes
entrepreneurs happy? Determinants of satisfaction among
founders. Journal of Happiness Studies, 13(2), 371–387.
Carree, M.A. and Thurik, A.R. (2003). The impact of
entrepreneurship on economic growth, in: Z.J. Acs and D.B.
Audretsch (eds.), Handbook of Entrepreneurship Research.
Boston: Kluwer Academic Publishers. pp.,437-471.
Conceição, P. and Bandura, R. (2008). Measuring
Subjective Wellbeing: A Summary Review of the Literature.
UNDP Development Studies Working Papers Series, May.
Online:http://web.undp.org/developmentstudies/docs/
subjective_wellbeing_conceicao_bandura.pdf.
Cooper, A.C. and Artz, K.W. (1995). Determinants of
satisfaction of entrepreneurs. Journal of Business Venturing,
10(6), 439–455.
Koellinger, P., and Thurik, R. (2012). Entrepreneurship and
the business cycle. The Review of Economics and Statistics,
94, 1143-1156.
Lange, T. (2012). Job satisfaction and self-employment:
Autonomy or personality. Small Business Economics, 38(2),
165–177.
Layard, R. (2003). Happiness: Has social science a clue?
What is happiness? Are we getting happier? In: Lionel
Robbins Memorial Lecture Series, 03-05 Mar 2003,
London, UK: London School of Economics.
Levie, J. and Autio, E. (2008). A theoretical grounding and
test of the GEM model. Small Business Economics, 31(3),
235-263.
Levie, J. and Autio, E. (2011). Regulatory Burden, Rule of
Law, and Entry of Strategic Entrepreneurs: An International
Panel Study. Journal of Management Studies, 48, 1392–1419.
McMullen, J.S. and Shepherd, D.A. (2006). Entrepreneurial
action and the role of uncertainty in the theory of the
entrepreneur. Academy of Management Review, 31,
132–152.
Diener, E. (1984). Subjective well-being. Psychological
Bulletin, 95, 542–575.
Gries, T. and Naudé, W. (2009). Entrepreneurship and
structural economic transformation. Small Business
Economics, 34 (1), 13-29.
Moscarini, G., and Poste-Vinay, F. (2012). The contribution
of large and small employers to job creation in times of
high and low unemployment. American Economic Review,
102(6), 2509-39.
Helliwell, J. F., Layard, R. and Sachs, J. (Eds.). (2013). World
Happiness Report. New York: UN Sustainable Development
Solutions Network.
Moskowitz, T. J. and Vissing-Jorgensen, A. (2002). The
Returns to Entrepreneurial Investment: A Private Equity
Premium Puzzle? American Economic Review, 92, 745-79.
Hessels, J., Grilo, I., Thurik, R. and Van der Zwan, P. (2010).
Entrepreneurial exit and entrepreneurial engagement.
Journal of Evolutionary Economics, 21(3), 447-471.
Naude, W. Amorós, J.E. and Cristi, O. (2013). Surfeiting,
the Appetite May Sicken: Entrepreneurship and Happiness.
Small Business Economics (Forthcoming).
Hausman, A., and Johnston, W. J. (2014). Timeline of a
financial crisis: Introduction to the special issue. Journal of
Business Research, 67(1), 2667–2670.
OECD (2009). The impact of the global crisis on SME and
entrepreneurship financing and policy responses. OECD:
Paris.
Kelley, D., Bosma, N. and Amorós, J. E. (2011). Global
Entrepreneurship Monitor, 2010 Global Report. Babson
Park MA, Santiago, Chile: Babson College, Universidad del
Desarrollo.
Parker, S.C. (2011). Introduction. In Parker, S. (Ed.)
Entrepreneurship in Recession. Cheltenham, UK: Edward
Elgar.
Kelley, D., Brush, C., Greene, P., and Litovsky, Y. (2013). GEM
2012 Women’s Report. Global Entrepreneurship Research
Association. Babson Center for Women’s Leadership:
Wellesley, MA.
Kew, J., Herrington, M., Litovsky, Y., and Gale, H. (2013).
GEM YBI Youth Report: The State Of Global Youth
Entrepreneurship. Cape Town: Global Entrepreneurship
Research Association / Youth Business International.
Klapper, L., and Love, I. (2011). The impact of the financial
crisis on new firm registration. Economic Letters, 113 (1),
1-4.
Pavot, W., and Diener, E. (2008). The Satisfaction with Life
Scale and the emerging construct of life satisfaction. Journal
of Positive Psychology, 3, 137–152.
Porter, M.E., Sachs, J.J., and McArthur, J. (2002). Executive
Summary: Competitiveness and Stages of Economic
Development. In The Global Competitiveness Report
2001–2002, edited by M.E. Porter, J.J. Sachs, P.K. Cornelius,
J.W. McArthur and K. Schwab, 16–25. New York, NY: Oxford
University Press.
Reynolds, P., Bosma, N., Autio, E., Hunt, S., De Bono, N.,
Servais, I.,Lopez-Garcia, P., and Chin, N. (2005). Global
Entrepreneurship Monitor: Data Collection Design and
Implementation 1998–2003. Small Business Economics, 24
(3), 205–31.
75
76
Reynolds, P., Hay, M. and Camp, S. (1999). Global
Entrepreneurship Monitor: 1999 Executive Report. Kansas
City, MO.: Kauffman Foundation.
Thurik, A.R., Stam, E. and Audretsch, D.B. (2013). The rise
of the entrepreneurial economy and the future of dynamic
capitalism. Technovation 33, 302–310.
Reynolds, P., Storey, D.J. and Westhead, P. (1994).
Cross-national comparisons of the variation in new firm
Formation Rates. Regional Studies, 28 (4), 443-456.
Thurow, L. (2003). Fortune favours the bold: What we
must do to build a new and lasting global prosperity. New
York: Harper Collins.
Sala-i-Martin, X., Blanke, J. DrzeniekHanouz, M. Geiger,
T. and Mia, I. (2010). The Global Competitiveness Index
2010—2011: Looking Beyond the Global Economic Crisis.
Valcour, M. (2007). Work-based resources as moderators
of the relationship between work hours and satisfaction
with work-family balance. Journal of Applied Psychology,
92(6), 1512-1523.
In K. Schwab (Ed.) The Global Competitiveness Report
2010–2011 (pp. 3-55). Geneva: World Economic Forum.
Schumpeter, J.A. (1942). Capitalism, socialism and
democracy, New York, NY: Harper and Row.
Van Stel, A., Carree, M., and Thurik, R. (2005). The effect
of entrepreneurial activity on national economic growth.
Small Business Economics, 24(3), 311-321.
Schwab, K. (Ed.) (2013). The Global Competitiveness
Report 2013-2014. Geneva, Switzerland: World Economic
Forum.
Wennekers, S. and Thurik, A.R. (1999). Linking
entrepreneurship and economic growth. Small Business
Economics, 13(1): 27-55.
Schwab, K. and Sachs, J., (1997). The Global
Competitiveness Report: 1997. Geneva, Switzerland: World
Economic Forum.
Wennekers, S., Van Stel, A., Carree, M., and Thurik, A.R.
(2010). The relationship between entrepreneurship and
economic development: Is it U-shaped? Foundations and
Trends in Entrepreneurship, 6(3), 167-237.
Schwab, K. and Sachs, J., (1998). The Global
Competitiveness Report: 1998. Geneva, Switzerland: World
Economic Forum.
Shane, S. (2009). Why encouraging more people to
become entrepreneurs is bad public policy, Small Business
Economics, 33, 141-149.
Spreitzer, G. M., Kizilos, M. A., and Nason, S. W. (1997).
A dimensional analysis of the relationship between
psychological empowerment and effectiveness satisfaction,
and strain. Journal of Management, 23(5), 679-704.
Stam, E., Bosma, N., Van Witteloostuijn, A., De Jong, J.,
Bogaert, S., Edwards, N. and Jaspers, F. (2012). Ambitious
Entrepreneurship. A review of the academic literature
and new directions for public policy. AWT Report. 41. The
Hague: AWT.
Sternberg, R., and Wennekers, S. (2005). Determinants
and effects of new business creation using global
entrepreneurship monitor data. Small Business Economics,
24(3), 193-203.
Stiglitz, J.E., Sen, A., and Fitoussi, J.P. (2009). Report
by the Commission on the Measurement of Economic
Performance and Social Progress. Available at http://www.
stiglitz-sen-fitoussi.fr/en/index.htm.
Taylor, M. (2004). Self-employment in Britain: When, who
and why? Swedish Economic Policy Review, 11(2), 139–173.
Terjesen, S., Lepoutre, J., Justo, R. and Bosma, N. (2012).
Global Entrepreneurship Monitor 2009 Report on Social
Entrepreneurship. Babson Park, MA, Santiago, Chile,
London: Babson College, Universidad del Desarrollo, Global
Entrepreneurship Research Association.
Wong, P. K., Ho, Y. P., and Autio, E. (2005).
Entrepreneurship, innovation and economic growth:
Evidence from GEM data. Small Business Economics,
24(3), 335-350
77
Stage 1: factor$
driven (includes
transition
\Zfefd`\j to
phase 2)
78
Stage 2:
efficiency$
driven
(includes
transition
\Zfefd`\j to
phase 3)
Media attention for
entrepreneurship
High status to
successful entrepreneurs
Entrepreneurship
as a good career
choice
Entrepreneurial
intentions **
Fear of
failure*
Perceived
capabilities
Perceived
opportunities
Economies
Algeria
61.9
55.5
32.9
36.0
79.6
84.2
47.4
Angola
56.7
56.3
63.7
38.3
66.8
72.6
62.1
Botswana
65.9
67.4
18.6
59.2
80.7
83.7
85.6
Ghana
69.3
85.8
24.6
45.6
81.6
94.1
82.4
India
41.4
55.8
38.9
22.8
61.5
70.4
61.4
Iran
37.0
56.5
36.4
30.6
64.1
82.4
59.9
Libya
52.3
58.6
33.0
62.1
85.2
84.3
38.2
Malawi
78.9
89.5
15.1
66.7
Nigeria
84.7
87.0
16.3
46.8
81.2
61.9
76.5
Philippines
47.9
68.4
36.2
44.1
84.9
79.3
86.8
Uganda
81.1
83.8
15.0
60.7
88.3
95.3
87.5
Vietnam
36.8
48.7
56.7
24.1
63.4
81.5
80.5
Zambia
76.8
79.6
15.4
44.5
66.5
71.2
69.0
Average
(unweighted)
60.8
68.7
31.0
44.7
75.3
80.1
69.8
Argentina
40.9
61.7
24.9
31.0
Bosnia and
Herzegovina
23.3
50.5
26.1
21.8
82.3
71.9
39.2
Brazil
50.9
52.6
38.7
27.2
84.6
82.2
84.1
Chile
68.4
59.6
28.0
46.5
69.1
67.2
66.3
China
33.1
36.3
34.3
14.4
69.6
73.5
71.3
Colombia
67.7
57.8
31.8
54.5
90.9
71.4
67.5
Croatia
17.6
47.2
35.2
19.6
61.5
43.1
42.9
Ecuador
57.3
74.3
34.9
39.9
66.5
67.7
79.1
Estonia
46.1
40.0
38.8
19.4
53.2
58.6
40.7
Guatemala
58.8
66.4
33.3
39.0
86.8
71.5
55.1
Hungary
18.9
37.5
44.8
13.7
45.7
74.1
28.4
Indonesia
46.7
62.0
35.2
35.1
70.8
79.8
75.3
Jamaica
51.2
79.1
27.0
39.5
79.4
80.9
81.7
Latvia
34.8
47.8
41.6
22.7
61.4
59.5
58.6
Lithuania
28.7
35.4
41.7
22.4
68.6
57.2
47.6
Macedonia
37.2
49.7
35.6
29.1
69.5
67.9
66.8
Malaysia
40.7
28.0
33.3
11.8
41.8
45.0
62.2
Mexico
53.6
58.5
31.6
16.9
57.8
62.3
50.8
Panama
58.7
66.4
28.9
27.0
64.4
59.2
70.4
Peru
61.0
62.2
25.7
33.9
70.4
71.2
71.5
Stage 3:
innovation$
driven
Media attention for
entrepreneurship
High status to
successful entrepreneurs
Entrepreneurship
as a good career
choice
Entrepreneurial
intentions **
Fear of
failure*
Perceived
capabilities
Perceived
opportunities
Economies
Poland
26.1
51.8
46.7
17.3
66.8
59.9
58.5
Romania
28.9
45.9
37.3
23.7
73.6
72.6
61.3
Russia
18.2
28.2
29.0
2.6
65.7
68.0
49.0
Slovakia
16.1
51.0
33.2
16.4
49.2
58.5
51.7
South Africa
37.9
42.7
27.3
12.8
74.0
74.7
78.4
Suriname
52.7
53.5
24.4
13.1
75.6
79.3
65.9
Thailand
45.3
44.4
49.3
18.5
74.5
74.8
77.2
Uruguay
47.9
61.1
26.9
25.3
58.1
56.0
57.5
Average
(unweighted)
41.7
51.8
33.8
24.8
67.8
67.0
61.4
Belgium
31.5
33.8
46.6
7.8
54.8
52.2
43.9
Canada
57.4
48.5
35.2
13.5
60.6
70.1
69.6
Czech Republic
23.1
42.6
35.8
13.7
Finland
43.8
33.3
36.7
8.3
44.3
85.5
68.5
France
22.9
33.2
41.1
12.6
55.3
70.0
41.4
Germany
31.3
37.7
38.6
6.8
49.4
75.2
49.9
Greece
13.5
46.0
49.3
8.8
60.1
65.1
32.4
Ireland
28.3
43.1
40.4
12.6
49.6
81.2
59.9
Israel
46.5
36.2
51.8
24.0
60.6
80.3
49.1
Italy
17.3
29.1
48.6
9.8
65.6
72.4
48.1
Japan
7.7
12.9
49.4
4.1
31.3
52.8
57.6
Korea, Republic of
12.7
28.1
42.3
12.1
51.3
67.8
67.6
Luxembourg
45.6
43.3
42.9
14.1
39.4
70.6
36.3
Netherlands
32.7
42.4
36.8
9.1
79.5
66.2
55.2
Norway
63.7
34.2
35.3
5.2
49.3
75.5
56.9
Portugal
20.2
48.7
40.1
13.2
Puerto Rico
28.3
53.0
24.6
13.1
17.9
50.1
68.8
Singapore
22.2
24.8
39.8
15.1
50.9
59.4
75.3
Slovenia
16.1
51.5
29.6
12.4
57.4
68.1
50.5
Spain
16.0
48.4
36.3
8.4
54.3
52.3
45.6
Sweden
64.4
38.8
36.6
9.5
52.0
71.5
58.5
Switzerland
41.5
44.7
28.2
9.8
40.5
65.0
47.8
Taiwan
42.0
27.2
40.7
27.8
73.0
64.5
87.1
Trinidad and Tobago
58.0
75.3
19.8
28.7
79.5
72.0
61.0
United Kingdom
35.5
43.8
36.4
7.2
54.1
79.3
49.6
United States
47.2
55.7
31.1
12.2
Average
(unweighted)
33.4
40.6
38.2
12.3
53.5
67.3
55.7
47.8
79
Stage 1: factor$
driven (includes
transition
\Zfefd`\jto
phase 2)
80
Improvement-driven
opportunity
(% of TEA)
Necessity-driven
(% of TEA)
Discontinuation
of Business
Established
business
ownership rate
Early-stage
Entrepreneurial
activity (TEA)
New Business
ownership
rate
Algeria
2.2
2.6
4.9
5.4
3.3
21.3
62.3
Angola
8.0
14.7
22.2
8.5
24.1
26.1
40.3
Botswana
11.0
10.2
20.9
3.4
17.7
26.3
52.0
Ghana
8.5
17.7
25.8
25.9
8.3
33.3
44.1
India
5.1
4.9
9.9
10.7
1.5
38.8
35.9
Iran
6.4
6.1
12.3
10.6
5.7
38.0
35.8
Libya
6.6
4.7
11.2
3.4
8.1
8.1
60.3
Malawi
10.1
18.8
28.1
12.0
30.2
43.7
29.4
Nigeria
20.0
20.7
39.9
17.5
7.9
25.4
52.3
Philippines
12.0
6.7
18.5
6.6
12.3
43.6
38.0
Uganda
5.6
20.0
25.2
36.1
20.1
25.1
47.5
Vietnam
4.0
11.5
15.4
16.4
4.2
25.1
62.2
Zambia
22.6
18.0
39.9
16.6
19.8
38.8
37.2
9.4
12.0
21.1
13.3
12.6
30.3
46.0
Total
Stage 2:
efficiency$
driven
(includes
transition
\Zfefd`\j to
phase 3)
Nascent
Entrepreneurship
rate
Economies
10.5
5.6
15.9
9.6
5.5
29.8
47.4
Bosnia and
Herzegovina
Argentina
5.8
4.6
10.3
4.5
6.2
58.9
22.0
Brazil
5.1
12.6
17.3
15.4
4.7
28.6
57.4
Chile
15.4
9.6
24.3
8.5
7.6
20.1
57.7
China
5.2
8.9
14.0
11.0
2.7
33.9
35.9
13.6
10.3
23.7
5.9
5.4
18.1
26.7
Croatia
6.3
2.0
8.3
3.3
4.5
37.4
29.8
Ecuador
25.3
13.6
36.0
18.0
8.3
33.6
32.1
Colombia
Estonia
8.8
4.5
13.1
5.0
2.1
14.8
50.1
Guatemala
7.6
4.9
12.3
5.1
3.0
31.4
44.2
Hungary
6.0
3.7
9.7
7.2
2.9
28.0
38.7
Indonesia
5.7
20.4
25.5
21.2
2.4
25.4
43.7
Jamaica
8.0
6.0
13.8
6.3
7.4
40.6
34.2
Latvia
8.1
5.3
13.3
8.8
3.5
21.2
52.7
Lithuania
6.1
6.4
12.4
8.3
3.5
23.3
55.2
Macedonia
3.4
3.5
6.6
7.3
3.3
61.0
22.9
Malaysia
1.5
5.2
6.6
6.0
1.5
18.4
64.9
Mexico
11.9
3.3
14.8
4.2
6.6
6.7
26.3
Panama
15.4
5.2
20.6
3.5
3.4
18.6
39.8
Peru
17.8
5.9
23.4
5.4
4.2
22.5
54.2
Stage 3:
innovation$
driven
Improvement-driven
opportunity
(% of TEA)
Necessity-driven
(% of TEA)
Discontinuation
of Business
Established
business
ownership rate
Early-stage
Entrepreneurial
activity (TEA)
New Business
ownership
rate
Nascent
Entrepreneurship
rate
Economies
Poland
5.1
4.3
9.3
6.5
4.0
47.4
32.7
Romania
6.2
4.2
10.1
5.3
4.3
31.6
31.6
Russia
3.0
2.8
5.8
3.4
1.6
35.4
42.0
Slovakia
6.1
3.6
9.5
5.4
5.5
40.2
40.2
South Africa
6.6
4.0
10.6
2.9
4.9
30.3
31.5
Suriname
3.9
1.3
5.1
1.7
0.8
17.8
57.6
Thailand
7.9
10.4
17.7
28.0
3.5
18.7
67.8
Uruguay
8.5
5.7
14.1
4.9
3.4
12.0
36.8
Total
8.4
6.4
14.4
8.0
4.2
28.8
42.0
Belgium
3.1
1.9
4.9
5.9
1.9
29.0
43.9
Canada
7.8
4.7
12.2
8.4
4.4
15.1
66.9
Czech Republic
4.9
2.7
7.3
5.3
3.4
22.7
60.3
Finland
2.7
2.7
5.3
6.6
2.0
17.9
66.0
France
2.7
1.8
4.6
4.1
1.9
15.7
60.9
Germany
3.1
2.0
5.0
5.1
1.5
18.7
55.7
Greece
3.3
2.3
5.5
12.6
5.0
23.5
35.8
Ireland
5.5
3.8
9.2
7.5
2.5
18.0
43.8
Israel
5.3
4.8
10.0
5.9
4.8
17.4
49.2
Italy
2.4
1.1
3.4
3.7
1.9
18.7
18.4
Japan
2.2
1.5
3.7
5.7
1.5
25.0
59.6
Korea, Republic of
2.7
4.2
6.9
9.0
2.5
36.5
51.1
Luxembourg
6.0
2.8
8.7
2.4
2.8
5.6
56.6
Netherlands
4.7
4.8
9.3
8.7
2.1
8.0
67.1
Norway
2.9
3.4
6.3
6.2
1.6
4.0
60.8
Portugal
4.2
4.2
8.2
7.7
2.8
21.4
50.7
Puerto Rico
6.6
1.8
8.3
2.0
1.8
21.5
42.9
Singapore
6.4
4.4
10.7
4.2
3.3
8.4
68.8
Slovenia
3.6
2.9
6.5
5.7
2.6
24.1
53.4
Spain
3.1
2.2
5.2
8.4
1.9
29.2
33.2
Sweden
5.9
2.5
8.2
6.0
2.4
9.7
58.4
Switzerland
4.5
3.7
8.2
10.0
2.3
7.5
67.2
Taiwan
3.3
5.0
8.2
8.3
5.0
28.7
45.8
Trinidad and Tobago
11.4
8.5
19.5
11.4
4.1
11.2
76.0
United Kingdom
3.6
3.6
7.1
6.6
1.9
16.1
45.2
United States
9.2
3.7
12.7
7.5
3.8
21.2
57.4
TOTAL
4.7
3.3
7.9
6.7
2.8
18.3
53.7
81
REGION
Economies
Latin America Argentina
& Caribbean
Brazil
Asia Pacific &
South Asia
MALE TEA
Opportunity
(% of TEA
males)
FEMALE TEA
Opportunity
(% of TEA
females)
MALE TEA
Necessity (%
of TEA males)
FEMALE TEA
Necessity (% of
TEA females)
13%
76%
60%
24%
38%
17%
17%
76%
66%
23%
34%
Chile
30%
19%
82%
68%
15%
28%
Colombia
30%
17%
86%
71%
13%
27%
Ecuador
39%
33%
69%
56%
28%
41%
Guatemala
14%
11%
73%
63%
27%
36%
Jamaica
15%
12%
63%
42%
32%
51%
Mexico
17%
13%
50%
50%
8%
6%
Panama
24%
17%
83%
76%
15%
23%
Peru
27%
20%
80%
69%
19%
27%
7%
3%
76%
86%
21%
11%
Trinidad and
Tobago
23%
16%
88%
88%
12%
11%
Uruguay
20%
9%
90%
78%
8%
20%
Average
(unweighted)
22%
15%
76%
67%
19%
27%
Middle East & Algeria
North Africa
Iran
Sub-Saharan
Africa
FEMALE
TEA (% of
adult female
population)
19%
Suriname
82
MALE TEA
(% of adult
male population)
6%
3%
68%
73%
22%
20%
18%
6%
62%
60%
37%
39%
Israel
14%
7%
76%
79%
18%
16%
Libya
15%
7%
90%
95%
9%
5%
Average
(unweighted)
13%
6%
74%
76%
22%
20%
Angola
24%
20%
72%
70%
24%
28%
Botswana
22%
20%
78%
65%
18%
34%
Ghana
23%
28%
74%
59%
24%
40%
Malawi
29%
27%
64%
48%
36%
51%
Nigeria
39%
41%
74%
74%
26%
25%
South Africa
12%
9%
72%
65%
27%
35%
Uganda
25%
25%
79%
70%
20%
30%
Zambia
39%
41%
59%
55%
37%
41%
Average
(unweighted)
27%
26%
71%
63%
27%
35%
China
16%
12%
70%
58%
28%
41%
India
13%
6%
58%
58%
40%
37%
Indonesia
26%
25%
76%
73%
24%
27%
Japan
5%
3%
73%
63%
20%
34%
10%
4%
60%
63%
37%
34%
8%
5%
78%
87%
22%
13%
Philippines
19%
18%
60%
52%
40%
48%
Singapore
13%
8%
89%
91%
9%
8%
Taiwan
11%
5%
72%
71%
28%
29%
Korea,
Republic of
Malaysia
MALE TEA
(% of adult
male population)
REGION
Europe –
EU28
North
America
FEMALE TEA
Opportunity
(% of TEA
females)
MALE TEA
Necessity (%
of TEA males)
FEMALE TEA
Necessity (% of
TEA females)
18%
17%
83%
74%
14%
24%
Vietnam
17%
14%
75%
75%
25%
25%
Average
(unweighted)
14%
11%
72%
69%
26%
29%
Belgium
6%
3%
63%
54%
28%
31%
Croatia
11%
5%
63%
54%
34%
44%
Czech
Republic
10%
4%
78%
71%
21%
27%
Estonia
17%
9%
81%
75%
13%
18%
Finland
7%
4%
70%
78%
21%
12%
France
6%
3%
82%
76%
16%
14%
Germany
6%
4%
78%
74%
19%
18%
Greece
8%
3%
78%
68%
22%
27%
Hungary
12%
7%
79%
54%
20%
42%
Ireland
12%
6%
79%
78%
19%
17%
5%
2%
80%
62%
16%
26%
17%
10%
77%
78%
21%
22%
Lithuania
17%
8%
77%
71%
21%
28%
Luxembourg
12%
6%
80%
71%
5%
7%
Netherlands
12%
7%
89%
83%
7%
9%
Poland
12%
6%
50%
46%
46%
51%
Portugal
11%
6%
77%
72%
21%
22%
Romania
12%
8%
67%
67%
33%
30%
Slovakia
12%
7%
52%
70%
47%
29%
Slovenia
9%
4%
75%
65%
23%
25%
Spain
6%
4%
69%
64%
27%
33%
Sweden
10%
6%
82%
83%
9%
10%
United
Kingdom
9%
6%
82%
77%
14%
20%
Average
(unweighted)
10%
6%
74%
69%
22%
24%
Bosnia and
Herzegovina
13%
7%
46%
31%
54%
69%
Macedonia
9%
4%
36%
31%
61%
61%
Norway
9%
4%
92%
86%
6%
0%
Latvia
EU28
MALE TEA
Opportunity
(% of TEA
males)
Thailand
Italy
Europe – Non
FEMALE
TEA (% of
adult female
population)
Russia
6%
5%
63%
59%
37%
34%
Switzerland
8%
8%
85%
89%
10%
4%
Average
(unweighted)
9%
6%
64%
59%
33%
34%
15%
10%
83%
78%
13%
18%
Canada
Puerto Rico
11%
6%
77%
77%
22%
21%
United States
15%
10%
73%
74%
23%
18%
Average
(unweighted)
13%
9%
77%
76%
19%
19%
83
0 - 5 jobs
(% adult population)
REGION
5 - 19 jobs
(% adult population)
20 or more jobs
(% adult population)
Economies
Latin America
& Caribbean
Argentina
0%-
2%7
1%4
Brazil
12%7
1%3
0%4
Chile
13%2
5%6
3%1
Colombia
8%0
7%1
6%6
25%5
5%3
1%3
Guatemala
4%0
0%4
0%1
Jamaica
4%3
0%6
0%3
Mexico
4%3
3%2
0%1
Panama
16%2
2%2
0%6
Peru
12%8
4%2
0%7
1%9
0%3
0%0
10%4
4%2
2%0
6%7
2%3
1%6
10%0
3%0
1%4
Algeria
2%4
0%1
0%5
Iran
5%5
2%0
1%4
Israel
4%5
1%6
1%4
Libya
4%1
2%1
1%6
Average
(unweighted)
4%1
1%5
1%2
Angola
5%0
3%3
0%8
Botswana
10%8
4%2
2%7
Ghana
20%2
2%1
0%7
Malawi
24%7
0%2
0%1
Nigeria
19%0
7%9
2%4
6%4
1%8
1%1
Ecuador
Suriname
Trinidad and
Tobago
Uruguay
Average
(unweighted)
84
Middle East &
North Africa
Sub-Saharan
Africa
South Africa
Asia Pacific &
South Asia
Uganda
23%4
1%4
0%4
Zambia
33%5
1%8
0%0
Average
(unweighted)
17%9
2%8
1%0
China
7%0
2%1
1%7
India
4%4
0%7
0%1
Indonesia
12%6
0%9
0%2
Japan
1%7
0%6
1%0
Korea,
Republic of
4%3
1%1
0%8
Malaysia
5%6
0%9
0%1
Philippines
15%2
0%8
0%3
Singapore
4%6
2%9
2%5
Taiwan
3%3
1%8
2%5
0 - 5 jobs
(% adult population)
REGION
5 - 19 jobs
(% adult population)
20 or more jobs
(% adult population)
Economies
Europe –
EU28
Thailand
12%9
2%2
0%7
Vietnam
9%5
2%4
2%0
Average
(unweighted)
7%4
1%5
1%1
Belgium
3%5
0%7
0%4
Croatia
3%2
1%5
1%0
Czech
3%5
1%2
0%9
Estonia
6%5
2%7
0%8
Finland
3%9
0%7
0%4
France
3%0
0%7
0%2
Republic
Europe – Non
EU28
North
America
Germany
3%0
0%6
0%5
Greece
2%8
0%2
0%2
Hungary
6%0
1%2
1%4
Ireland
5%0
2%1
1%1
Italy
2%5
0%2
0%2
Latvia
4%5
2%8
2%8
Lithuania
4%5
2%7
1%7
Luxembourg
4%0
1%2
0%5
Netherlands
6%9
0%8
0%5
Poland
3%9
2%4
1%2
Portugal
4%5
1%4
0%8
Romania
3%4
2%7
1%8
Slovakia
4%4
1%6
1%2
Slovenia
2%8
1%5
0%7
Spain
3%6
0%5
0%2
Sweden
6%1
0%5
0%7
United
Kingdom
4%2
0%9
0%8
Average
(unweighted)
4%2
1%3
0%9
Bosnia and
Herzegovina
3%8
2%6
1%0
Macedonia
2%9
1%1
0%9
Norway
4%2
0%7
0%5
Russia
2%0
1%0
0%5
Switzerland
5%2
1%0
0%3
Average
(unweighted)
3%6
1%3
0%7
Canada
6%4
2%5
1%6
Puerto Rico
6%1
1%1
0%0
United State
6%6
2%2
1%7
Average
(unweighted)
6%4
1%9
1%1
85
Team
86
Algeria
Face-to-face Interviews
2500
Angola
Face-to-face Interviews
2146
Argentina
Fixed Line Telephone
2200
Belgium
Fixed Line and Mobile Telephone
2001
Bosnia and
Herzegovina
Fixed Line Telephone
2004
Botswana
Face-to-face Interviews
2204
Brazil
Face-to-face Interviews
10000
Canada
Fixed Line and Mobile Telephone
Chile
Face-to-face and Fixed Line and Mobile Telephone
6703
China
Face-to-face Interviews
3634
Colombia
Fixed Line Telephone
3400
Croatia
Fixed Line Telephone
2000
Czech Republic
Mobile Telephone
5009
Ecuador
Face-to-face Interviews
2030
Estonia
Fixed Line and Mobile Telephone
2004
Finland
Mobile Telephone
2005
France
Fixed Line Telephone
2002
Germany
Mobile Telephone
5996
Ghana
Face-to-face Interviews
2100
Greece
Fixed Line Telephone
2000
Guatemala
Face-to-face Interviews
Hungary
Mobile Telephone
2000
India
Face-to-face Interviews
3000
Indonesia
Face-to-face Interviews
4500
Iran
Face-to-face Interviews
3637
Ireland
Fixed Line and Mobile Telephone
2002
Israel
Fixed Line and Mobile Telephone
2039
Italy
Fixed Line Telephone
2052
Jamaica
Face-to-face Interviews
2246
Japan
Fixed Line Telephone
2000
Korea, Republic of
Fixed Line Telephone
2000
Latvia
Mobile Telephone
2000
Libya
Face-to-face Interviews
2246
Lithuania
Fixed Line and Mobile Telephone
2000
Luxembourg
Fixed Line and Online Panel
2005
Macedonia
Fixed Line and Mobile Telephone
2000
Malawi
Face-to-face Interviews
2094
Malaysia
Face-to-face Interviews
2000
Mexico
Face-to-face Interviews
2801
Netherlands
Fixed Line and Mobile Telephone
3005
Nigeria
Face-to-face Interviews
2604
Norway
Fixed Line and Mobile Telephone
2000
Panama
Face-to-face Interviews
2004
Peru
Face-to-face Interviews
2075
3286
2142
Team
Philippines
Face-to-face Interviews
2500
Poland
Fixed Line and Mobile Telephone
2000
Portugal
Fixed Line and Mobile Telephone
2003
Puerto Rico
Face-to-face Interviews
2000
Romania
Fixed Line and Mobile Telephone
2021
Russia
Face-to-face Interviews
2029
Singapore
Fixed Line Telephone
2000
Slovakia
Mobile Telephone
2007
Slovenia
Fixed Line and Mobile Telephone
2002
South Africa
Face-to-face Interviews
3450
Spain
Fixed Line Telephone
Suriname
Face-to-face Interviews
2290
Sweden
Fixed Line and Mobile Telephone and Online Panel
2506
Switzerland
Fixed Line and Mobile Telephone
2003
Taiwan
Fixed Line Telephone
2007
Thailand
Face-to-face and Fixed Line Telephone
2362
Trinidad Xe[ Tobago
Face-to-face Interviews
2036
Turkey
Fixed Line and Mobile Telephone
Uganda
Face-to-face Interviews
2513
United Kingdom
Fixed Line and Mobile Telephone
11017
Ue`k\[JkXk\j
Fixed Line and Mobile Telephone
5698
Uruguay
Fixed Line Telephone
2010
Vietnam
Face-to-face Interviews
2000
Zambia
Face-to-face Interviews
2099
24600
87
Sociedade Portuguesa
de Inovação (SPI)
Angola
Belgium
Vlerick Business School
Hans Crijns
Niels Bosma
Tine Holvoet
Jeff Seaman
The Cave Hill School of Marjorie Wharton
Business, The University Donley Carrington
of the West Indies
Jeannine Comma
Jason Marshall
Camara Lee
Barbados
Silvia Torres Carbonell
Aranzazu Echezarreta
Juan Martin Rodriguez
IAE Business School
Argentina
Manuel Alves da Rocha
Salim Abdul Valimamade
Abderrahmane Abedou
Ahmed Bouyacoub
Hamid Kherbachi
Boukahri Mohamed
Marita Riedel
Marcus Antonius Casel
Augusto Medina
Douglas Thompson
Nuno Gonçalves
CREAD
Algeria
Centro de Estudos e
Investigação Científica
(CEIC) of the Universidade Católica de
Angola (UCAN)
National Team Members
Institution
Team
EWI (Department of Economy, Science and Innovation)
STORE (Flemish Research
Organisation for Entrepreneurship and Regional
Economy)
First Citizens Bank Ltd
International Development
Research Centre (IDRC)
Buenos Aires City Government – Economic Development Ministry
International Development
Research Centre (IDRC)
BFA – Banco de Fomento
Angola, S.A.R.L.
German Development Cooperation (Deutsche Gesellschaft fuer Internationale
Zusammenarbeit, GIZ)
Funders
88
TNS Dimarso
Systems Consulting Ltd
MORI Argentina
SINFIC, Sistemas de Informação
Industriais, S.A.
CREAD
APS Vendor
[email protected]
[email protected]
[email protected]
[email protected]
[email protected]
[email protected]
[email protected]
Contact
Centre for Entrepreneurship Development
Tuzla (in partnership
with University of Tuzla)
University of Botswana
Instituto Brasileiro da
Qualidade e Produtividade (IBQP)
Herzegovina
Botswana
Brazil
Bosnia and
Simara Maria de Souza Silveira
Greco
Adriano Luiz Antunes
Kristie Seawright
Marco Aurélio Bedê
Mariano Mato Macedo
Mario Tamada Neto
Morlan Luigi Guimarães
Tales Andreassi
C.R. Sathyamoorthi
B. Kealesitse
J. Pansiri
R. Makgosa
S. Biza-Khupe
T. Mphela
R. Morakanyane
T. Ditshweu
T. Tsheko
L. Setswalo
I. Radikoko
Bahrija Umihani
Mirela Omerovi
Aziz Šunje
Rasim Tulumovi
Kenan Crnk
Zdenko Klepi
Ranko Markuš
SlaÐana Simi
Majda Mujanov
GEM Botswana Team
Zoom Serviços Administrativos
Ltda
International Development
Research Centre (IDRC)
Serviço Brasileiro de Apoio
às Micro e Pequenas Empresas - SEBRAE
Instituto de Tecnologia do
Paraná - TECPAR
Universidade Federal do
Paraná - UFPR
Fundação Getúlio Vargas FGV-EAESP
IPSOS d.o.o. Sarajevo
Centre for Entrepreneurship
Development Tuzla
Federal Ministry of Entrepreneurship, Development and
Crafts
Ministry of Development
and Entrepreneurship of
Tuzla Canton
Oxfam
Independent Office for Development (NBR)
Local Economic Development Network (LEDnet)
Swiss Agency for Development and Cooperation (Youth Employment Project)
89
[email protected]
[email protected]
[email protected]
EXk_Xe>i\`[Xelj
University of Manitoba
José Ernesto Amorós
Carlos Poblete
Carlos Albornoz
Gianni Romani
Universidad Arturo Prat
Chris Street
University of Regina
Universidad del
Desarrollo
Región de
Tarapacá
8[Xd?fcYiffb
9i`XeN`ok\[
9cX`iN`ejfi
CPROST, Simon Fraser
University
Mauricio Vega
Fernando Rosales
Paula González
Vesna Karmelic
Roberto Gamboa
Dante Choque
Hernando Bustos
Ximena Vega
Ted Heidrick
University of Alberta
Universidad de
Tarapacá
Langford
University of Saskatchewan
Cami RyanCooper
Etienne St-Jean
Université du Québec à
Trois-Rivières
Telefónica Chile: Movistar
Innova & Wayra
SOFOFA (Federation of
Chilean Industry)
InnovaChile Corfo
Ministerio de Economía
Government of Alberta
Government of Ontario
Government of Newfoundland
Government of Manitoba
Government of Quebec
Innovation Saskatchewan
Institut de recherche sur les
PME
International Development
Research Centre (IDRC)
International Institute for
Sustainable Development
Stu Clark Centre for Entrepreneurship, University of
Manitoba
University of Alberta
EY
Charles Davis
Dave Valliere
Howard Lin
Neil Wolff
Ip\ijfeLe`m\ij`kp
Gary Gorman
Dennis Hanlon
D\dfi`XcLe`m\ij`kp
Kclh$Le`m\ij`k[lHlY\Z ;`Xe\$>XYi`\cc\Ki\dYcXp
Chad Saunders
University of Calgary
Funders
Listed in alphabetical order:
Atlantic Canada Opportunities Agency
British Columbia Innovation
Council
Canadian Youth Business
Foundation
Peter Josty
National Team Members
The Centre for Innovation
Studies (THECIS)
Institution
Región de Arica
y Parinacota
Regional Teams
Chile
Canada
Team
90
Questio, Estudios de Mercado y
Opinion Limitada
Opinion Search Inc.
APS Vendor
[email protected]
[email protected]
Contact
Universidad Católica del Karla Soria
Norte
Universidad Técnico
Región de
Coquimbo
Región de
Valparaíso
Universidad Católica
de la Santísima
Concepción
Universidad del
Desarrollo
Universidad de la
Frontera
Tsinghua University
Universidad Icesi
Región del
Biobío
Región de la
Araucanía
China
Colombia
Pontificia Universidad
Javeriana Cali
Universidad de los Andes
Universidad del Norte
Universidad del
Desarrollo
I. Municipalidad de
Peñalolén
Región
Metropolitana
Federico SantaMaría
Corporación para la
Competitividad e
Innovación de la Región
de Atacama
Región de
Atacama
Universidad Icesi
Rodrigo Varela Villegas
Jhon Alexander Moreno
Monica Bedoya
Rafael Augusto Vesga
Liyis Gómez
Ignacio Negrette
Juan Guillermo Restrepo
Fernando Pereira
Fabian Osorio
Ana Maria Fierro
Pontificia Universidad
Javeriana Cali
Universidad del Norte
Universidad de los Andes
School of Economics and
Management, Tsinghua
University
Gao Jian
Qin Lan
Jiang Yanfu
Cheng Yuan
Li Xibao
Claudina Uribe
Paulina Sanhueza
Valeska Geldres
Jorge Espinoza
José Ernesto Amorós
Carlos Poblete
José Ernesto Amorós
Carlos Poblete
Hanja Yutronic Ordenes
Cristóbal Fernández
Jorge Cea
José Luis Cortés
Juan Tapia
Paulina Santander
Carolina Blanco
Universidad Católica del Gianni Romaní
Miguel Atienza
Norte
Región de
Antofagasta
91
[email protected]
[email protected]
SINOTRUST International Information & Consulting (Beijing)
Co., Ltd.
Centro Nacional de Consultoría
J.J. Strossmayer
University Osijek,
Faculty of Economics
Croatia
Martin Lukes
Martina Jakl
Jan Zouhar
Jan Mares
Slavica Singer
Nataša Šarlija
Sanja Pfeifer
Suncica Oberman Peterka
Mirna Oberman
National Team Members
Estonian Development
Fund
Turku School of
Economics,
University of Turku
EMLYON Business
School
Leibniz Universität
Hannover
Institute for
EmploymentResearch
(IAB) of the German
Federal Employment
Agency (BA)
Finland
France
Germany
Udo Brixy
Arne Vorderwülbecke
Rolf Sternberg
Alain Fayolle
Emeran Nziali
Danielle Rousson
Anne Kovalainen
Jarna Heinonen
Tommi Pukkinen
Pekka Stenholm
Sanna Suomalainen
Tõnis Arro
Tõnis Mets
Tiit Elenurm
ESPOL- ESPAE Graduate Virginia Lasio
School of Management Guido Caicedo
Xavier Ordeñana
Andrea Gabriela Samaniego Diaz
Ramon Villa
Edgar Izquierdo
Estonia
Ecuador
Czech Republic University of
<Zfefmics, Prague
Institution
Team
Institut Think
IROResearch Oy
Saar Poll
Survey Data
ppm factum
Puls d.o.o., Zagreb
APS Vendor
[email protected]
[email protected]
[email protected]
[email protected]
[email protected]
[email protected]
Contact
German Federal Employment Umfragezentrum Bonn – Prof.
[email protected]
Agency (BA)
Rudinger GmbH (uzbonn GmbH)
Gesellschaft für empirische
[email protected]
Sozialforschung und Evaluation
EMLYON Business School
Ministry of Employment and
the Economy
Turku School of Economics,
University of Turku
Estonian Development Fund
University of Tartu
Banco del Pacífico
CLARO
Dyvenpro
ESPOL
Mexichem Group
Telconet
Technology Agency of the
Czech Republic
J.J. Strossmayer University in
Osijek, Faculty of Economics
CEPOR SME & Entrepreneurship Policy Centre
Ministry of Entrepreneurship
and Crafts
Ministry of Economy
Funders
92
University of Ghana
Foundation for Economic & Industrial
Research (IOBE)
Universidad Francisco
Marroquin
University of Pécs,
Faculty of Business and
Economics
Ghana
Greece
Guatemala
Hungary
László Szerb
József Ulbert
Attila Varga
Gábor Márkus
Attila Pethe
Dietrich Péter
Zoltán J. Ács
Terjesen Siri
Saul Estrin
Ruta Aidis
Hugo Maúl
Mónica de Zelaya
Carolina Uribe
David Casasola
Fritz Thomas
Jaime Diaz
Lisardo Bolaños
Gustavo Saenz
Stavros Ioannides
Aggelos Tsakanikas
Ioannis Giotopoulos
Paul W. K. Yankson
George Owusu
Robert D. Osei
Simon Bawakyillenuo
[email protected]
[email protected]
Khanti Consulting
Francisco Marroquín University -UFMSchool of Economic Sciences
-UFMKirzner Entrepreneurship
Center
Szocio-Gráf Piac-és KözvéOTKA Research Foundation
lemény-kutató
Theme number K 81527
Regional Studies PhD
Intézet
Programme, University of
Pécs Faculty of Business and
Economics
Business Administration PhD
Programme, University of
Pécs Faculty of Business and
Economics
Management and Business Administration PhD
Programme of the Corvinus
University of Budapest
Doctoral School of Regional
and Economic Sciences,
Széchanyi István University
Global Entrepreneurship and
Research Foundation
[email protected]
Datapower SA
National Bank of Greece SA
[email protected]
Institute of Statistical, Social
and Economic Research (ISSER),
University of Ghana
International Development
Research Centre (IDRC)
93
Parahyangan Catholic
University (UNPAR)
Bandung
University of Tehran
Fitzsimons Consulting
Dublin City University
Business School
Indonesia
Iran
Ireland
Indian School of
Business (ISB),
Hyderabad
Institute of Management Technology
(IMT), Ghaziabad
Paula Fitzsimons
Colm O’Gorman
Abbas Bazargan
Nezameddin Faghih
Ali Akbar Moosavi-Movahedi
Leyla Sarfaraz
Asadolah Kordrnaeij
Jahangir Yadollahi Farsi
Mahmod Ahamadpour
Daryani
S. Mostafa Razavi
Mohammad Reza Zali
Mohammad Reza Sepehri
Ali Rezaean
Thomas Schøtt
Catharina Badra
Nawangpalupi
Gandhi Pawitan
Agus Gunawan
Maria Widyarini
Triyana Iskandarsyah
Krishna Tanuku
Santosh Srinivas
Vijay Vyas
Kumar Ashish
Bibek Banerjee
Noel Saraf
Sunil Shukla
Entrepreneurship DePankaj Bharti
velopment Institute of
India (EDI), Ahmedabad Amit Kumar Dwivedi
India
National Team Members
Institution
Team
Enterprise Ireland
Forfás
Labour Social Security Institute (LSSI)
International Development
Research Centre (IDRC)
Centre for Research in Entrepreneurship, Education and
Development (CREED), Entrepreneurship Development
Institute of India (EDI)
Institute of Management
Technology (IMT)
Wadhwani Centre for Entrepreneurship Development
(WCED), ISB
Wadhwani Centre for Entrepreneurship Development
(WCED), ISB
Funders
94
BMG Research
Elham Kabuli
Sedigheh Yeganegi
PT Spire Indonesia
IMRB International
APS Vendor
[email protected]
[email protected]
[email protected]
[email protected]
[email protected]
[email protected]
[email protected]
[email protected]
[email protected]
[email protected]
[email protected]
Contact
University of
Technology, Jamaica
Musashi University
Gyeongnam National
Jamaica
Japan
Korea,
Republic of
Latvia
University of Padua
Italy
Technology
[email protected]
Social Survey Research Information Co Ltd (SSRI)
Hankook Research Co
SKDS
Venture Enterprise Center
GEM Korea Center
Hanaro Tech Co., Ltd.
Korea Aerospace Industries,
Ltd (KAI)
Taewan Co., Ltd.
Chonhaiji Co., Ltd.
Noriyuki Takahashi
Takeo Isobe
Yuji Honjo
Takehiko Yasuda
Masaaki Suzuki
Sung-sik Bahn
Sanggu Seo
Kyung-Mo Song
Jong-hae Park
Min-Seok Cha
Mim-sun Cho
Marija Krumina
TeliaSonera AB
[email protected]
Market Research Services Ltd
International Development
Research Centre (IDRC)
Michelle Black
Paul Golding
Orville Reid
Vanetta Skeete
Horace Williams
Michael Steele
O’Neil Perkins
Girjanauth Boodraj
Claudette Williams-Myers
[email protected]
[email protected]
[email protected]
Doxa
Università degli Studi di
Padova
Università Politecnica delle
Marche
Fondazione Aristide Merloni
Grafica Veneta Spa
Moreno Muffatto
Patrizia Garengo
Paolo Giacon
Donato Iacobucci
Alessandra Micozzi
Michael Sheriff
Saadat Saaed
Masoud Mostafavi
Sandra Dal Bianco
Debora Vivenzi
[email protected]
Dialogue Corporation
The Ira Centre for Business
Technology and Society, Ben
Gurion University
Ehud Menipaz
Yoash Avrahami
Miri Lerner
Eli Gimmon
Zeev Greenberg
Geula Biton
Baltic International Cen- Anders Paalzow
tre for Economic Policy Alf Vanags
Studies (BICEPS)
The TeliaSonera Institute at the Stockholm
School of Economics
in Riga
(GE-Tech)
and
University of Science
The Ira Centre for
Business Technology
and Society, Ben Gurion
University of the Negev
Israel
95
Malawi
George Mandere
Benjamin Kaneka
James Kaphuka
Andrew Jamali
Regson Chaweza
Monica Phiri
Mike Dalious
International Development
Research Centre (IDRC)
University of Malawi
Invest in Knowledge Initiative
Aleksandar Krzalovski
Dimce Mitreski
Lazar Nedanoski
Gligor Mihailovski
Jasmina Popovska
Macedonian Enterprise
Development Foundation (MEDF)
University of Malawi
Macedonian Enterprise
Development Foundation
(MEDF)
Macedonia
International Business
School at Vilnius University
Lithuanian Research Council
Enterprise Lithuania
Radmil Polenakovic
Tetjana Lazarevska
Saso Klekovski
University of
Luxembourg
Luxembourg
Mindaugas Lauzikas
Erika Vaiginiene
Aiste Miliute
Skaiste Varniene
International Development
Research Centre (IDRC)
Silatech
University "Ss. Cyril and
Methodius" - Business
Start-Up Centre (BSC)
International
Business School at
Vilnius
University
Lithuania
Fathi Ali
Ali Omar
Yousef El Gimati
Paul Dyer
Nader Kabbani
Funders
Chambre de Commerce
Luxembourg
Ministère de l’Économie et
du Commerce extérieur
University of Luxembourg
CRP Henri Tudor, public
research centre
STATEC, National Statistical
Office
University of Benghazi
Libya
National Team Members
Denise Elaine Fletcher
Anne-Laure Mention
Olivier Giacomin
Guy Schuller
Peter Höck
Institution
Team
96
Invest in Knowledge Initiative
MProspekt
TNS ILRES
RAIT Ltd
Research & Consulting Center
University of Benghazi
APS Vendor
[email protected]
[email protected]
[email protected]
[email protected]
[email protected]
[email protected]
[email protected]
Contact
Universiti Tun Abdul
Razak
Tecnológico de
Monterrey
Namibia Business
School
Panteia/EIM
TOMEB Foundation for
Youth Development &
Sustainability
Bodø Graduate School
of Business
City of Knowledge's
Panama Business
Accelerator
IESA Management
School (Panama
Campus)
Universidad ESAN
Malaysia
Mexico
Namibia
Netherlands
Nigeria
Norway
Panama
Peru
Jaime Serida
Oswaldo Morales
Keiko Nakamatsu
Armando Borda
Manuel Lorenzo
Manuel Arrocha
Ramón Garibay
Andrés León
Federico Fernández Dupouy
Gry Agnete Alsos
Erlend Bullvåg
Tommy Høyvarde Clausen
Espen Isaksen
Bjørn Willy Åmo
Aurora Dyrnes
Rilwan Aderinto
Tunde Popoola
Luqman Olatokunbo Obileye
Tomola Marshal Obamuyi
Thomas Schøtt
Abubakar Sadiq Kasum
Lere Baale
Jolanda Hessels
Peter van der Zwan
Sander Wennekers
André van Stel
Roy Thurik
Philipp Koellinger
Ingrid Verheul
Niels Bosma
Mac Hengari
Albert Kamuinjo
Jennifer Haihambo
Nepeti Nicanor
Nehemia Uzera
Mario Adrián Flores
Marcia Campos
Elvira Naranjo
Natzin López
Siri Roland Xavier
Mohar bin Yusof
Leilanie Mohd Nor
Noorseha binti Ayob
Garry Clayton
Alduncin y Asociados
Nielsen
Panteia
MarketSight Consultancy
Limited
Tecnológico de Monterrey
Campus León
Namibia Business School
The Ministry of Economic
Affairs of the Netherlands
International Development
Research Centre (IDRC)
Polarfakta
IPSOS
Imasen
Innovation Norway
Kunnskapsfondet Nordland
AS
Bodø Graduate School of
Business
The Authority of the Micro,
Small and Medium Enterprises
IPSOS
Universidad ESAN's Center
for Entrepreneurship
Imasen
TOMEB Foundation for
Youth, Development & Sustainability
Rehanstat
Universiti Tun Abdul Razak
97
[email protected]
[email protected]
[email protected]
[email protected]
[email protected]
[email protected]
[email protected]
[email protected]
[email protected]
[email protected]
Sociedade Portuguesa
de Inovação (SPI)
University of Puerto
Rico School of Business,
Rio Piedras Campus
Faculty of Economics
and Business Administration, Babe -Bolyai
University
Graduate School of
Management SPbSU
Portugal
Puerto Rico
Romania
Russia
University of Economics Przemysław Zbierowski
in Katowice
Polish Agency for Enter- Anna Tarnawa
prise Development
Paulina Zadura-Lichota
Dorota W cławska
Mariusz Bratnicki
Poland
OTP Bank Romania
Asociatia Pro Oeconomica
Babes-Bolyai University of
Cluj-Napoca
Metro Media Transilvania,
Studii Sociale, Marketing i
Publicitate S.R.L
Ágnes Nagy
Tünde Petra Petru
Annamária Benyovszki
Ðtefan Pete
Lehel - Zoltán Györfy
Dumitru Mati
Eugenia Mati
Charitable Foundation for
Graduate School of Management Development
E&Y
Center for Entrepreneurship
University of Puerto Rico
School of Business, Rio
Piedras Campus
Banco Popular de Puerto
Rico
Marines Aponte
Aida Lozada
Marta Alvarez
Verkhovskaya Olga
Dorokhina Maria
Shirokova Galina
ISCTE - Instituto Universitário de Lisboa (ISCTE-IUL)
Polish Agency for Enterprise
Development
International Development
Research Centre (IDRC)
Funders
Augusto Medina
Douglas Thompson
Rui Monteiro
Nuno Gonçalves
Luís Antero Reto
António Caetano
Nelson Ramalho
Aida Licaros Velasco
Emilina Sarreal
Brian Gozun
Junette Perez
Gerardo Largoza
Mitzie Conchada
De La Salle University
Philippines
National Team Members
Institution
Team
98
Levada-Center
Metro Media Transilvania
Gaither International
GfKMetris (Metris – Métodos
de Recolha e Investigação Social,
S.A.)
Realizacja sp. z o.o.
TNS Philippines
APS Vendor
[email protected]
annamaria.benyovszki@econ.
ubbcluj.ro
[email protected]
[email protected]
[email protected]
[email protected]
Contact
Universidad de Cádiz
Universidad de
Zaragoza
Andalucía
Aragón
Regional Teams
UCEIF-Cise
Spanish GEM Regional
Network
The UCT Centre for
Mike Herrington
Innovation and EntreGerhard Mulder
preneurship, Graduate
School of Business,
University of Cape Town
South Africa
Spain
Faculty of Economics
Miroslav Rebernik
and Business, University Polona Tominc
of Maribor
Katja Crnogaj
Karin Širec
Barbara Brada Hojnik
Matej Rus
Slovenia
Lucio Fuentelsaz Lamata
José Ruiz Navarro
Ricardo Hernández
Federico Gutiérrez- Solana
Iñaki Peña
Maribel Guerrero
José Luis González
Manuel Redondo
Inés Rueda
Antonio Fernández
Anna Pilkova
Zuzana Kovacicova
Marian Holienka
Jan Rehak
Jozef Komornik
Comenius University
in Bratislava, Faculty of
Management
Slovakia
Olexander Chernyshenko
Ho Moon-Ho Ringo
Chan Kim Yin
Rosa Kang
Lai Yoke Yong
Marilyn Ang Uy
Francis Wong Lun Kai
Calvin Ong He Lu
Lee Seong Per
Nanyang Technological
University
Singapore
[email protected]
[email protected]
[email protected]
Bank Of Santander
Spanish GEM Regional
Network
Fundación Rafael Del Pino
Instituto Opinòmetre S.L.
[email protected]
Department of Economic
Nielsen South Africa
Development and Tourism of
the Western Cape Government
RM PLUS
SPIRIT Slovenia
Slovenian Research Agency
Institute for Entrepreneurship and Small Business
Management
[email protected]
[email protected]
Joshua Research Consultants
Pte Ltd
National Agency for Develo- AKO
pment of Small and Medium
Enterprises
Central European Foundation
(CEF)
SLOVINTEGRA Energy, s.r.o
Comenius University in
Bratislava, Faculty of Management
NTU Ventures Pte Ltd
Nanyang Technological
University
99
Araceli de Lucas Sanz
Isidro de Pablo López
Universidad de Cantabria
Grupo de Investigación
en Dirección de Empresas (GIDE), Universidad
de León
Universidad de Castilla
La Mancha
Institut d’Estudis Regionals i Metropolitans
Universidad Miguel
Hernández de Elche
Fundación Xavier de
Salas –Universidad de
Extremadura
Confederación de
Empresarios de Galicia
(CEG)
Centro de Iniciativas Emprendedoras
(CIADE), Universidad
Autónoma de Madrid
Agencia de Desarrollo
Económico "Madrid
Emprende" Ayuntamiento de Madrid
Universidad de Murcia
Universidad Pública de
Navarra
Orkestra-Instituto Vasco de Competitividad, y
Deusto Business School
Cantabria
Castilla y León
Castilla La
Mancha
Cataluña
C. Valenciana
Extremadura
Galicia
Comunidad
Autónoma de
Madrid
Madrid Ciudad
Murcia
Navarra
País Vasco
Iñaki Peña y Maribel
Guerrero
Ignacio Contín Pilart
Antonio Aragón y Alicia Rubio
Iñaki Ortega Chacón
Ricardo Hernández y Juan Carlos
Díaz
José María Gómez Gras
Esteban Lafuente y Carlos
Guallarte
Juan José Jiménez Moreno
Mariano Nieto Antolín
Ana Fernández Laviada
Rosa M. Batista Canino
Universidad de Las
Palmas de Gran Canaria
Canarias
National Team Members
Institution
Team
Funders
100
APS Vendor
Contact
Rico Baldegger
Andreas Brülhart
Fredrik Hacklin
Pius Baschera
Siegfried Alberton
Andrea Huber
Pascal Wild
Onur Saglam
Turkey
Yeditepe University
Small and Medium Enterprises Development
Organization (KOSGEB)
Arthur Lok Jack Gradua- Miguel Carillo
Henry Bailey
te School of Business,
Marvin Pacheco
University of the West
Indies
Trinidad and
Tobago
Esra Karadeniz
Meltem Öksüz
Dila Kalyoncu
Pichit Akrathit
Koson Sapprasert
Ulrike Guelich
Bangkok University School of Entrepreneurship and Management
(BUSEM)
Thailand
Chao-Tung Wen
Ru-Mei Hsieh
Yi-Wen Chen
Chang-Yung Liu
Su-Lee Tsai
Yu-Ting Cheng
Li-Hua Chen
Shih-Feng Chou
National Chengchi
University
Arthur Lok Jack Gradua- Miguel Carillo
Henry Bailey
te School of Business,
Marvin Pacheco
University of the West
Indies
(HEG-FR) Fribourg
School of Management
Swedish
Pontus Braunerhjelm
Entrepreneurship Forum Per Thulin
Carin Holmquist
Maria Adenfelt
Mikael Jorstig
Taiwan
Suriname
Switzerland
Sweden
gfs Bern
School of Management
Fribourg (HEG-FR)
Sacoda Serv Ltd
Akademetre
International Development
Research Centre (IDRC)
Small and Medium Enterprises Development Organization (KOSGEB)
Turkish Economy Bank (TEB)
[email protected]
TNS Research International
Thailand
Bangkok University
[email protected]
[email protected]
[email protected]
[email protected]
[email protected]
[email protected]
[email protected]
[email protected]
NCCU Survey Center
Small and Medium Enterprise Administration, Ministry
of Economic Affairs of
Taiwan
Inter American Development Sacoda Serv Ltd
Bank
University of Applied Sciences and Arts of Southern
Switzerland (SUPSI)
Swiss Federal Institute of
Technology in Zurich (ETHZ)
Ipsos
Svenskt Näringsliv /
Confederation of Swedish
Enterprise
Vinnova
EU Commission, DG Employment (for TeliEU project)
101
IEEM
Babson College
Luong Minh Huan
Commerce and Industry Doan Thi Quyen
Pham Dinh Vu
Do Thi Ha Lan
Doan Thuy Nga
Francis Chigunta
Valentine Mwanza
Mumba Moonga
Chilala Hankuku
Wisdom Kalenga
Aston University
Vietnam Chamber of
University of Zambia
UK
Uruguay
United States
Vietnam
Zambia
Donna Kelley
Abdul Ali
Candida Brush
Marcia Cole
Andrew Corbett
Medhi Maj
Monica Dean
Edward Rogoff
Thomas Lyons
Leonardo Veiga
Isabelle Chaquiriand
Mark Hart
Jonathan Levie
Erkko Autio
Tomasz Mickiewicz
Michael Anyadike-Danes
Paul Reynolds
Rebecca Namatovu
Waswa Balunywa
Sarah Kyejjusa
Peter Rosa
Laura Orobia
Diana Ntamu
Arthur Sserwanga
Samuel Dawa
Makerere University
Business School
Uganda
National Team Members
Institution
Team
International Development
Research Centre (IDRC)
International Development
Research Centre (IDRC)
Babson College
Baruch College
University of Montevideo
Deloitte Uruguay
Department for Business,
Innovation and Skills (BIS)
Welsh Assembly Government
Hunter Centre for Entrepreneurship, University of
Strathclyde
Invest Northern Ireland
Coca Cola Ltd
The Prince’s Initiative for
Mature Enterprise (PRIME)
International Development
Research Centre (IDRC)
Makerere University Business School
Funders
102
Department of Development
Studies
Vietnam Chamber of Commerce
and Industry
OpinionSearch Inc.
Equipos Mori
BMG Ltd
Makerere University Business
School
APS Vendor
[email protected]
[email protected]
[email protected]
[email protected]
[email protected]
[email protected]
Contact
JOSÉ ERNESTO AMORÓS
Dr. José Ernesto Amorós is the Associate Dean of Research
and Director of Global Entrepreneurship Research Center
at School of Business and Economics, Universidad del
Desarrollo, Santiago, Chile. He is the coordinator and main
researcher of Chile’s Global Entrepreneurship Monitor and
member of the GERA Board. He holds a Ph.D. in Management Sciences from ESADE Business School, Spain and was
a World Bank-CONICYT Postdoctoral Research Fellow at
the Universidad Adolfo Ibáñez, Chile. He has a Bachelor’s
Degree in Business Administration and MSc in Marketing
from Monterrey’s Institute of Technology, Mexico. He is
now one of the elected Vice-Presidents of the Iberoamerican Academy of Management. Is Member of International
Council of Small Business, Strategic Management Society,
Academy of Management and Academy of International
Business. He´s lecture from several Latin-American and
Spanish universities. His research interests are entrepreneurship, competitiveness and regional development, high
growth new business, entrepreneurship and gender, and
corporate entrepreneurship.
NIELS BOSMA
Dr. Niels Bosma is assistant professor in the Entrepreneurship and Innovation Department at Utrecht University
School of Economics. He is also research fellow with
Vlerick Business School and the Global Entrepreneurship
Research Association. He holds a PhD in economic geography and a MSc degree in econometrics. Since 2001 he
has actively contributed to the Global Entrepreneurship
Monitor in various roles and has co-authored several
GEM Global Reports. His research interests evolve around
individuals’ entrepreneurial and innovative behavior in
regional and social contexts, with a particular interest in
social entrepreneurship. Niels is an expert on international
differences in entrepreneurship and one of the initiators of
the Utrecht University Social Entrepreneurship Initiative.
Before moving to Utrecht University he held positions at
EIM Business and Research Policy (now part of the Panteia
group), Erasmus University Rotterdam / Tinbergen Institute and London Business School.
103
www.gemconsortium.org
ISBN: 978-1-939242-04-4
Baixar