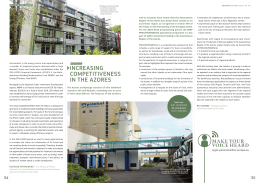
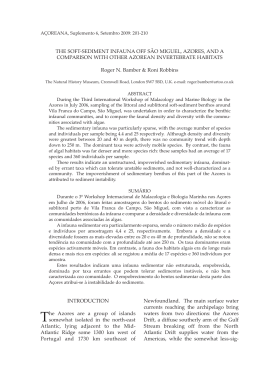
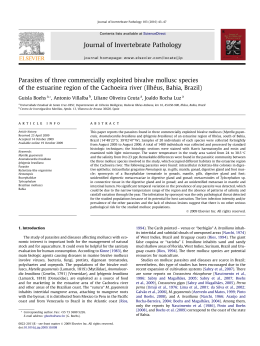
SCI. MAR., 65 (2): 117-126
SCIENTIA MARINA
2001
Macrobenthic mollusc fauna inhabiting Halopteris
spp. subtidal fronds in São Miguel Island, Azores*
ANA CRISTINA COSTA and SÉRGIO PAULO ÁVILA
Departamento de Biologia, Universidade dos Açores, Rua da Mãe de Deus, 9500 Ponta Delgada.
E-mail: [email protected], [email protected]
SUMMARY: The molluscan community structure (species composition, abundance, density and diversity) associated with
common brown algae Halopteris spp. at seven subtidal sites on São Miguel island (Azores) wase studied and checked for
differences between sites. A total of 8,921 specimens (29 species of Gastropoda, 7 species of Bivalvia) were recorded. Bittium sp., the most common species, representing 85.6% of the total number of molluscs sampled, was present at each site
and the number of taxa found at each station ranged from 3 to 17. Four species (Bittium sp., Setia subvaricosa, Tricolia pullus azorica and Rissoa guernei) accounted for 96.6% of all the specimens sampled. The density of the molluscs reached
18,000 specimens/100 g of algal dry weight (ADW). No significant differences in species diversity were found between
sites. Further multispecies analysis between sites were conducted with both clustering and ordination techniques, and
showed some separation between samples from south and north locations. The species responsible for this separation were
the endemic Azorean Rissoids Rissoa guernei and Setia subvaricosa.
Key words: Mollusca, Halopteris, biological association, Azores.
INTRODUCTION
In the Azores, studies on marine molluscs inhabiting shallow-waters were mainly taxonomic until
Chapman (1955) carried out the first ecological
approach. Other works with a similar perspective
were those by Morton (1967), Martins (1980), Arruda and Gordo (1984), Lemos and Viegas (1987),
Bullock et al. (1990), Hawkins et al. (1990), Neto
and Azevedo (1990), Azevedo (1991, 1992), Bullock (1995) and Ávila (1996, 1998).
In the intertidal algal turf of S. Miguel, mollusc
abundance and diversity are related to the algal composition of the turf (Azevedo, 1991). It is therefore
important to investigate the particular assemblage
*Received March 29, 1999. Accepted November 18, 2000.
associated with each species of algae. In the very
heterogeneous rocky bottom characteristic of the
Azores, the confounding factor of different compositions of algal turf must be taken into account when
faunal assemblages from different places are compared. Thus, when the aim is to study the biological
associations between molluscs and algae in the
Azores, a different method to the traditional scrapping area is necessary.
Along the shores of São Miguel, brown algae
(Halopteris filicina and Stypocaulon scoparium, formerly Halopteris scoparia) are common. At a 15 m
water depth, S. scoparium is one of the dominant algal
species throughout the year (Neto, 1997). The abundance and distribution of these algal species make
them a general representative habitat for macrobenthic
subtidal communities in the Azores (Neto et al., 2000).
MOLLUSCS IN HALOPTERIS SPP. 117
The main objectives of this work were to characterise the molluscan fauna associated with
Halopteris spp., to relate spatial differences in molluscan assemblages to different environmental conditions and to determine whether molluscs were
potential indicators of environmental pollution.
MATERIALS AND METHODS
Samples were taken from 7 sites on São Miguel
(37o42’N to 37o55’N and 25o08’W to 25o52’W), the
largest island of the archipelago (Fig. 1). Sites were
chosen with different environmental conditions such
as location (north/south), degree of exposure
(exposed/sheltered) and degree of disturbance (notpolluted/polluted/disturbed). Ribeira Quente (RQ)
was classified as a naturally disturbed site, because
of the existence of a shallow-water subtidal vent
there. Plants were collected near the vents, limiting
the depth of collection of Halopteris spp. at this site
(Table 1). Polluted sites were those located near factory outlets, e.g. Atalhada (ATA) and Cofaco (COF).
Effluents from food and fish processing factories are
discharged directly onto the shore, less than 100 m
from the sampling points. As there are no available
data on the composition of these effluents, the
degree of disturbance was estimated.
As far as possible, the sites were standardized for
depth (measured using a depth gauge) and to avoid
seasonal effects all samples were taken within 4
weeks in October/November 1996 (Table 1). At
each site, three replicates of ten plants of Halopteris
spp. (Halopteris filicina and Stypocaulon scoparium) were taken by diving; the sampling area was
located using a two digit random method adapted
from Fenwick (1984). On arrival at the bottom, a
transparent disk with 10 numbered lines (0-9) was
put over the compass so that the 0 would be aligned
with the N direction. The first random digit indicated a direction corresponding to a radial line and the
second digit determined the distance from the initial
position in metres along a graduated line. At each
location ten plants were gently pulled off the rock by
hand and put in a labeled cotton drawstring bag. In
the laboratory, the samples were washed several
times and the animals were removed by pouring the
washing water through a 0.5 mm mesh sieve. The
samples were labeled and preserved in 70% ethanol.
After draining for about 30 min, the wet weight of
the algae was determined (±0.01 g). The algae were
then dried for 48 h at 60ºC, and re-weighted (±0.01
118 A.C. COSTA and S.P. ÁVILA
FIG. 1. – São Miguel island with the sampling sites: ATA - Atalhada; CAL - Caloura; COF- Cofaco; ILH- Vila Franca islet; RQ Ribeira Quente; RBA - Ribeirinha; SVC - São Vicente.
g). This allowed the faunal results to be standardized
avoiding any bias resulting from different sized
plants. Halopteris filicina and Stypocaulon scoparium are larger on the north coast than in the south
coast of S. Miguel (Neto, 1997). The samples were
sorted under a binocular dissecting microscope and
separated into major groups (Polychaeta, Mollusca,
Crustacea, Ophiuroidea, others). The molluscs were
sorted into species and counted.
Data analysis
Data analysis was undertaken using the PRIMER
(Plymouth Routines in Multivariate Ecological
Research) set of programs developed and tested by
Plymouth Marine Laboratory, and by MINITAB
Release11 statistical package.
TABLE 1. – Characterisation of the samples collected in 1996.
Date
(1996)
ATA1
ATA2
ATA3
CAL1
CAL2
CAL3
COF1
COF2
COF3
ILH1
ILH2
ILH3
RBA1
RBA2
RBA3
RQ1
RQ2
RQ3
SVC1
SVC2
SVC3
10-Oct
10-Oct
10-Oct
14-Oct
14-Oct
14-Oct
05-Nov
05-Nov
05-Nov
24-Oct
24-Oct
24-Oct
08-Oct
08-Oct
08-Oct
15-Oct
15-Oct
15-Oct
07-Oct
07-Oct
07-Oct
North/
Water
Depth
South temperature
coast
(ºC)
(m)
S
S
S
S
S
S
N
N
N
S
S
S
N
N
N
S
S
S
N
N
N
21
21
21
21
21
21
20
20
20
20
20
20
21
21
21
21
21
21
21
21
21
Other abbreviations as in Figure 1.
11.2
11.2
11.2
13.7
13.7
13.7
11.3
11.3
11.3
15.0
15.0
15.0
12.2
12.2
12.2
5.5
5.5
5.5
11.0
11.0
11.0
Wet
weight
(g)
Dry
weight
(g)
18.91
11.76
17.49
11.54
14.09
20.84
75.98
107.01
13.57
1.87
8.59
1.85
96.30
18.86
31.25
82.75
59.25
47.47
39.08
32.67
37.94
4.61
2.47
4.21
6.24
3.70
5.79
13.26
17.48
8.83
0.38
1.81
0.41
21.89
4.59
5.91
19.49
16.20
13.28
6.80
6.38
5.78
Mollusc density, defined as the total number of
specimens of a species (ni) per 100 g of algal wet
weight (ni/100 g AWW) or algal dry weight (ni/100
g ADW), was calculated. Correlations (Pearson
coefficient) between total abundance (N/100 g
ADW) and ADW were also calculated, N being the
total number of molluscs per sample.
Species diversity was measured using several
indices: Species richness (S), species diversity
indices of Margalef (D) (DoCampo and Bikuna,
1994; Schoch and Dethier, 1996), Shannon-Wiener
(H’) (Fenwick, 1976; Pearson and Rosenberg, 1978;
Pité and Avelar, 1996) and Pielou (J’) (Pearson and
Rosenberg, 1978; Warwick and Clarke, 1993a),
Simpson’s dominance index (Si) (Carr, 1996) and
total number of molluscs per sample (N).
ANOVA was performed to identify diversity differences between sites. At the sites where significant
differences were found, Hsu’s MCB test (Multiple
Comparisons with the Best, family error rate = 0.05,
Minitab, 1996) was performed to identify the sites
responsible for the differences.
To determine whether there were relationships
between algal biomass and associated malacofauna, Pearson’s correlation coefficient (r) was calculated using the abundance (N/100 g ADW) and
FIG. 2. – Rank abundance curves (total number of individuals) for the molluscan species collected at each site. Other abbreviations as in Figure 1.
MOLLUSCS IN HALOPTERIS SPP. 119
diversity indices that had been determined. In addition to univariate analysis, multispecies analysis
between sites was conducted with ordination techniques. Prior to the multivariate analysis, actual
numbers (ni/100 g ADW) were transformed by
double square root transformation to standardise
the data and to ensure that the multivariate ordination was not determined by the most abundant
species (Clarke et al., 1993).
Transformed species abundance [(ni/100 g
ADW)1/4] and Shannon diversity data were used to
generate triangular matrices of similarities, using the
Bray-Curtis coefficient (Bray Curtis, 1957 fide Gray
et al., 1988). Similarity matrices were subjected to
clustering and ordination analysis (multidimensional scaling ordination – MDS) (Warwick et al., 1990).
Clustering was done by the hierarchical agglomerative method employing group-average linking
(UPGMA).
The ANOSIM randomization/permutation test
(Warwick and Clarke, 1993a) was used to test for
differences between sites or selected sets of sites.
Species with a ratio higher than 1.4 (SIMPER
analysis) were considered as mainly responsible
for the dissimilarity between places/sites (Warwick
et al., 1990).
RESULTS
Of the total of 8,921 specimens, there were 36
species (29 species of Gastropoda and 7 of Bivalvia)
belonging to 19 families (14 Gastropoda and 5
Bivalvia). Rissoidae was the best represented family, with 9 species. Bittium sp., a species endemic to
the Azores and not yet described, Setia subvaricosa,
Tricolia pullus azorica and Anachis avaroides were
present in all samples, whereas Alvania poucheti,
Alvania sleursi, Odostomella doliolum, Arca tetragona, Cerithiopsis barleei, Eulima sp. and Plagiocardium papillosum were found only once, the first
three at CAL. Bittium sp. was present at each site
and formed 85.6% of the total number of molluscs
sampled. Four species (Bittium sp., S. subvaricosa,
T. pullus azorica and Rissoa guernei) accounted for
96.6% of all specimens sampled (Fig. 2). Ribeirinha
(RBA) was the site with the highest number of molluscs, with a total of 3,882 animals. At RQ and Ilhéu
de Vila Franca (ILH), only 118 and 406 specimens
were found respectively.
Once the biomass values for the algae (wet and
dry weight) were known, a regression was calculat120 A.C. COSTA and S.P. ÁVILA
TABLE 2. – Correlation coefficient (Pearson) between abundance of
molluscs (N/100 g ADW) and algal dry weight (ADW) for each
sampling site. Other abbreviations as in Figure 1.
r
ATA
CAL
COF
ILH
RBA
RQ
SVC
0.638
-0.997
-0.940
0.680
0.007
-0.999
0.832
TABLE 3. – Species richness (S), total number of molluscs per site
(n), diversity indices of Margalef (D), Shannon-Wiener (H’) and
Pielou (J’), Simpson’s dominance index (Si). Other abbreviations as
in Figure 1.
ATA1
ATA2
ATA3
CAL1
CAL2
CAL3
COF1
COF2
COF3
ILH1
ILH2
ILH3
RBA1
RBA2
RBA3
RQ1
RQ2
RQ3
SVC1
SVC2
SVC3
S
n
D
H’
J’
Si
15
9
9
17
11
16
8
10
6
6
12
5
15
8
11
4
3
8
13
7
6
339
124
497
399
406
437
284
228
548
15
329
62
2725
794
363
11
43
64
1101
101
51
2.400
1.660
1.290
2.670
1.660
2.470
1.240
1.660
0.790
1.850
1.900
0.970
1.770
1.050
1.700
1.250
0.530
1.680
1.710
1.300
1.270
1.370
1.180
0.917
1.020
0.484
0.816
0.944
1.050
0.427
1.410
0.363
0.388
0.305
0.373
0.317
1.160
0.967
1.470
0.245
1.140
0.987
0.506
0.537
0.417
0.359
0.202
0.294
0.454
0.455
0.239
0.789
0.146
0.241
0.113
0.179
0.132
0.838
0.880
0.706
0.095
0.587
0.551
0.350
0.389
0.568
0.537
0.819
0.667
0.545
0.541
0.825
0.333
0.883
0.847
0.896
0.856
0.898
0.355
0.408
0.277
0.924
0.402
0.459
ed: ADW=1.373 + 0.188AWW (r2 = 0.86; p<0.05).
ILH and RBA were the sites with highest density
values, respectively 12,415 and 11,963 molluscs/100 g ADW (average of the three replicates).
At ILH2 more than 18,000 molluscs/100 g ADW
were found (Appendix).
A very strong negative correlation was found
between mollusc abundance and ADW in samples
from CAL, COF and RQ. The only significant positive correlation was found at SVC, whereas at RBA
the number of animals found seems to be independent from the sampled algal mass (Table 2).
The number of species per replicate ranged from
3 (RQ2) to 17 (CAL1); RQ is the site with lowest
species richness, whereas the highest number of
species was found at CAL. Margalef’s diversity
index ranged between 0.53 (RQ2) and 2.67 (CAL1).
Both Shannon-Wiener’s and Pielou’s diversity
indices reached the highest values at RQ. Pielou’s
TABLE 4. – Pearson’s correlation between abundance (N/100 g ADW)
and diversity indices used. Other abbreviations as in Figure 1.
ATA
CAL
COF
ILH
RBA
RQ
SVC
S
D
H’
J’
Si
-0.177
-0.996
-0.935
0.562
-0.358
0.763
0.996
-0.490
-0.998
-0.942
-0.267
-0.773
0.380
1.000
-0.714
-0.990
-1.000
-0.983
0.721
0.619
-0.980
-0.996
-0.984
-0.988
-0.998
0.635
-0.734
-0.994
0.871
0.973
0.989
0.989
-0.849
-0.601
0.990
TABLE 5. – One-way ANOVA applied on diversity indices. Abbreviations as in Table 4. Fcalc - F-value calculated; Fcrit - F-value
critical; p - p-value. * - significant.
D
H’
J’
Si
Fcalc
Fcrit
1.819
2.002
3.838
2.689
2.850
2.848
2.848
2.848
samples from ATA and RQ, and two samples each of
SVC, CAL and COF. The second group, comprising
fewer stations than the first one, has all the samples
from RBA and two samples of ILH (Fig. 5).
The results of MDS ordination (Fig. 6) do not
show distinct clustering except for the samples from
RQ, particularly RQ1. However, there is a concentration of samples from the north shore in the
left/centre of the plot while the south coast samples
are shifted to the right side (RQ being the only
exception). Replicates from some sites (e.g. RQ,
SVC and ILH) are scattered apart and/or among
other samples, reflecting great variability of their
faunistical composition.
p
0.167
0.134
0.018*
0.060
diversity index had the lowest values at RBA. Simpson’s dominance index had low values at RQ and
ATA, reaching a maximum at SVC (Table 3).
From Pearson’s correlation coefficient (r)
between abundance (N/100 g ADW) and the diversity indices (Table 4), it is clear that the most diverse
sites were not the ones with higher abundances,
since most of the significant correlations were negative. The exception was SVC, where a strong positive correlation for S, D and Si was found (Table 4).
This last index is positively correlated with abundance at all sites but RBA and RQ. Although there
appears to be some variation in the values of the
diversity indices among the sampling sites (Table 3),
a significant difference (ANOVA) was found only
for equitability values (J’ index) (Table 5). The site
responsible for this difference was RQ, as detected
by Multiple Comparison test, Hsu’s MCB (Fig. 3).
Three main groups were obtained by classification analysis at 50% similarity (Fig. 4). One consists
of one sample (RQ1), the second is formed by a
combination of the remaining RQ samples together
with all the replicates from COF and two samples
from SVC. All other samples formed the third
group. Some variability was detected among the
replicates within sites, except at ATA and COF,
where the three samples are clustered with a high
degree of similarity and before any other connection
to other groups (Fig. 4).
Classification analysis over Shannon’s diversity
index data results in two groups. The first has all the
FIG. 3. – Results for the Hsu’s Multiple Comparisons with the Best,
in J’ values.
FIG. 4. – Cluster analysis of the molluscan fauna associated with
Halopteris spp. Data transformed by the formula yi=(ni/100g
ADW)1/4; Bray-Curtis similarity index, UPGMA. Abbreviations as
in Figure 1.
MOLLUSCS IN HALOPTERIS SPP. 121
TABLE 7. – ANOSIM results. Data transformed by the formula
yi=(ni/100 g ADW)1/4. Other abbreviations as in Table 6.
Group
comparisons
N/S
NP/D/P
NP/(D+P)
Exp/She
FIG. 5. – Cluster analysis of the molluscan fauna associated with
Halopteris spp. Shannon-Wiener diversity index calculated from
data transformed by the formula yi=ni1/4; Bray-Curtis similarity
index, UPGMA. Abbreviations as in Figure 1.
R
Significance
level (%)
0.086
0.309
0.183
-0.249
11.7
0.6
1.5
94.4
A total of 20,000 permutations was used
(ANOSIM) to compare the pre-defined groupings of
replicates (north/south sites; non-polluted/disturbed/polluted sites; exposed/sheltered sites)
against random simulations (Table 6). The significance level of the test statistic R was high (94.4%)
only with Exposed compared with Sheltered sites
(Table 7). However, this may be related to the fact
that only one sheltered site (RBA) is being compared to the heterogeneous group consisting of all
other samples.
SIMPER analysis indicated that Rissoa guernei
(Rg) and Setia subvaricosa (Ss) were the species
responsible for the separation of north and south
samples. The absence of Tricolia pullus azorica
(Tpa) and the lower numbers of Bittium sp. (Bi)
seem to be an important factor for discriminating
RQ samples from the others. These same species,
together with Ss and Rg, seem to be discriminant for
distinguishing RQ from the sites considered as polluted. Setia subvaricosa (Ss) discriminated between
non-polluted sites (NP) and other sites (D+P). The
most discriminant species between sheltered (RBA)
and all other sites (exposed) are Ocinebrina aciculata (Oa), Rissoa guernei (Rg) and Setia subvaricosa
(Ss) (Table 8).
DISCUSSION
FIG. 6. – Two-dimensional MDS configuration. Stress=0,16.
TABLE 6. – Pre-defined groups and their abbreviations used in
ANOSIM and SIMPER analysis. Abbreviations of the sampling
sites as in Figure 1.
Pre-defined groups
Sampling sites
N - north shore
S - south shore
NP - non-polluted site
D - disturbed site
P - polluted site
Exp - exposed site
She - sheltered site
COF, RBA, SVC
ATA, CAL ILH, RQ
CAL, ILH, RBA, SVC
RQ
ATA, COF
ATA, CAL, COF,ILH, RQ, SVC
RBA
122 A.C. COSTA and S.P. ÁVILA
Our results confirm that Rissoidae is the best represented mollusc family associated with algae in the
Azores (e.g. Azevedo, 1991; Bullock et al, 1990;
Gofas, 1990; Ávila, 1996, 1998). Bittium sp., S. subvaricosa, T. pullus azorica and Anachis avaroides
characterise all our samples.
In Table 9, our results on species densities are
compared with the results obtained by Bullock et
al. (1990), who worked with mollusc fauna of
Stypocaulon scoparium (quoted as Halopteris scoparia) from ILH, and with those of Azevedo
(1991), which refer to a mixed algal substratum
TABLE 8. – SIMPER results. Data transformed by the formula yi=(ni/100 g ADW)1/4. Aa: Alvania angioyi. An: Anachis avaroides Bi: Bittium
sp. Js: Jujubinus striatus. Oa: Ocinebrina aciculata. Pv: Parvicardium vroomi. Rg: Rissoa guernei. Ss: Setia subvaricosa. Se: Setia sp.
Tpa: Tricolia pullus azorica. Other abbreviations as in Table 6.
Groups
of sites
Average similarity
Species
Species %
(Ratio of each species)
Cumulative %
N
57.29
Bi - Tpa - Rg - Ss - An
88.45
S
43.23
Bi - Ss - Tpa - An - Aa
NP
52.33
Bi - Tpa - Ss - An - Rg - Aa
D
45.99
Bi - Ss
P
57.97
Bi - Ss - Tpa – An
D+P
46.39
Bi - Ss - Tpa – Rg
Exp
45.82
Bi - Tpa - Ss - Rg – An
She
67.55
Bi - Rg - Tpa – An - Oa
39.06 - 18.49 - 16.85 - 9.80 - 4.25
(5.49 - 3.56 - 3.91 - 1.04 - 0.82)
38.19 - 17.47 - 14.32 - 6.92 - 6.76
(2.98 - 1.30 - 1.32 - 0.81 - 0.82)
41.44 - 20.35 - 6.71 - 4.99 - 4.29 - 3.97
(4.61 - 3.28 - 0.80 - 0.83 - 0.65 - 0.66)
48.81 - 33.76
(4.22 - 4.18)
35.97 - 22.62 - 16.51 - 6.83
(5.24 - 4.72 - 6.47 - 1.32)
36.60 - 26.14 - 10.62 - 10.52
(3.35 - 3.71 - 1.11 - 0.60)
39.72 - 17.12 - 16.42 - 5.62 - 5.15
(3.51 - 1.61 - 1.31 - 0.49 - 0.70)
38.64 - 14.05 - 11.69 - 9.02 - 7.69
(13.17 - 7.12 - 4.82 - 12.04 - 6.03)
Groups Average dissimilarity
83.67
81.75
82.57
81.93
83.88
84.03
81.09
Species
Species %
(Ratio of each species)
Cumulative %
11.40 - 8.74 - 8.26 - 5.83 - 5.64 - 5.37 - 4.98
(1.19 - 1.85 - 1.54 - 1.23 - 0.82 - 1.06 - 1.09)
19.01 - 11.63 - 6.39 - 6.22 - 5.16 - 5.12
(2.71 - 2.03 - 1.35 - 1.62 - 1.08 - 1.04)
9.79 - 8.39 - 6.54 - 6.11 - 5.34 - 5.34 - 4.66 - 3.99
(1.44 - 1.50 - 1.28 - 1.26 - 1.12 - 1.18 - 1.14 - 0.80)
17.13 - 11.21 - 10.11 - 7.36 - 6.78 - 5.70
(2.50 - 2.58 - 1.66 - 1.02 - 1.19 - 1.48)
12.82 - 8.30 - 6.64 - 6.48 - 5.61 - 5.25 - 4.87 - 4.21
(1.27 - 1.48 - 0.92 - 1.28 - 1.20 - 1.06 - 1.05 - 1.04)
12.23 - 8.20 - 7.81 - 5.98 - 5.59 - 5.28
(1.09 - 1.57 - 1.49 - 1.14 - 1.98 - 1.24)
50.22
N/S
52.80
Bi - Rg - Ss - Aa - Tpa - Pv –An
NP/D
68.46
Bi - Tpa - Rg - Ss – An - Pv
NP/P
47.86
Ss - Bi - Rg - Aa - Pv - Se – An - Js
P/D
61.29
Bi - Tpa - Ss - Rg - Aa – An
NP/(D+P)
54.72
Bi - Ss - Tpa - Rg - Aa - Pv – An - Se
She/Exp
48.15
Bi - Rg - Ss - Pv - Oa - Aa
53.52
50.16
58.30
54.18
45.09
TABLE 9. – Maximum density of molluscs/100 g algal wet weight/dry weight in the present and previous works in the Azores.
This work
wet weight
Alvania angioyi
Anachis avaroides
Bittium sp.
Cardita calyculata
Hinnites distortus
Jujubinus exasperatus
Jujubinus sp.
Ocinebrina aciculata
Parvicardium vroomi
Rissoa guernei
Setia subvaricosa
Tricolia pullus azorica
173 †
108
3,597
54
54
12
107
35
64 ‡
138 ‡
714 †
107
Monospecific Halopteris samples
Bullock et al., 1990
wet weight
573
94
2841
200
This work
dry weight
713 †
488
17,072
244
263
276
526
166
261 ‡
566 ‡
2,928 †
526
Scrapped samples
Azevedo, 1991
dry weight
5,706
10,446
212
198
30
5,744
4,587
† - sample collected at ATA; ‡ - sample collected at RBA; all other samples collected at ILH.
collected subtidally at RBA by the scrapping
method. The density of Bittium sp. found by us at
ILH, is the highest ever reported in the Azores
(d=17,072 molluscs/100 g ADW). Bullock et al.
(1990) reported much lower densities of Bittium
sp. in Halopteris scoparia at Vila Franca islet.
Ávila (1996, 1998) found this species in the intertidal of a sheltered lagoon at Lajes do Pico, but
always in low densities, suggesting a preference of
this species for subtidal conditions. The densities
of S. subvaricosa (2,928 molluscs/100 g ADW)
and Alvania angioyi (713 molluscs/100 g ADW),
both at ATA, were also high. However, the densities of A. angioyi, Rissoa guernei and T. pullus
azorica reported here for RBA are lower than those
from Azevedo (1991) (Table 9).
MOLLUSCS IN HALOPTERIS SPP. 123
Bittium reticulatum was also a very abundant
species in samples of Halopteris scoparia taken by
Borja (1986a) on the Basque Coast (Northern
Spain), Rissoa parva being the dominant species. In
our work, Rissoa guernei is found at all sites except
ATA and ILH, being the most abundant species in
the samples from RQ. Fernández et al. (1988) found
very high quantities of B. reticulatum in the algae
Gelidium latifolium at Bañugues in the north of
Spain. As Borja (1986b) and Fernández et al. (1988)
state that B. reticulatum is particularly abundant in
November, our sampling period might have had
some influence on the high abundance results found
for the Azorean Bittium. However, at least in the
infralittoral communities studied by Azevedo
(1991), the seasonal variation in Bittium sp. density
is not very marked in spite of the higher abundance
found for the species in the winter months, especially at the more exposed sites and particularly on the
north shore of São Miguel island. Working with
other macroalgae species would make it possible to
determine whether in the Azores, Bittium sp. conforms to the statement of Fretter and Graham (1981)
that B. reticulatum is quite independent from the
macrophyte habitat.
Azevedo (1992) found that a high ADW was
associated with a high number of molluscs, but
decreased diversity due to dominance. In our work,
ADW was not related to mollusc abundance, except
for SVC. However, high abundance of molluscs
favoured dominance and decreased diversity at most
of the sites sampled by us, Bittium sp. being the
taxon responsible for this.
The highest diversity values were found at CAL
(Margalef index), which is the richest place in species
number. However, the higher dominance of Bittium
sp. and Setia subvaricosa lowering equitability is
reflected by the modest value for Shannon-Wiener
diversity. This location was previously reported to
have higher diversity in the intertidal mollusc assemblages as opposed to RBA (Azevedo, 1991).
The highest Shannon-Wiener index values for
RQ are due to the fact that, although RQ is poor in
both species richness and abundance, specimens
were quite evenly distributed among species.
ANOVA performed over the diversity values did not
find any significant differences between sites,
except for the equitability values, where RQ proved
to be the place responsible for the detected difference. The low number of species and animals found
at this spot was responsible for its separation under
most of the performed analysis. Both classification
124 A.C. COSTA and S.P. ÁVILA
and ordination placed RQ closer to the northern than
the southern sites. However, some caution is advised
before any connection between these findings and
the unusual features of the place, as other factors
such as depth and sand proximity could act as confounding factors.
Some variability detected among replicates was
also apparent both in classification and ordination
analysis, especially for RQ and ILH. Warwick and
Clarke (1993b) found that the variability of samples
from impacted sites in a number of studies was
much greater than the variability of those from control sites. However, in our analysis, the replicates
from two previously considered polluted sites, COF
and ATA, seemed to be very consistent (Fig. 6).
As no significant difference was found between
the “polluted” and “non-polluted” sites, it appears
that mollusc assemblages do not constitute a good
indicator of stressed benthic communities in S.
Miguel.
ACKNOWLEDGEMENTS
We gratefully acknowledge valuable comments
and suggestions by Dr. Ian Tittley and Prof. Malcolm Jones, two anonymous referees and the editor
of Scientia Marina who significantly improved the
manuscript. This study was supported by a grant
given to the second author by JNICT (PRAXIS
XXI/BIC/2788/96).
REFERENCES
Arruda, L.M. and L.S. Gordo. – 1984. On the study of a sample of
Gastropods (Prosobranchia) from the intertidal range of Azores.
Arquipélago., 5: 25-32.
Ávila, S.P. – 1996. Malacological composition of the intertidal zone
at a rocky shore in Pico island, Azores. Abstracts of the II Symposium “Fauna and Flora of the Atlantic islands”: 27.
Ávila, S.P. – 1998. Zonação intertidal de uma comunidade malacológica numa lagoa costeira localizada na costa Sul da ilha do
Pico, Açores. Açoreana, 8(4): 436-486.
Azevedo, J.M.N. – 1991. Estudo das comunidades malacológicas
fitais do litoral em São Miguel, Açores, IV+75pp. Provas de A.
P. C. C.. Universidade dos Açores, Ponta Delgada.
Azevedo, J.M.N. – 1992. Algae-associated marine molluscs in the
Azores. Biol. J. Linn. Soc., 46: 177-187.
Borja, A. – 1986a. Biología y ecología de tres especies de moluscos
gasterópodos intermareales: Rissoa parva, Barleeia unifasciata
y Bittium reticulatum. I. Estructura y dinámica de las poblaciones. Cah. Biol. Mar., 27(4):491-507.
Borja, A. – 1986b. Variacion anual de la abundancia de Rissoa parva
(da Costa, 1779), Barleeia unifasciata (Montagu, 1803) y Bittium
reticulatum (da Costa, 1778) (Mollusca: Gastropoda) sobre el
alga Halopteris scoparia L. Sauv. Iberus, 6(2): 215-227.
Borja, A. – 1988. Biología y ecología de tres especies de moluscos
gasterópodos intermareales: Rissoa parva, Barleeia unifasciata
y Bittium reticulatum. III. Producción. Cah. Biol. Mar., 29(3):
319-330.
Bullock, R.C. – 1995. The distribution of the molluscan fauna associated with the intertidal coralline algal turf of a partially submerged volcanic crater, the Ilhéu de Vila Franca, São Miguel,
Azores. In: Martins, A. M. de F. (ed.), The marine fauna and
flora of the Azores. Proceedings of the Second International
Workshop of Malacology and Marine Biology, Vila Franca do
Campo, São Miguel, Azores. Açoreana, Suplemento Maio de
1995: 9-55.
Bullock, R.C., R.D. Turner and R.A. Fralick. – 1990. Species richness and diversity of algal - associated micromolluscan communities from São Miguel, Açores. In: Martins, A.M. de F.
(ed.), The marine fauna and flora of the Azores. Proceedings of
the First International Workshop of Malacology São Miguel,
Azores. Açoreana, Suplemento Outubro de 1990: 39-58.
Carr, M. – 1996. Primer User Manual (Plymouth Routines in Multivariate Ecological Research). Plymouth Marine Laboratory.
Chapman, G. – 1955. Aspects of the fauna and flora of the Azores.
VI. The density of animal life in the coralline alga zone. Ann.
Mag. Nat. Hist., 12(8): 801-805.
Clarke, K.R. – 1993. Non-parametric multivariate analysis of
changes in community structure. Aust. J. Ecol. 18: 117-143.
Clarke, J. and M. Ainsworth. – 1993. A method of linking multivariate community structure to environmental variables. Mar.
Ecol. Prog. Ser., 92: 205-219.
Clarke, K.R. and R.H. Green. – 1988. Statistical design and analysis for a “biological effects” study. Mar. Ecol. Prog. Ser., 46:
213-226.
Docampo, L and B.G. de Bikuna. – 1994. Development and application of a diversity index (D) to the benthic macroinvertebrates communities in the rivers of Biscay (North of Spain).
Arch Hydrobiol., 129(3): 353-371.
Fenwick, G. – 1976. The effect of wave exposure on the amphipod fauna of the alga Caulerpa browni. J. exp. mar. Biol.
Ecol, 25: 1-18.
Fenwick, G. – 1984. Life history and population biology of the
giant ostracod Leuroleberis zealandica (Baird, 1850) (Myodocopida). J. exp. mar. Biol. Ecol. 77: 255-289.
Fernández, E., R. Anadón and C. Fernández. – 1988. Life histories
and growth of the gastropods Bittium reticulatum and Barleeia
unifasciata inhabiting the seaweed Gelidium latifolium. J. Mollusc. Stud., 54: 119-129.
Fretter, V. and A. Graham. – 1981. The prosobranch molluscs of
Britain and Denmark. Part 4 - Marine Rissoacea. J. Mollusc.
Stud., Suppl. 9: 285-362.
Gofas, S. – 1990. The littoral Rissoidae and Anabathridae of São
Miguel, Azores. In: Martins, A.M. de F. (ed.), The marine
fauna and flora of the Azores. Proceedings of the First International Workshop of Malacology São Miguel, Azores. Açoreana, Suplemento 1990: 97-134.
Gray, J., M. Aschan, M. Carr, K. Clarke, R. Green, T. Pearson, R.
Rosenberg and R. Warwick. – 1988. Analysis of community
attributes of the benthic macrofauna of Frierfjord/Langesundfjord and in a mesocosm experiment. Mar. Ecol. Prog. Ser.,
46: 151-165.
Hair, J.F. Jr., R.E. Anderson, R.L. Tatham and W.C. Black. – 1992.
Multivariate Data Analysis with Readings, XV + 544 pp.
Macmillan Publishing Company, New York.
Hawkins, S.J., L.P. Burnay, A.I. Neto, R. Tristão da Cunha and
A.M. de F. Martins. – 1990. A description of the zonation patterns of molluscs and other important biota on the south coast
of São Miguel, Azores. In: Martins, A.M. de F. (ed.), The
marine fauna and flora of the Azores. Proceedings of the First
International Workshop of Malacology São Miguel, Azores.
Açoreana, Suplemento Outubro de 1990: 21-38.
Lemos, M.L.F.C.C. and M. do C. Viegas. – 1987. Contribuição para
o estudo da zona intertidal (substrato rochoso) da ilha de São
Miguel-Açores. Fácies de Corallina elongata Ellis and Solander.
Resultados preliminares. Cuad. Marisq. Publ. Téc., 11: 59-69.
Martins, A.M. de F. – 1980. Notes on the habitat of five halophile
Ellobiidae in the Azores, 24 pp., 6 figs., 2 pls. Museu Carlos
Machado, Ponta Delgada.
Minitab. – 1996. Minitab Reference Manual, Release 11, n.p..
Minitab Inc..
Morton, B. – 1967. Malacological Report. Chelsea College Azores
Expedition, July - October 1965. Final Report : 30-38.
Neto, A.I. – 1997. Studies on algal communities of São Miguel,
Azores, X+309pp.. Dissertação para a obtenção do Grau de
Doutor em Biologia, especialidade de Biologia Marinha. Universidade dos Açores, Ponta Delgada.
Neto, A.I. and J.M.N. Azevedo. – 1990. Contribuição para o estudo
dos padrões de zonação litoral da ilha das Flores. In: Relatórios
e Comunicações do Departamento de Biologia. Expedição
Científica Flores/89 (Relatório Preliminar), 18: 89-102.
Neto, A.I., I. Tittley, A.L. and F. Farnham. – 2000. Structure and
zonation of algal communities in the bay of São Vicente (São
Miguel, Azores). Arquipélago. Life and Marine Sciences Supplement 2 (Part A): 63-69.
Pearson, T. and R. Rosenberg. – 1978. Macrobenthic succession in
relation to organic enrichment and pollution of the marine environments. Oceanogr. Mar. Biol. Annu. Rev., 16: 229-311.
Pereira, F. – 1981. Prosobranquios asociados a Codium vermilara
(Talofita: Cloroficea). Iberus, 1: 39-46.
Pité, M.T. and T. Avelar. – 1996. Ecologia das Populações e das
Comunidades, X + 315pp. Fundação Calouste Gulbenkian,
Lisboa.
Schoch, G. and M. Dethier. – 1996. Scaling up: the statistical linkage bemal abundance and geomorphology on rocky intertidal
shorelines. J. Exp. Mar. Biol. Ecol, 201: 37-72.
Warwick, R.M., H. Platt, K.R. Clarke, J. Agard and J. Gobin. –
1990. Analysis of macrobenthic and meiobenthic community
structure in relation to pollution and disturbance in Hamilton
harbour, Bermuda. J. exp. mar. Biol. Ecol, 138: 119-142.
Warwick, R.M. and K.R. Clarke. – 1993a. Comparing the severity
of disturbance: a meta-analysis of marine macrobenthic community data. Mar. Ecol. Prog. Ser., 92: 224-231.
Warwick, R.M. and K.R. Clarke. – 1993b. Increased variability as
a symptom of stress in marine communities. J. Exp. Mar. Biol.
Ecol., 172: 215-226.
Scient. ed.: J.D. Ros
MOLLUSCS IN HALOPTERIS SPP. 125
126 A.C. COSTA and S.P. ÁVILA
TOTAL
0
0
0
0
0
0
878
0
0
0
0
31
0
0
0
16
0
0
0
0
0
0
0
0
0
0
0
0
0
16
0
172
0
0
455
16
16,191 1,583
Alvania angioyi
44
Alvania cancellata
0
Alvania poucheti
0
Alvania sleursi
0
Anachis avaroides
29
Arca tetragona
0
Bittium sp.
15,559
Bivalvia n.id.
0
Cardita calyculata
15
Cerithiopsis barleei
15
Cerithiopsis tubercularis
15
Crisilla postrema
0
Eulima sp.
0
Crassadoma pusio = H. distortus
0
Jujubinus exasperatus
0
Jujubinus pseudogravinae
0
Jujubinus striatus
0
Jujubinus sp.
15
Manzonia unifasciata
29
Mitrolumna sp.
0
Ocinebrina aciculata
0
Odostomia sp.
0
Odostomella doliolum
0
Omalogyra atomus
0
Parvicardium vroomi
88
Plagiocardium papillosum
0
Pollia dorbignyi
0
Raphitoma sp.
0
Raphitoma linearis
0
Rissoa guernei
59
Setia sp.
59
Setia subvaricosa
29
Sinezona cingulata
0
Trichomusculus semigranatus
0
Tricolia pullus azorica
235
Triphora sp.
0
882 12,449 17,298 6,142 7,354 5,020 11,805 6,394 10,973 7,547
0
18
0
51 217
40 713
0
54
138
0
0
0
0
0
0
0
32
0
0
0
0
0
0
0
0
0
0
0
17
0
0
0
0
0
0
0
0
0
17
0
37
65
17
43
40 119
32
54
52
0
5
0
0
0
0
0
0
0
0
519 11,777 15,991 5,821 3,167 1,943 8,694 4519 9,919 6,114
17
0
0
0
22
0
0
0
0
0
0
0
0
0
0
0
0
0
27
35
0
0
0
0
0
0
0
0
0
0
0
0
0
0
0
0
0
16
0
0
0
9
0
0
87
0
0
16
0
17
0
0
0
0
0
0
0
0
0
0
0
0
0
0
0
0
0
0
81
52
0
18
0
34
0
0
0
16
0
0
17
0
22
0
43
0
24
0
0
0
0
0
0
0
0
0
0
0
0
0
0
23
0
17
0
0
0
16
0
0
0
5
0
0
22
0
0
0
0
0
0
0
0
0
0
0
24
16
0
17
0
9
22
17
0
40
24
64
0
35
0
0
0
0
22
40
0
0
27
0
0
0
0
0
0
0
0
16
0
0
0
0
0
0
0
0
0
64
27
0
0
5
261
0
0
0
0
0
27
17
0
0
0
0
0
0
0
0
0
0
0
0
0
0
43
0
0
0
0
0
0
0
0
0
0
0
0
0
0
0
0
9
0
17
0
0
0
0
0
0
17
283
566
85
0
0
0
16
0
0
0
14
0
0 217 121 190
32
54
17
0
59
0
34 2,928 2,429 1,734 1,202 432
708
17
0
0
0
22
0
0
16
0
17
0
0
0
0
43
40
0
0
0
0
294
178
349
34 456 324 285
288 270
276
0
0
22
17
22
0
0
32
0
17
SVC1 SVC2 SVC3 RBA1 RBA2 RBA3 ATA1 ATA2 ATA3 CAL1 CAL2 CAL3
56
0
0
0
0
21
0
26
0
0
0
0
0
0
0
0
0
5
0
0
0
0
0
0
0
0
0
0
0
0
0
0
5
0
0
0
0
RQ1
265
0
0
0
0
0
0
105
0
0
0
0
0
0
0
0
0
0
0
0
0
0
0
0
0
0
0
0
0
0
130
0
31
0
0
0
0
RQ2
ILH2
482 3,947 18,177 15,122 2,142 1,304 6,206
6
0
0
0
0
0
0
0
6
0
0
0
944 5,629
0
0
6
0
0
0
0
0
0
0
0
0
0
0
0
0
0
0
0
0
0
0
11
0
0
0
0
0
0
0
0
0
0
0
63
57
0
11
0
0
0
0
0
0
120 238
0
0
97 215
0
0
6
0
46
57
0
0
ILH3 COF1 COF2 COF3
8 263
55
0
0
0
0
0
0
0
0
0
0
0
0
0
0
0
0
0
0
0
0
488
15
0
0
0
0
0
105 2,105 17,072 13,902 1,538
0
0
0
0
0
0
0
0
244
0
0
0
0
0
0
0
0
0
0
8
8
0
55
0
0
0
0
55
0
0
0 263
55
0
0
0
0
276
0
15
0
0
0
0
0
0
0
55
0
0
0 526
55
0
0
0
0
0
0
0
0
0
0
0
0
0
0
166
0
0
0
0
0
0
0
0
0
0
0
0
0
0
0
0
0
23
0
166
244
0
0
0
0
0
0
0
0
0
0
0
8
0
0
0
8
0
0
0
0
0
166
0
0
0 294
0
0
0
0
0
158 263
0
0 204
0
0
0
0
0
0
0
0
0
0
8 526
110
244
60
0
0
55
0
0
RQ3 ILH1
APPENDIX. – Molluscan abundance (ni/100g ADW) of the three replicate samples at each of the sampled sites in São Miguel island, Azores. Other abbreviations as in Figure 1.
Baixar