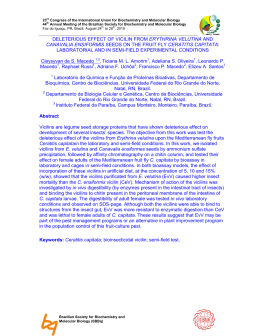
UGT1A1 GENE VARIANTS AND TOTAL BILIRUBIN LEVELS
IN HEALTHY SUBJECTS AND IN GILBERT SYNDROME PATIENTS
Carina Rodrigues1,2, Emília Vieira3, Rosário Santos3, João de Carvalho4,
Alice Santos-Silva1,5, Elísio Costa5,6 & Elsa Bronze-da-Rocha1,5
1- Faculdade de Farmácia da Universidade do Porto; 2 - Escola Superior de Saúde do Instituto Politécnico de Bragança; 3 - Instituto de
Genética Médica Dr. Jacinto Magalhães INSARJ, Porto ; 4 - Serviço de Gastrenterologia, Centro Hospitalar de Vila Nova de Gaia; 5 - Instituto
de Biologia Molecular e Celular da Universidade do Porto; 6 - Instituto de Ciências da Saúde da Universidade Católica, Porto, Portugal.
1. INTRODUTION
The Gilbert syndrome (GS) is a benign form of
unconjugated
hyperbilirubinemia,
mainly
associated with variants in UTGT1A1 gene [1].
In Caucasians, behind the most common
genetic polymorphirsm, the seven repeat
observed at the promoter A(TA)nTAA motif,
another polymorphism a T>G transition at
position -3279, at the phenobarbital responsive
enhancer module, has also been associated
with GS [2]. The aim of this study was the
analysis of the impact of both promoter and/or
coding region of UGT1A1 variants on bilirubin
levels, in GS patients and in healthy controls.
Additionally, bioinformatics tools were used to
study the new identified variants in order to
evaluate their clinical significance.
3. RESULTS
Table 1. Diplotypes frequencies of the two promoter UGT1A1polymorphisms
and total bilirubin levels (TBL) in GS patients and in controls.
GS Patients
Data from genotyping revealed
This study included 45 GS Caucasian patients
(36
males
and
9
females,
of
the
gastroenterology department of Vila Nova de
Gaia/Espinho Hospital Center, EPE, with
clinical diagnosis of GS, based on standard
criteria [3]. Hyperbilirubinemia was defined for
concentrations of total bilirubin levels (TBL)
above 17.1 µmol/L. Data from GS patients were
obtained from medical records. At the time of
study they all presented normal physical
examination, liver function tests and blood cell
counts. Healthy control participants (n=161; 45
males and 116 females; were included in this
work. All participants, GS patients and healthy
controls, gave their informed consent to
participate in this study.
Assays
Blood samples of controls were collected in
the morning after 8 hours of fasting in order to
obtain plasma and buffy coat for DNA
extraction. TBL concentration was determined
by using a colorimetric method. Genomic DNA
was extracted from blood samples using
standard salting out method. All patients and
controls were screened for the presence of the
TA insertion in the TATA box region of UGT1A1
gene by PCR amplification, with the
introduction of a fluorochrome label (NED™)
in the reverse primer as previously described
[1] and the length of fragments were
determined by capillary electrophoresis. Direct
sequencing of the five exons, and the c.-3576
to c.-3209 region of UGT1A1 gene was done in
independent sequencing reactions, using the
respective forward and reverse primers, and
by the Dye Terminator Cycle Sequencing Kit
(Perkin Elmer, Boston, USA) [1].
Bioinformatics Tools and Data Analysis
The potential pathogenicity of the new
variants and the correspondent altered
sequences were analyzed by 5 web available
tools: Polyphen-2, SIFT, A-GVGD, Grantham
Distance and BLOSUM62.
For statistical analysis appropriate tests were
applied using Statistical Package for Social
Sciences (version 18, SPSS Inc., Chicago,
USA).
Diplotypes
c.-41_-40dupTA /
the presence of two promoter
% (n)
TBL
(µmol/L)
% (n)
TBL
(µmol/L)
p*
0% (0)
-
33.5% (54)
7.7 ± 3.1
<0.0001
-
11.2% (18)
6.9 ± 3.4
c.-3279T>G
polymorphisms, c.-41_-40dupTA
[TA]6 / [TA]6 -TT
and c.-3279T>G, in both groups
[TA]6 / TA]6 -TG
0% (0)
[TA]6 / [TA]7-TG
8.9% (4)
27.8 ± 7.4
32.9% (53)
9.6 ± 4.9
[TA]7 / [TA]7-TG
4.4% (2)
29.1 ± 0.5
0% (0)
-
[TA]6 / [TA]6-GG
0% (0)
-
1.9% (3)
8.4 ± 3.8
[TA]6 / [TA]7-GG
8.9% (4)
34.8 ± 7.6
10.6% (17)
9.5 ± 4.3
[TA]7/ [TA]7-GG
77.8% (35)
37.9 ± 13.3
9.9% (16)
19.5 ± 9.9b
(GS patients and controls) with
significant different allelic and,
consequently, diplotype
distribution (table 1).
TBL: total bilirubin levels that are presented as mean ± standard deviation (SD); a p-value for
difference in total bilirubin levels between the several diplotypes; b Multiple comparison analysis
reveals that only [TA]7/[TA]7-G/G TBL were significant different from other diplotypes.
2. MATERIAL AND METHODS
Subjects
Controls
From the nine possible diplotypes combinations, four were found in GS patients and six in controls. Sequencing
analysis of the coding regions of the UGT1A1 gene allowed the identification of nine (Fig. 1) additional single-nucleotide
polymorphisms (SNPs), all of them in a heterozygous state. Out of these, five were identified in GS patients and four in
controls (table 2).
p.M272V
p.V386I
p.E180Q
::::::::
1
p.V225G
NH2
PS
p.I492T
p.M404T
p.I215V
Fig. 1 - Representation of UGT1A1
gene and UGT1A1 protein (adapted
from Servedio et al. 2005). Arrows
indicate the position of the altered
residue in the new identified variants.
Variants p.V225G and p.G308E were
already described [4,5] .
p.V386I
2
:::::::: 3 :::::::: 4 ::::::::
5
p.G308E
Aglycone Binding Domain
UDP-gluc acid Binding Domain
DT
COOH
Carboxy-Terminal Domain
Table 2. Coding region variants and bilirubin levels in GS patients and controls.
Samples
TBL
(µmol/L)
cDNA
variation
Effect
on protein
Functional
Prediction(Score)*
Polymorphism
c.-41_-40dupTA
Polymorphism
c.-3279T>G
References
Patients
Estudos posteriores, em faixas etárias diferentes e em ambos os sexos, deverão ser realizados para determinar
como são influenciados os níveis de bilirrubina.
1/GS
29.4
c.538G>C
p.E180Q
Tolerated (4)
[TA]7/[TA]7
T/G
This study
2/GS
27.7
c.674T>G
p.V225G
Deleterious (3)
[TA]6/[TA]7
T/G
[4]
3/GS
50.1
c.674T>G
p.V225G
Deleterious (4)
[TA]7/[TA]7
G/G
[4]
4/GS
54.2
c.923G>A
p.G308E
Deleterious (4)
[TA]6/[TA]7
G/G
[5]
5/GS
36.6
c.1211T>C
p.M404T
Deleterious (4)
[TA]7/[TA]7
G/G
This study
6/GS
51.3
c.1423C>T
p.R475C
Deleterious (4)
[TA]6/[TA]7
G/G
This study
1/C
5.1
c.643A>G
p.I215V
Tolerated (5)
[TA]6/[TA]7
T/G
This study
2/C
10.1
c.814A>G
p.M272V
Tolerated (4)
[TA]7/[TA]7
G/G
This study
3/C
4.3
c.1156G>A
p.V386I
Tolerated (4)
[TA]6/[TA]6
T/T
This study
4/C
5.8
c.1475T>C
p.I492T
Deleterious (3)
[TA]6/[TA]7
T/G
This study
Controls
The annotation of the mutations was done according to the recommendation of the HGVS. TBL: total bilirubin levels. * Scores are
given empirically, taken in account the number of algorithms in agreement.
4. CONCLUSIONS
• Bilirubin levels are mainly determined by the presence of the TA duplication in the repetitive TATA-box
sequence of the gene promoter;
• The other promoter polymorphism, c.-3279T>G, is an additional factor for the development of
hyperbilirubinemia;
• The presence of variants in the coding region of the gene seems to be associated with increased bilirubin
levels and, therefore, associated with GS;
• We describe, for the first time, seven new variants in the coding region of the gene, expanding the spectrum
of known UGT1A1 variants.
REFERENCES: [1] Costa E, et al. Blood Cell Mol. Dis. 2006; 36:77-80.; [2 ] Costa E, et al. Clin. Chem. 2005; 51:2204-2206; [3] Sanpietro M, et al. Haematologica 1999; 84:1501-1507. [4] - Beutler
E, et al. Proc. Natl. Acad. Sci. USA. 1998; 95:8170-4 ; [5] Erps T, et al. J. Clin. Invest. 1994; 93:564-570.
ACKNOWLEDGEMENTS: This work was supported by a PhD grant (SFRH/BD/42791/2007) from Fundação para a Ciência e Tecnologia (FCT) and Fundo Social Europeu (FSE).
Baixar