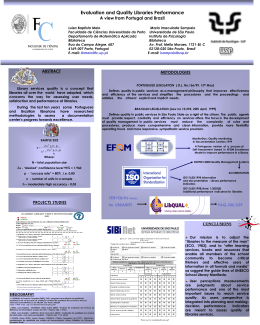
The Atlantic forest geosensor network pilot study. Part 2: data analysis and prospects Name Humberto Rocha Title Professor, Department of Atmospheric Sciences (IAG) Institution Universidade de São Paulo (USP) 1. Experimental site in the Atlantic Forest 2. Spatial and temporal patterns of measured temperature 3. Prospects to investigate the Amazonian environment TEAM 1. Universidade de São Paulo Helber Freitas, Nilson Neres, Jonatan Tatsch (Laboratorio de Clima e Biosfera) 2. MSR Juliana Salles, Rob Fatland 3. INPE Carlos Nobre, Marcio Santana, Patricia Santana, Rogerio Carneiro, Celso von Randow 4. JHU Doug Carlson and Andreas Terzis 5. Unicamp and Cena/Usp Carlos Joly, Luiz Martinelli Laboratório de Clima e Biosfera, IAG/Usp – technicians and students Helber Freitas Emilia Brasilio Meteorologist Meteorologist, MSc Nilson Neres, Engineer Carlos Fagiolo Meteorologist Gabriel Costa Meteorologist, MSc Eduardo Gomes Electronics technician • • • • • • 5 PhD students Jonatan Tatsch Jonathan Motta Monica Queiroz Helber Freitas Rogerio Carneiro • • • • 3 MSc students Bruno Paraluppi Giampiero Bini Cinthia Avellar • • • 1 Post Doc Ana Elizabethe da Silva) Laboratório de Clima e Biosfera, IAG/Usp 1. Observações de campo Sítios experimentais com torres de fluxo e vertedor hidrológico 2. Modelagem biosfera-atmosferahidrosfera modelo atmosférico BRAMS modelo hidrológico (modelo DHBM com SiB2; modelo SWAT) Sítio Experimental: Ribeirão Casa de Pedra Watershed Parque Estadual da Serra do Mar (23 19' 42.5'' S; 45 05' 35.2 '' W) o o ~ 2,5 km2 flux tower Temático FAPESP 03/09289-9. Coordenação: Humberto Rocha (Usp) Temático FAPESP 2003/12595-7 Biota Gradiente Funcional: Coordenador: Carlos Joly (Unicamp). 60m flux tower with meteorological instrumentation Flux tower monitoring topo Controle base Umidade do solo Efluxo CO2 do solo Previous data of flux tower Geosensor network in the Atlantic forest N S Main flux tower Network in the Atlantic Forest, wich includes five 25m towers linked by Kevlar cables. The network was placed east of the main tower, along an altitudinal transect of ~60m height. (Pilot Experiment) Geosensor network in the Atlantic forest : experimental design Tower 4 Tower 3 Upper tier sensors 29 09 11 31 12 32 10 08 28 30 20 156 thermometers 14 34 52 hygrometers 50 13 33 15 35 49 03 23 48 07 27 47 06 26 Total 52 motes = 37 36 16 17 46 Tower 6 02 22 45 05 25 44 04 24 43 01 21 18 38 42 x Tower 2 Vertical profile sensors 40 x 39 x 19 Ground tier sensors x approximated scale 50m x Tower 1 Tower 5 20 m height Upper tier design with 18 nodes Spatial variability at 25 m height Sampling area : ~ 80 m x 120 m 18 nodes Each node with 1 or 2 motes Spatial variability at 25 m height Period of measurements: 16Nov-18Dec 2009 19Nov 20 40 60 sunny 0 Height from ground surface (m) Vertical variation of the temperature 20Nov partly 21Nov cloudy overcast Visualization of spatial variability at 25 m height Node 6 7/60 8 9 13 27/30 29/50 40/41 42/69 44/47 46 51/52 56/58 57/63 59/61 62/66 64 65 Location Tower 3-4 Tower 2-3 Tower 1-5 Tower 3-6 Tower 1-2 Tower 4 Tower 2 Tower 3 Tower 5 Tower 1 Tower 6 Tower 1-6 Tower 4-5 Tower 4-5 Tower 2-3 Tower 4-6 Tower 5-6 Tower 2-6 Nome T341 T232 T151 T361 T121 T441 T221 T331 T551 T111 T661 T161 T451 T452 T231 T461 T561 T261 X (m) 14 15,5 79 22 58 23,5 36 5 77,5 80 38 58,5 41,5 59,5 25,5 31 58 37 Y (m) 105,5 63,5 27 72 0 114,5 0 96,5 52 0 47 24 93,5 73 33 80,5 49,5 24 Node temperature value assigned: median of all thermometers each node Visualization: deviation from minimum temperature Maximum daily temperature Deviation from minimum temperature Minimum temperature 1. Experimental site in the Atlantic Forest 2. Spatial and temporal patterns of measured temperature 3. Prospects to investigate the Amazonian environment Thematic Projet FAPESP Carbon Tracker and Water availability: controls of land use and climate changes (2009-2014). Coordination USP - Will survey Amazon basin with aircraft, satellite, flux tower and use numerical inversion computer modelling to estimate regional Carbon balance Laboratório de Clima e Biosfera – sítios experimentais em florestas tropicais Fluxnet (global network) Conclusions 1) Outstanding capacity of cooperation and expertise in only 1 year work (May 2009-April 2010) with five institutions • Preliminary analysis showed physically sounding data • Detection of improvements (e.g. humidity measurement, sensor accuracy) 2) Foreseeing to monitor Amazonia Wild environment with largest worldwide tropical forest, 20% world freshwater and an enormous biodiversity Supportive on going projects: Fapesp-MSR 2009-2011 : sensor and software development (von Randow/Inpe + Usp) LBA/Fapesp Carbon Tracker 2009 – 2014 : regional multi-disciplinary data Next steps: to adress which relevant questions to answer, partnerships, and how technology can help science and environment
Download
