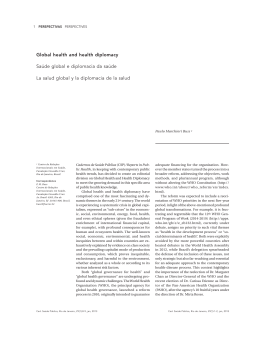
ARTIGO ARTICLE
Infant mortality in the Federal District, Brazil:
time trend and socioeconomic inequalities
Mortalidade infantil no Distrito Federal, Brasil:
tendência temporal e desigualdades
sócio-econômicas
Renata Alves Monteiro 1
Bethsáida de Abreu Soares Schmitz
1 Secretaria de Atenção à
Saúde, Ministério da Saúde,
Brasília, Brasil.
2 Faculdade de Ciências
da Saúde, Universidade de
Brasília, Brasília, Brasil.
Correspondence
R. A. Monteiro
Departamento de Ações
Programáticas Estratégicas,
Secretaria de Atenção à
Saúde, Ministério da Saúde.
Esplanada dos Ministérios,
Bloco G, 6 o andar, sala 625,
Brasília, DF
70058-900, Brasil.
[email protected]
[email protected]
2
Abstract
Introduction
This study examined the trend in the infant
mortality rate in the Federal District of Brazil
(or Greater Metropolitan Brasilia, the national
capital) from 1990 to 2000, analyzing the rate
according to 5 administrative areas stratified by
mean family income, from 1996 to 2000. An ecological time-series study was conducted using the
Information Systems on Live Births and Mortality, produced by the Brazilian Ministry of Health.
The infant mortality rate (IMR) decreased by
45.2% from 1990 to 2000, from 26.3 per 1000
live births to 14.4, or a mean annual reduction
of 5.34% (R2 = 0.9397; p < 0.0001). During this
period there was a higher proportion of neonatal deaths. However, a higher percentage change
occurred in the post-neonatal period (-59.0%, R2
= 0.8452, p < 0.0001). Investigation of the IMR in
the various areas of the Federal District showed a
reduction in differences among the regions with
respect to the component rates; however, substantial disparities persisted in relation to the income
variable. The results suggest the need for effective
interventions in the determinants of neonatal
and post-neonatal mortality in order to improve
maternal and infant health in all socioeconomic
groups in the Federal District.
One of the principal indicators of quality of life
and health for a given community is the infant
mortality rate (IMR), which is highly sensitive
for measuring social well-being and is directly
related to the population’s environmental and
socioeconomic conditions 1,2. IMR measures the
risk of a newborn dying during the first year of
life 3.
Infant mortality has undergone a continuous
decline in recent years, but at different rates according to country. While the IMR is low in developed countries like Japan (4.0 per 1,000 live
births in 1995) 4, the current levels in developing
countries like Brazil are higher than those in developed countries in the 1960s (Brazil’s IMR in
2000 was 27.1) 5.
Meanwhile, the decline in Brazil’s IMR has
been rather tenuous as compared to developing
countries with similar socioeconomic characteristics, and regional disparities between different population groups have actually increased
6,7,8,9,10. The difference in infant mortality between the South and Northeast of Brazil, which
was 40% in the 1930s, increased to 140% by the
late 1970s and 300% by the late 1990s 9.
The Federal District, where the national capital is located, has shown a downward trend in
IMR to levels similar to those in various States
of the country, from 41.0 per 1,000 live births in
1980 to 23.8 in 1989 11.
Infant Mortality; Maternal and Child Health; Information Systems; Ecological Studies
Cad. Saúde Pública, Rio de Janeiro, 23(4):767-774, abr, 2007
767
768
Monteiro RA, Schmitz BAS
The present study aimed to characterize infant mortality trends in the Federal District from
1990 to 2000, analyzing differences in overall IMR
and component rates with regard to family socioeconomic status in the administrative areas
comprising the Federal District.
Methods
The Federal District is located in the Central West
region of Brazil and has an area of 5,789 km², currently divided into 19 administrative areas. According to the 2000 census, the Federal District
had 2,051,000 inhabitants, approximately 2% infants (< 1 year of age) 12,13.
In 1998, the Federal District ranked first,
ahead of all the States in Brazil, in the human
development index (HDI). The United Nations
recommends the HDI as an overall indicator of
human development based on income, education, and life expectancy 14.
The Federal District HDI was 0.869 in 1998,
indicating a high degree of human development, higher than the overall index for Brazil in
2000 (0.757), when the country ranked 73rd
worldwide 10,14.
An ecological time-series study was conducted, based on data from the Mortality Information
System and Live Births Information System coordinated by the Brazilian Ministry of Health 15. The
quality of Federal District mortality data is considered adequate 16,17. The infant mortality rate
has been calculated directly since 1999, although
the data quality had been proven even earlier.
The study population consisted of all recorded deaths of infants (< 1 year of age) in the
Federal District from 1990 to 2000. The study
adopted the definitions of infant mortality and
the component rates as proposed by the World
Health Organization (WHO) and Brazilian Ministry of Health 18.
Since there was a marked change in the composition of the administrative areas in the Federal District from 1990 to 1995, it was not possible
to stratify by administrative area before 1995. The
first study of the decentralized Federal District
based on administrative areas was performed in
1996, when separate data had become available
for the currently existing administrative areas under the Federal District’s spatial apportionment.
To determine the development of spatial differences in infant mortality in the Federal District, the administrative areas were aggregated in
5 groups as of 1996, according to mean family income as suggested by the Committee for the Development of the Central Plateau (CODEPLAN) 19
and described in Table 1. Data on family income
Cad. Saúde Pública, Rio de Janeiro, 23(4):767-774, abr, 2007
were obtained by CODEPLAN through the Federal District Socioeconomic Family Survey, using
a probabilistic sample. The regions formed by the
5 groups of administrative areas do not always
form areas with common borders.
The 1990-2000 trends in IMR and component
rates by age for the five groups of administrative areas and the entire Federal District were
analyzed with an exponential regression model,
which was both well-adapted to the data and statistically powerful 20.
Besides the mean annual decline (%), the determination coefficient (R2) was also analyzed,
with an α of less than 0.05 considered significant.
To analyze the relationship between income spatial groups, the infant mortality rates ratio was
obtained, using the mortality rate for the highest
family income group as the reference.
Results
The IMR has declined consistently in the Federal
District in recent years. From 1990 to 2000 there
was a 45.2% decline in IMR, from 26.3 to 14.4 per
1,000 live births. As shown in Table 1, the mean
annual decrease was 5.34%. The exponential IMR
reduction was 0.0533 per year during that period,
showing a representative decline and maintaining the trend from the previous decade (Table 2
and Figure 1).
Of the recorded infant deaths, the highest
proportion occurred during the neonatal period,
but the largest decline was post-neonatal. The
post-neonatal mortality rate in 1990 was 10.5 per
1,000 live births, dropping to 4.3 in 2000, or a decrease of 59% and a mean annual drop of 7.8%.
The exponential trend was -0.0437 per year (R2 =
0.852; p < 0.001).
During the period studied, the 35.1% change
in the neonatal mortality rate was due to a 41.5%
drop in early neonatal mortality, since late neonatal mortality did not change (R2 = 0.0046, p =
0.8). The mean annual decrease in the neonatal
mortality rate was 3.85%, as compared to 4.76%
in the early neonatal mortality rate.
Infant mortality provides evidence of key
socioeconomic differences among the various
administrative areas in the Federal District, although these differences in the IMR and component rates have been decreasing over the years
(Tables 3 and 4).
The infant mortality trend in Group 1, with the
highest income in the Federal District, showed
an increase in IMR and component rates from
1996 to 2000, with the exception of early neonatal
mortality, which declined by 5.4%, or 1.14% per
year. However, only the positive changes in late
INFANT MORTALITY: TIME TREND AND SOCIOECONOMIC INEQUALITIES
Table 1
Stratification of administrative areas in the Federal District, Brazil, according to mean monthly family income.
Economic class *
Group 1
Group 2
Group 3
Group 4
Group 5
Administrative area
Mean monthly
Mean monthly
Percentage of total
family income **
family income
Federal District
for group **
population ***
50.3
I – Brasília
32.5
XVI – Lago Norte
52.7
XVIII – Lago Sul
65.8
III – Taguatinga
16.1
VIII – Núcleo Bandeirante
18.1
X – Guará
20.7
XI – Cruzeiro
24.0
II – Gama
9.0
V – Sobradinho
11.0
XVII – Riacho Fundo
9.8
XIX – Candangolândia
11.4
IV – Brazlândia
6.5
VI – Planaltina
6.1
IX – Ceilândia
7.6
XII – Samambaia
7.6
VII – Paranoá
4.6
XIII – Santa Maria
5.0
XIV – Agrovila São Sebastião
5.3
XV – Recanto das Emas
4.7
Live births
1996
2000
12.3
4,452
4,166
19.7
22.5
9,348
9,527
10.3
15.5
7,475
7,664
7.0
34.5
18,070
18,142
4.9
15.2
5,864
7,305
* Companhia do Desenvolvimento do Planalto Central 19;
** In times the monthly minimum wage;
*** Anuário Estatístico do Distrito Federal 12.
Note: The monthly minimum wage in February-April 1997 was approximately U$107 (R$112).
neonatal mortality (p = 0.002) and IMR (p = 0.02)
were significant. Meanwhile, in 1996 Group 1 had
the lowest IMR, compared to the other 4 groups
(Table 4). In 2000, its IMR was only higher than
that of Group 2 (11%), which included the second
highest-income areas, next to Group 1.
In Group 2, every component of infant mortality declined, but the difference in the postneonatal mortality rate was not statistically significant (p > 0.05).
Group 3 showed the same infant mortality
trend as in Group 1, but to a lesser degree and
not statistically significant (p > 0.05), indicating
stagnation in the rates during the 5-year period.
Still, the gap between mortality rates in Groups 1
and 3 decreased: in 1996, the IMR in Group 3 had
been 84% higher than in Group 1, but by 2000 the
difference was only 17%.
The IMR in the other income groups underwent a statistically significant decrease (p < 0.05).
However, when the infant mortality components
were analyzed separately in Groups 4 and 5, al-
though there was some percentage change in all
of them, a significant reduction only occurred in
early neonatal mortality in Group 4 (p = 0.02).
Based on data in Table 3, the largest reduction
in IMR and the component rates was in Group 2,
followed by Group 5, the latter having the lowest
income in the Federal District. Unlike the other
groups, 2 and 5 showed the greatest drop in IMR,
with -45.1% and -30.4%, respectively, in the late
neonatal component (p > 0.05).
Despite the increase in IMR in Groups 1 and 3
from 1996 to 2000, the highest IMR in the Federal
District was in the lowest income group (number
5). However, the difference between Group 5 and
that with the lowest IMR decreased during the
period studied (155% in 1996, but only 18% by
2000).
As for the infant mortality components,
the largest decline in neonatal mortality was in
Group 2 (p = 0.004), which had the lowest neonatal mortality rate in the Federal District in 2000
(7.1/1,000 live births).
Cad. Saúde Pública, Rio de Janeiro, 23(4):767-774, abr, 2007
769
Monteiro RA, Schmitz BAS
Table 2
Results of exponential regression analysis of infant mortality rate and its components. Federal District, Brazil, 1990 and 2000.
Mortality rate
Number of deaths
1990
Mortality rate
Mean annual
Exponential
(per 1,000 live births)
decline (%)
model
2000
1990
2000
∆%
R2
p value
Early neonatal
474
365
13.0
7.6
-41.5
-4.76
Y = 13.033e-0.0437x
0.8619
Late neonatal
89
113
2.4
2.4
–
–
Y = 2.6744e-0.0019x
0.0046
0.8
Neonatal
563
478
15.4
10.0
-35.1
-3.85
Y = 15.703e-0.0354x
0.8292
< 0.0001
Post-neonatal
384
207
10.5
4.3
-59.0
-7.80
Y = 9.7937e-0.0437x
0.8452
< 0.0001
Infant *
960
691
26.3
14.4
-45.2
-5.34
Y = 26.496e-0.0533x
0.9397
< 0.0001
1990
2000
36,460
47,982
Live births
< 0.0001
R2: Determination coefficient;
* Including deaths of infants (< one year) with unknown age (1.3% in 1990; 0.9% in 2000).
Figure 1
Infant mortality rate and components. Federal District, Brazil, 1990-2000.
30.0
Infant mortality rate
25.0
20.0
15.0
10.0
5.0
%
770
0.0
1990
1991
1992
1993
1994
1995
1996
The greatest reductions in the post-neonatal
mortality rate were in Groups 4 (p = 0.02) and 2
(p > 0.05), and the greatest increase was in Group
1 (131.5%), although not significant (p > 0.05).
Group 1 thus had the lowest post-neonatal mortality rate in the Federal District in 2000 (3.1 per
1,000 live births).
Cad. Saúde Pública, Rio de Janeiro, 23(4):767-774, abr, 2007
1997
1998
1999
2000
Discussion
The infant mortality rate reflects a population’s
living conditions, nutrition, and health, as well
as aspects related to the social responsibility of
a given society and its government, since it indicates the odds of infant survival 21.
INFANT MORTALITY: TIME TREND AND SOCIOECONOMIC INEQUALITIES
Table 3
Infant mortality rate and components in 5 groups of administrative areas based on mean monthly family income.
Federal District, Brazil, 1996 and 2000.
Mortality rate
Number of deaths
Mortality rate *
1996
2000
Mean annual
∆%
p value
1996
2000
decline (%)
Early neonatal
24
21
5.4
5.1
-5.4
-1.14
0.82
Late neonatal
4
18
0.9
4.3
380.9
36.72
0.002
Neonatal
28
39
6.3
9.4
49.8
8.33
0.11
Post-neonatal
6
13
1.3
3.1
131.5
18.98
0.08
Infant
34
52
7.6
12.5
63.4
10.46
0.02
Early neonatal
78
53
8.3
5.6
-33.3
-7.57
0.02
Late neonatal
25
14
2.7
1.5
-45.1
-11.09
0.07
Neonatal
103
67
11.0
7.1
-35.6
-8.38
0.004
Group 1
Group 2
Post-neonatal
50
38
5.3
4.0
-25.4
-5.47
0.17
Infant **
153
107
16.3
11.1
-31.9
-7.40
0.002
Early neonatal
66
62
8.8
8.1
-8.4
-1.64
0.62
Late neonatal
9
18
1.2
2.3
95.1
13.90
0.10
Neonatal
75
80
10.0
10.4
4.0
0.79
0.8
Post-neonatal
30
32
4.0
4.2
4.0
0.98
0.9
Infant
105
112
14.0
14.6
4.0
0.84
0.77
Early neonatal
156
129
8.6
7.1
-17.6
-3.76
0.1
Late neonatal
56
47
3.1
2.6
-16.4
-3.46
0.36
Neonatal
212
176
11.7
9.7
-17.3
-3.68
0.06
Post-neonatal
106
76
5.9
4.2
-28.6
-6.57
0.02
Infant
318
252
17.6
13.9
-21.1
-4.61
0.005
Early neonatal
56
55
9.5
7.5
-21.2
-4.62
0.21
Late neonatal
15
13
2.6
1.8
-30.4
-7.09
0.34
Neonatal
71
68
12.1
9.3
-23.1
-5.13
0.12
Group 3
Group 4
Group 5
Post-neonatal
43
40
7.3
5.5
-25.3
-5.50
0.18
Infant
114
108
19.4
14.8
-24.0
-5.27
0.04
* Per 1,000 live births;
** Including deaths of infants (< one year) with unknown age (in 1996, none; in group 2, 0.9% in 2000).
Due to the effectiveness of measures to decrease the IMR (specific actions in health and
education), infant mortality has been treated as
a priority health problem in developed countries
as well, where very low IMR levels have been
reached.
Income is one of the most widely used measurements of socioeconomic status with a direct
impact on infant mortality 22. In Andrade et al. 22,
where income and schooling were chosen as
indicators to detect inequalities in perinatal
mortality, income was the variable that most explained IMR inequalities. This is one reason why
the current study used this variable, while rec-
ognizing that different realities can be obtained,
depending on the variables selected to measure
living conditions 23.
There was a real and consistent decline in
infant mortality in the Federal District, currently showing among the lowest infant mortality,
neonatal mortality, and post-neonatal mortality
rates in Brazil 18. In the 1990s, the mean annual
decline in the Federal District was the same as
for the previous decade (5.3%) 11, but there was
no apparent increase in this downward trend in
the IMR. None of the States of Brazil with low IMR
showed a mean annual decline close to that of the
Federal District, with the greatest drop (5.27%)
Cad. Saúde Pública, Rio de Janeiro, 23(4):767-774, abr, 2007
771
772
Monteiro RA, Schmitz BAS
Table 4
Ratio of mortality rates among 5 groups of administrative areas based on mean monthly family income.
Federal District, Brazil, 1996 and 2000.
Mortality
Ratio of mortality rates among 5 groups of administrative areas in Federal District
2/1
3/1
4/1
5/1
1996
2000
1996
2000
1996
2000
1996
2000
Early neonatal
1.54
1.10
1.63
1.59
1.59
1.39
1.76
1.47
Late neonatal
3.00
0.35
1.33
0.53
3.44
0.60
2.89
0.42
Neonatal
1.75
0.76
1.59
1.11
1.86
1.03
1.92
0.99
Post-neonatal
4.08
1.29
3.08
1.35
4.54
1.35
5.62
1.77
Infant
2.14
0.89
1.84
1.17
2.32
1.11
2.55
1.18
occurring in the city of Belo Horizonte; however
infant mortality in this city was higher than in the
Federal District (22.1 in 1998) 24.
Meanwhile, the overall trend was not observed in all administrative areas of the Federal
District. The results for Group 1, consisting of
the most highly developed administrative areas,
was unexpected, as was the convergence of rates
(among groups of administrative areas) towards
values close to 15.0 per 1,000 live births. This may
have resulted from the saturation of effects of
some environmental interventions and various
previously achieved benefits 21. Goldani et al. 25
observed a similar situation (in an economically
better-off group) in a city in São Paulo State.
From 1990 to 2000, the Federal District experienced changes in both its geographic structure
and demographic make-up. The population increased by 21.6%, largely due to migration to the
National capital. New administrative areas (also
known as “satellite cities”) emerged from the
reapportionment of existing areas and the formation of new ones to absorb the rapid population growth. Meanwhile, there was no significant
improvement in factors determining the quality
of life, like income, housing, and education, and
there was a lack of proportional growth in available health services; for example, from 1995 to
1999 the number of hospital beds decreased by
13.7% 12.
The largest proportion of infant deaths occurred during the neonatal period, a global trend
accompanying the reduction in the IMR. The
same trend had already been seen in the previous
decade in the Federal District 11 and elsewhere in
Brazil and Latin America 26,27.
Particularly noteworthy was the stagnation in
the overall late neonatal mortality rate in the Federal District, due to the increase in some areas,
indicating the need to adopt specific measures to
Cad. Saúde Pública, Rio de Janeiro, 23(4):767-774, abr, 2007
directly impact this rate, such as interventions in
maternal health conditions like nutritional and
socioeconomic status, as well as improved prenatal, childbirth, and neonatal care 18,26.
Another possible explanation for the persistent late neonatal mortality rate is that neonatal
intensive care and health technology can prolong
the newborn’s life, even in the face of decreased
odds for longer-term survival 28.
Although maintaining the same rate of decline as in the previous decade, a decrease in the
infant mortality rates was observed in various
groups in the Federal District, which could be
explained by the expanded coverage of specific
health services such as immunization 12 and the
promotion of breastfeeding 28 and extension of
overall health services 13. However, there were no
substantially positive changes in the social structure. Such changes should be prioritized, with
resource allocation, political determination, and
social responsibility, aimed at effective interventions in both neonatal and post-neonatal mortality and an emphasis on perinatal problems
related to maternal and infant health.
The downward trend in the IMR in the Federal District from 1990 to 2000 was similar to that
in the 1980s 11. However, when the rate was analyzed based on the five groups comprising the 19
administrative areas, key differences were identified, related to socioeconomic status and living
conditions. In Groups 1 and 3 the IMR increased,
while other groups showed a decrease, with the
largest percentage change in Groups 2 and 5. The
latter includes the “satellite cities” with the lowest
mean family income and worst living conditions
and is thus a top priority for interventions to effectively reduce infant mortality.
The data presented in this study showed an
unexpected result when the 5 groups of administrative areas comprising the Federal District were
INFANT MORTALITY: TIME TREND AND SOCIOECONOMIC INEQUALITIES
analyzed. Despite evidence of the overall good
quality of death records in the Federal District,
incorrect information on place of residence can
occur and lead to overestimation of mortality,
especially in higher-income areas. Group 1 also
includes a poor area that could tend to increase
the number of deaths recorded there.
However, this evidence does not rule out the
importance of socioeconomic variables, because
although there was a reduction in the differences
in IMR among the 5 groups of administrative
areas, the highest IMR was in the group of administrative areas with the lowest income and
vice versa (the lowest IMR in the highest income
areas). An in-depth causal investigation is thus
necessary.
According to a study by Sena 29 on breastfeeding prevalence in the Federal District, from
1994 and 1999 there was an increase in exclusive
breastfeeding in all income groups, with the ex-
ception of Group 1 (with a decrease of 9.3%). The
largest increase in average duration of exclusive
breastfeeding was in Groups 2 (36.3%) and 5
(103%), and the latter had a longer mean duration of exclusive breastfeeding than Group 1.
Therefore, more effective measures to improve living and health conditions in these population groups are needed to avoid IMR stagnation
at persistently high levels.
The current study thus helps elucidate infant
mortality trends in the Federal District, an area of
Brazil with some of the greatest social inequalities, combining migrants from poorly developed
areas of the country and others with some of its
highest per capita income. The results indicate
the need for in-depth study of the various biosocial and economic variables affecting infant
mortality, in order to plan and implement action
strategies with real impact on the rates observed
in the Federal District.
Resumo
Contributors
O objetivo deste estudo é verificar a tendência da mortalidade infantil no Distrito Federal, Brasil, no período
de 1990 a 2000 e descrevê-la, entre 1996 e 2000, nas
cinco áreas do Distrito Federal estratificadas de acordo
com a renda familiar média. Foi realizado um estudo
ecológico de série temporal utilizando-se os Sistemas
de Informação sobre Nascidos Vivos e Mortalidade
produzidos pelo Ministério da Saúde. O coeficiente
de mortalidade infantil (CMI) reduziu 45,2% entre
1990 e 2000, passando de 26,3 para 14,4 por mil nascidos vivos, sendo a taxa anual de decréscimo de 5,34%
(R 2 = 0,9397; p < 0,0001). Ocorreu no período maior
proporção de óbitos no período neonatal, porém, o
maior decréscimo ocorreu no componente pós-neonatal (-59%, R2 = 0,8452; p < 0,0001). Quando avaliado o
CMI nas diversas áreas do Distrito Federal, observa-se
que houve uma redução na diferença entre as regiões
no que diz respeito a seus componentes, porém foram
mantidas distorções importantes quanto à variável
renda. Os resultados sugerem que há necessidade de
intervenção efetiva nos determinantes da mortalidade
infantil e seus componentes que resulte na melhoria
da saúde materno-infantil em todos os grupos sócioeconômicos do Distrito Federal.
Both authors participated in the article’s design. R. A.
Monteiro conducted the literature review and wrote
the first draft, which was reviewed and received original contributions by B. A. S. Schmitz. Both authors reviewed and approved the final version.
Acknowledgements
The authors wish to thank Delmason Carvalho from
the Federal District Health Secretariat for providing key
data and documents for the study, as well as Gertrudes
Mendonça, Ana Maria Nogales, and Eduardo Freitas for
suggestions on statistical analysis.
Mortalidade Infantil; Saúde Materno-Infantil; Sistemas de Informação; Estudos Ecológicos
Cad. Saúde Pública, Rio de Janeiro, 23(4):767-774, abr, 2007
773
774
Monteiro RA, Schmitz BAS
References
1.
2.
3.
4.
5.
6.
7.
8.
9.
10.
11.
12.
13.
14.
15.
16.
Campos TP, Carvalho MS, Barcellos CC. Mortalidade infantil no Rio de Janeiro, Brasil: áreas de
risco e trajetória dos pacientes até os serviços de
saúde. Rev Panam Salud Pública 2000; 8:164-71.
Mello-Jorge MHP, Gotlieb SLD, Laurenti R. A saúde
no Brasil: análise do período 1996 a 1999. Brasília:
Organização Pan-Americana da Saúde; 2001.
Simões CCS. Perfis de saúde e de mortalidade no
Brasil: uma análise de seus condicionantes em
grupos populacionais específicos. Brasília: Organização Pan-Americana da Saúde; 2002.
Mendonça G. Análise da evolução da mortalidade
infantil em Portugal. Arquivos do Instituto Nacional de Saúde 1996; 22:29-31.
Ministério da Saúde. Indicadores e dados básicos
– Brasil 2004. http://tabnet.datasus.gov.br/cgi/
idb2004/c01.htm (accessed on 03/Jan/2006).
Becker RA, Lechting A. Mortalidade infantil no
Brasil. Ars Cvrandi 1988; 21:68-72.
Barreto ML, Carmo EH. Situação de saúde da população brasileira: tendências históricas, determinantes e implicações para as políticas de saúde.
Inf Epidemiol SUS 1994; 3/4:7-34.
Szwarcwald CL, Leal MC, Castilho EA, Andrade
CLT. Mortalidade infantil no Brasil: Belíndia ou
Bulgária? Cad Saude Publica 1997; 13:503-16.
Simões CCS, Monteiro CA. Tendência secular e
diferenciais regionais da mortalidade infantil no
Brasil. In: Monteiro CA, organizador. Velhos e novos males da saúde no Brasil: a evolução do país
e suas doenças. 2a Ed. São Paulo: Editora Hucitec/
Núcleo de Pesquisa Epidemiológicas em Nutrição
e Saúde; 2000. p. 153-6.
Fundo das Nações Unidas para a Infância. Situação da infância brasileira 2001: desenvolvimento
infantil. Brasília: Fundo das Nações Unidas para a
Infância; 2001.
Schmitz BAS, Bezerra VLVA, Turnes O. Mortalidade
infantil no Distrito Federal (Brasil): 1980-1989. Rev
Saúde Dist Fed 1998; 9:13-22.
Anuário Estatístico do Distrito Federal, 2000 [CDROM]. Brasília: Secretaria do Estado de Desenvolvimento Urbano e Habitação; 2002.
Instituto Brasileiro de Geografia e Estatística.
Base de informações por setor censitário: censo
demográfico 2000 – resultados do universo.
São Paulo: Instituto Brasileiro de Geografia e
Estatística; 2002.
Programa das Nações Unidas para o Desenvolvimento. Relatório do desenvolvimento humano
2002: aprofundar a democracia num mundo fragmentado. Lisboa: Mensagem; 2002.
Ministério da Saúde. Atividades e funções do
sistema de informação – DF (SIS). Brasília: Departamento de Saúde Pública, Secretaria de Saúde do
Distrito Federal/Ministério da Saúde; 2001.
Szwarcwald CL, Leal MC, Andrade CLT, Souza Jr.
PRB. Estimação da mortalidade infantil no Brasil: o que dizem as informações sobre óbitos e
nascimentos do Ministério da Saúde? Cad Saúde
Pública 2002; 18:1725-36.
Cad. Saúde Pública, Rio de Janeiro, 23(4):767-774, abr, 2007
17. Vasconcelos AMN. Qualidade das estatísticas de
óbitos no Brasil: uma classificação das unidades
da federação. In: Anais XII Encontro de Estudos
Populacionais da ABEP [CD-ROM]. Campinas:
Associação Brasileira de Estudos Populacionais;
2000.
18. Rede Interagencial de Informações para a Saúde.
Indicadores básicos para a saúde no Brasil: conceitos e aplicações. Brasília: Organização Pan-Americana da Saúde; 2002.
19. Companhia do Desenvolvimento do Planalto Central. Perfil sócio-econômico das famílias do Distrito Federal. Brasília: Companhia do Desenvolvimento do Planalto Central; 1997.
20. Latorre MRDO, Cardoso MRA. Análise de séries
temporais em epidemiologia: uma introdução
sobre os aspectos metodológicos. Rev Bras Epidemiol 2001; 4:145-52.
21. Leal MC, Szwarcwald CL. Evolução da mortalidade
neonatal no Estado do Rio de Janeiro, Brasil, de
1979 a 1993. 1- Análise por grupo etário segundo
região de residência. Rev Saúde Pública 1996;
30:403-12.
22. Andrade CL, Szwarcwald CL, Gama SGN, Leal MC.
Desigualdades sócio-econômicas do baixo peso ao
nascer e da mortalidade perinatal no Município
do Rio de Janeiro, 2001. Cad Saúde Pública 2004;
20 Suppl 1:S44-51.
23. Guimarães MJB, Marques NM, Melo Filho DA,
Szwarcwald CL. Condição de vida e mortalidade
infantil: diferenciais intra-urbanos no Recife,
Pernambuco, Brasil. Cad Saúde Pública 2003;
19:1413-24.
24. Caldeira AP, França E, Perpétuo IHO, Goulart AM.
Evolução da mortalidade infantil por causas evitáveis, Belo Horizonte, 1984-1998. Rev Saúde Pública 2005; 39:67-74.
25. Goldani MZ, Barbieri MA, Bettiol H, Barbieri MR,
Tomkins A. Infant mortality rates according to socioeconomic status in a Brazilian city. Rev Saúde
Pública 2001; 35:256-61.
26. Holcman MM, Latorre MRDO, Santos JLF. Evolução
da mortalidade infantil na região metropolitana
de São Paulo, 1980-2000. Rev Saúde Pública 2004;
38:180-6.
27. Maranhão AGK, Joaquim MMC, Siu C. A mortalidade perinatal e neonatal. Brasília: Ministério da
Saúde/Fundo das Nações Unidas para a Infância;
1998.
28. Goldani MZ, Benatti R, Silva AAM, Bettiol H,
Correa JCW, Tietzmann M, et al. Narrowing inequalities in infant mortality in Southern Brazil.
Rev Saúde Pública 2002; 36:478-83.
29. Sena MCF. O aleitamento materno no Distrito Federal nos anos 90. Brasília: Fundação de Ensino e
Pesquisa em Ciências da Saúde, 2002.
Submitted on 27/Jun/2005
Final version resubmitted on 13/Jan/2006
Approved on 05/May/2006
Baixar