Sensors & Transducers, Vol. 185, Issue 2, February 2015, pp. 113-120 Sensors & Transducers © 2015 by IFSA Publishing, S. L. http://www.sensorsportal.com WiFi Data Acquisition System Applied to a Photovoltaic Powered Water Pumping Plant 1 Sandro César Silveira JUCÁ, 2 Renata Imaculada Soares PEREIRA, 2 Paulo Cesar Marques de CARVALHO 1 2 Maracanaú Campus - Federal Institute of Ceará (IFCE), 61.939-140, Brazil Electrical Engineering Department (DEE) - Federal University of Ceará (UFC), 60.455-760, Brazil 1 Tel.: +558538786321 1 E-mail: [email protected] Received: 14 November 2014 /Accepted: 15 January 2015 /Published: 28 February 2015 Abstract: The present paper describes how to design and assemble a low cost online monitoring and WiFi data acquisition system using free software applied to microgeneration based on renewable energy sources. The development of online monitoring systems for microgeneration plants based on renewable energy sources is becoming more important, considering that monitoring and data acquisition systems are applicable in stages of the microgeneration process. The monitoring and data acquisition WiFi system was developed using an embedded WiFi modem (Wifly) coupled to a microcontrolled board based on the free tool SanUSB. This monitoring system was applied to a photovoltaic (PV) water pumping plant without batteries, so as the control system and the wireless communication with the online server, which is also autonomous and powered by PV panel. The free software for online monitoring and WiFi data acquisition allows the analysis of stored data and charts through mobile devices as notebooks, tablets and smartphones. Copyright © 2015 IFSA Publishing, S. L. Keywords: WiFi monitoring, Data acquisition systems, Embedded systems, Microgeneration, Renewable energy sources. 1. Introduction Agency (ANEEL) resolution 482 [1], establishing general conditions for the connection of microgeneration plants (power up to 100 kW) in the Brazilian distribution grid, makes more relevant the development of online monitoring systems [2] applied to microgeneration plants based on renewable energy sources, like solar, wind, and biomass. Therefore, monitoring and data acquisition systems are applicable in various stages of the microgeneration process, for example, in the energy resource evaluation, generation failures prognosis, http://www.sensorsportal.com/HTML/DIGEST/P_2609.htm practical verification of project data and efficiency of generation. As a first positive reaction, in August 2013 started working in Rio de Janeiro a PV microgeneration plant connected to the grid, able to produce 50 % more than the total house electricity consumption [3]. Data acquisition and online monitoring systems are found in Brazil mainly at large power plants, with complex monitoring and relatively high costs, making impracticable the incorporation into domestic clients and in other clients that are inside the range of microgeneration power. In this way, the present article intends to develop efficient techniques for online monitoring with open source software, sensing 113 Sensors & Transducers, Vol. 185, Issue 2, February 2015, pp. 113-120 and WiFi data transmission to contribute with the diffusion and installation of microgeneration systems based on renewable energy sources. Until the 90 s, Internet was used as a file, news and electronic messages exchange tool, used by students in academy and universities [4]. After the 90 s, the World Wide Web started to draw the user attention, changing the way people interact with other people. The Web offers a colorful and easy way to navigate in graphic interface, with a content not limited to text and hypertext, also offering icons, lines, drawing, maps and pictures. Additionally, there are also hypermedia contents, hypertext pages with sound and video. The Web content can be visualized via a browser, which verifies the files and displays the contents stored on the server, as the open source software for online monitoring developed in the present research. This paper is organized as follows. Section II describes the hardware and software of the WiFi microcontrolled system, followed by the description of the WiFi communication protocol in Section III. Section IV provides information about the open source software and the principles of the WiFi acquisition system implemented to receive data from the photovoltaic (PV) microgeneration plant described in Section V, including sensing and conditioning. This section contains also charts obtained from the values of the microgeneration plant. Finally, conclusions are presented in Section VI. 2. WiFi Acquisition System This section describes the developed data acquisition board with WiFi connection, shown in Fig. 1. The WiFi embedded system programming is based on open source and free software, which is an advantage of the proposed system. The board sends monitored data to an online server also programmed in open source software. This modulated hardware consists of a microcontrolled board, called as SanUSB, connected to a WiFi modem via an adapter board that was developed for this application in order to adjust the pin connections, as well as to convert the voltage from 5 V to 3.3 V. Fig. 1. Acquisition data board and WiFi modem. 114 After coupling the embedded WiFi modem to the microcontroller pins (VCC, GND, Rx, and Tx), it is necessary to program the microcontroller with the firmware developed by Wifly configuration commands. In this way, support libraries were programmed to develop the firmware available as an Android application [5]. The users can also improve the open source firmware in order to adapt for a specific monitoring system. A wireless system using RF signal to power a temperature sensor for on-body temperature monitoring is shown in [6]. There are also other studies on remote wireless sensing, such as those developed by [7] and [8]. Wireless sensor nodes inside buildings are used to read out sensor data and to control actuators by a reference value in [9]. The nodes need to operate for a long time with a single battery. When using a standard WiFi connection, the node battery would be depleted after a few hours due to idle currents in receive state. The use of sensor nodes with included wake-up receivers can prolong the lifetime of the sensor network to several years, because the sensor measure data and send information only when a command is received from the Internet. The developed data acquisition board, based in a microcontroller USB programmable tool and using open source software, is patented by National Institute of Industrial Property (INPI) with register number 088503, executable in multiplatform like Linux, Mac OSX and Windows® and available in the files from the SanUSB group [10]. This tool is composed by a preprogrammed bootloader in the embedded system and a graphic interface used to program the microcontroller via USB. SanUSB tool allows a friendly interface and also debugs directly through the virtual serial emulation via USB. This step can be implemented in a fast and efficient way when the microcontroller is connected to a computer via USB. A developed equipment for specific applications tend to be cheaper, have better cost benefit relation and make possible an easy understanding and operation. With this same data acquisition board, a monitoring system was developed for implementation of a device for high temperature control applied to thermoelectric microgenerators [11]. Fig. 2 shows the program process using the designed embedded system. Fig. 2. Program process using the designed embedded system. Sensors & Transducers, Vol. 185, Issue 2, February 2015, pp. 113-120 Also using SanUSB tool, students were three times consecutively champions of IFCE Robotics Competition (2007, 2008 and 2009) in the Location category, champions of Brazilian Science and Engineering Fair (FEBRACE09) at Federal University of São Paulo (USP) in São Paulo in Engineering Category (2009), as well as the Innovation Award for Technology Application at the Feria Explora Medellin in Colombia in 2009, champions in the International Forum of Science and Engineering 2010 in Chile in the Supranivel Category, also in FEMECI IFCE 2010 in labyrinth robotics category, third position in technological innovation of the I Semantec 2011, champion of the Fifth SEDUC Ceará state fair of Culture and Science (2011) in educational robotics category and third in 2014 InfoBrasil Technological Congress [12]. The mentioned open source software is based on contributions of Internet developers throughout the world. This software offers a better performance, encourages creativity, allows dedicated applications and stimulates finding and correcting code errors faster than private software [13]. It is important to emphasize that USB ports are used as power source by the tool microcontroller only in the code development phase. The data acquisition system is autonomous; that means, a battery or a PV panel is used as an external power source. 3. WiFi Communication Protocol WiFi nets use radio wave technology with Institute of Electrical and Electronics Engineers (IEEE) standards, such as IEEE 802.11a, 802.11b, and 802.11g. These standards provide reliable and safe wireless connectivity. WiFi nets can be used for connection between computational devices and also to connect these devices to Internet [14]. WiFi net operates in the not licensed radio waves 2.4 GHz, in the IEEE 802.11b and IEEE 802.11g technologies and in the 5 GHz frequency of the 802.11a technology [15]. The WiFi modem (Fig. 3) is based in the RN-171 module to promote connection to the wireless networks. The connection of this modem needs only four pins designated to power and WiFi communication. This device has an independent antenna to increase its reach and offers stronger signal and support for the most common communication protocols like Transmission Control Protocol (TCP), User Datagram Protocol (UDP), and File Transfer Protocol (FTP). If more than one WiFi modem or computational device is connected on the Internet in a home network using a broadband router or a gateway, most of the time only this router will contain an Internet IP address and each device in the internal net utilizes an IP local address given by the router. Fig. 3. Online monitoring process via WiFi modem. The intranet IP local address is usually created dynamically via a service called Dynamic Host Configuration Protocol (DHCP) of the gateway, or defined in a static way by the user, according to the network. In the proposed case, the gateway is 192.168.1.1. Therefore, a fixed static IP address was defined for the WiFi embedded modem, i.e., 192.168.1.195. The proposed embedded system can be, with this firmware, server (e.g., switching a load through the instruction “192.168.1.195/YT” in address bar) or also client (e.g., a sensor value is posted to an online databank server). To access remotely the system via computer, it is necessary to enter the default static IP in the code, as previously mentioned, for example 192.168.1.195, 115 Sensors & Transducers, Vol. 185, Issue 2, February 2015, pp. 113-120 followed by a slash and one of the programmed commands into the microcontroller circuit (e.g., 192.168.1.195/YT), as seen in Fig. 4, along with the confirmation screen of data received from the online server. By accessing the "Logs" link, real time information monitoring of data sent, via WiFi every 10 seconds, is possible [16]. Fig. 4. Confirmation of data received by the online server. 4. Proposed Configuration of Online Monitoring In this item, the open source software and the principles of WiFi acquisition are described. In the present study, a PV powered pumping plant without batteries is used, in which the control and communication system with the online server is also autonomous and powered by a PV panel. In this case, information that is sent to the online data bank is configured with remote access over WiFi without charging, different from the applications that use General Packet Radio Service (GPRS) protocol. In this context, the development, programming and application of a WEB monitoring system and wireless data acquisition using open source software are described. The online data bank can be queried by any computational device connected to the Internet by using a personal password. The query can be made at any time, updated every minute. Fig. 5 shows the online monitoring development in two stages: • Sensing, conditioning and data transmission; • Data bank uploading from an online server and presentation to the user. Fig. 5. Steps of the open source software monitoring system. The first stage establishes communication between the sensors connected to the data acquisition board. The second stage, i.e., the user presentation layer, was developed in PHP with MySQL database. In this way, a free option for online monitoring applied to renewable energy sources is introduced. The first stage of sensing, conditioning, and wireless acquisition reads the data from the sensors every minute and saves the information in an internal Electrically-Erasable Programmable Read-Only Memory (EEPROM). Every ten minutes, the average value of the sensor measurement is calculated and sent to the stage two. It is important to mention that the actuators may be also connected to the board, allowing WiFi load control through the server. In the server, a communication interface to the acquisition system and another one working in parallel to the user communication were developed. The first interface is responsible for data receiving, to store them in the persistent database and to send a confirmation to the board. The user 116 interface delivers a friendly front-end that allows data visualization in the form of list or chart. The embedded firmware was programmed using a digital filter to identify and exclude abnormal values that differ by more than 100 % of the maximum and minimum values of the variable reference measured every minute. 5. Photovoltaic (PV) Microgeneration Plant The microgeneration plant used in the present study is installed at the laboratory of alternative energies (LEA), Federal University of Ceará (UFC) (Fig. 6 and Fig. 7). This plant consists of a water pumping system powered by PV panels, with a maximum power (Pmax) of 87 Wp, open circuit voltage of 21.7 V (Voc) and short-circuit current of 5.34 A (Isc). The motor-pump has a voltage of 12 Vdc, a maximal pressure of 20 psi and a pump flow of Sensors & Transducers, Vol. 185, Issue 2, February 2015, pp. 113-120 5.9 liters per minute (2,205 rpm) and a nominal current of 4.2 A. The developed online monitoring and wireless acquisition open source software was installed to record PV panels voltage and current, motor-pump pressure and flow, ambient temperature and solar irradiance. The electronic devices were located in plastic boxes in order to avoid the influence of thermal variation. For amplification of the signal from the current sensor of the PV panels, conditioning circuit for difference amplifying is used. This configuration responds to the difference between voltage signals applied to the input and ideally rejects signals that are common to both inputs. Regarding the PV panel voltage, it was necessary to deploy a board with conditioning circuit by voltage division to collect the data, because the signal exceeds the AD converter threshold voltage. In the case of voltage, the PV panel used provides maximum voltage of 19 V. 5.2. Open Source Software for Online Monitoring Fig. 6. PV panels installed at LEA – UFC. The Web Monitor is an application developed on online server with the PHP programming language, in conjunction with a structured database in Database Management System (DBMS), in order to serve as visualization of monitoring data (signals sensors) from renewable energy sources and to send them via a wireless communication (GPRS or WiFi). Fig. 8 shows the initial login screen of the data monitoring system. Fig. 8. Monitor WEB login screen. Fig. 7. Water pumping system. 5.1. Sensing, Conditioning and Data Acquisition To adapt the sensor signal to the analog-to-digital converter (AD) from the data acquisition system is used the principle of conditioning by voltage division, when the measured value is greater than the maximum voltage of the AD converter. There is also the principle of signal amplification with circuits that use instrumentation amplifiers to adjust the voltage or current of the sensor signal to the voltage full scale of the microcontroller AD converter. Furthermore, the instrumentation amplifiers are also used to read sensors, with minimal or virtually no signal interference due to the high impedance input amplifiers, functioning as a signal insulator, since the amplifier output voltage is supplied by the amplifier power and not by the input voltage. To access the monitoring system, it is necessary to enter the website link in PHP; after that, the system main authentication page appears, containing an authentication form (username and password). In this way, only pre-registered users can access the system. After entering the data access in the authentication step, the user is redirected to the system home page. Through the WEB monitor, the user can query the stored data in the online database via smartphones or PC whereas the Ethernet standard is the solution currently used in private systems to promote network interconnectivity; the cost of monitoring systems for microgeneration in wireless network with open source software tends to be dwindling. At the submenu Monitoramento (monitoring), there are two submenus: Gráfico (chart) and logs, as shown in Fig. 9. By clicking the submenu Gráfico a chart of the sensor values stored in the database is generated (Fig. 10), with voltage, current and electrical power data. 117 Sensors & Transducers, Vol. 185, Issue 2, February 2015, pp. 113-120 Fig. 9. Menu screen expanded. Fig. 10. PV voltage, current, and electric power. To generate the charts, a library called Highcharts, written in Java Script, was used. The chart automatically restarts every 30 seconds. To display the sensors values involved in the chosen application in a specific day, it is necessary to inform or to select a valid date and then click the magnifying glass icon. Shortly after, the chart will be updated showing for each point a representative value averaged over the sensor values every 10 minutes. In order to view the corresponding logs to the current values displayed in the chart, it is necessary to click the logs button. The system also provides the option to print or export (PNG, JPEG, PDF, and SVG) the entire structure of the chart view. The power is maintained around 70 W, for a voltage of 19.29 V and a current of 3.64 A. The flow sensor has a signal from 0 to 10 V for a range from 0 to 25 liters per minute. In order to perform the sensor reading, it is necessary that the variation is from 0 to 5 V, due to the full scale voltage of the microcontrolled data acquisition system. Thus, the l/min value for a voltage range from 0 to 5 V is 0 to 12.5 l/min (1 liter per minute corresponding to 0.06 m3 /h). In the present study, a pressure sensor PN20 (2005) was used (Fig. 11). 5.3. Charts of the Open Source Software for Online Monitoring In this topic, charts obtained from the open source software for online monitoring related to voltage, current and power will be presented. The PV panel voltage shape remains stable in sunny days, with a maximum of 19.3 V at noon and remaining around 19 V from 6 am to 5 pm. The PV current chart showed in Fig. 10 tends to follow the solar irradiance, reaching a maximum of 3.7 A at 12 pm, a peak of irradiance. The electrical power is obtained by multiplying the voltage and the current of the PV generator. 118 Fig. 11. Pressure sensor. Sensors & Transducers, Vol. 185, Issue 2, February 2015, pp. 113-120 Considering a 5 V maximum voltage of the analog-to-digital converter and a digital maximum value of 255, the sensor shows 70 psi. For a reading in kPa, the conversion factor from psi to kPa is 6.895; then the value of the actual pressure (PR) related to read digital value (Vd) is given by the following equation: 70 ⋅ Vd P = ⋅ 6,895 P = 1,893 ⋅ Vd R R 255 (1) Q × H product, measured in m4 /h is defined as the product of water flow (in cubic meters per hour) and pressure (in meters of water column); this product multiplied by constants indicate the hydraulic power in different units. Pressure, flow, and Q × H product of a monitoring day are shown in Fig. 12 [17]. In Fig. 12, the pumping system begins operation with a mean value of 0.5 m3 /h at 6 am and reduces the flow at 3 pm. This water flow reduction is due to the decrease in solar irradiance. As expected, the solar irradiance in Fortaleza (near the Equator line) increases from 6 am gradually to a maximum at noon and decreases up to 5 pm, when there is little irradiance on the PV panel. The local temperature presents the maximum value a few hours after the highest rates of radiation, due to accumulation of heat in the room. The ambient temperature at the PV plant, in a specific day, varied from 28 ºC to a maximum of 35 ºC at 5:30 pm, shown in Fig. 13. Fig. 12. Pressure, flow, and Q x H product. Fig. 13. Temperature and solar irradiance. 6. Conclusions As financial resources in developing countries are generally limited, solutions dedicated to monitoring and identification of local energy resources and for real-time monitoring of decentralized plants using renewable energy sources can contribute to a policy of decentralization of electric power generation in these countries. The present paper proposed a wireless data acquisition system, online monitoring applied to decentralized microgeneration of electrical power from renewable energy sources. With the advent of ANEEL normative resolution No. 482 introducing general conditions for electrical 119 Sensors & Transducers, Vol. 185, Issue 2, February 2015, pp. 113-120 microgeneration connected to the grid using units up to 100 kW, it becomes more important to develop online systems for monitoring processes of microgeneration based on renewable energy sources, such as solar, wind, and biomass. The monitoring and data acquisition system proposed was developed in open source software and multiplatform (Linux, Windows®, and Mac OSX) in order to facilitate the dissemination of the computational tool developed for different user profiles. The open source monitoring software proposed enables monitoring the microgeneration plant via smartphones, tablets or other mobile devices with Internet access. As a case study for the monitoring system, a water pumping plant powered by PV panels was used. The online database can be queried by any computing device connected to the Internet via password. Queries can be made at any time by updating the database every 10 minutes, which is usually the maximal time step for data acquisition systems of renewable energy plants. The WEB monitoring and designed data acquisition system of the microgeneration plant was efficient because of the online query possibility and real-time operation of the electrical microgeneration plant, showing a behavior according to the project. The use of tools based on open source software for online monitoring applied to microgeneration systems allows greater accessibility to general users. The online monitoring and data acquisition model proposed can be expanded to record data from other types of analog or digital sensors, as well as other types of microgeneration plants using renewable energy sources. Acknowledgements The authors would like to thank CNPq and Vale for the financial support through the FormaEngenharia program, CAPES and Deutscher Akademischer Austauschdienst (DAAD) for research grants awarded, and UFC and IFCE for the availability of laboratories and equipment. References [1]. ANEEL, Resolution No. 482 (http://www.aneel.gov.br/cedoc/ren2012482.pdf/). [2]. D. G. Costa, L. A. Guedes, F. Vasques, P. Portugal, Partial Energy-Efficient Hop-by-Hop Retransmission in Wireless Sensor Networks, in Proceedings of the International Conference on Industrial Informatics (INDIN’13), Bochum, Germany, 29-31 July 2013, pp. 146-151. [3]. Energy Journal, Light interconnects first microgeneration system (http://jornaldaenergia .com.br/lernoticia.php?idnoticia=14464&id_secao=8). [4]. F. J. Kurose, K. W. Ross, Computer networks and Internet: a new approach, Addison Wesley, 2003. [5]. SanUSB IP access Wifly (https://play.google.com/store/apps/details?id=appinve ntor.ai_sandro_juca.Wifi_SanUSB). [6]. G. C. Martins, F. R. de Sousa, An RF-Powered Temperature Sensor Designed for Biomedical Applications, in Proceedings of the 26th Symposium on Integrated Circuits and Systems Design (SBCCI’13), Curitiba, Brazil, 2-6 September 2013, pp. 1-6. [7]. M. S. Durante, S. Mahlknecht, An Ultra Low Power Wakeup Receiver for Wireless Sensor Nodes, in Proceedings of the Third International Conference on Sensor Technologies and Applications (SENSORCOMM’09), Barcelona, Spain, 25-31 August 2013, pp. 167-170. [8]. H. Raisigel, G. Chabanis, I. Ressejac, M. Trouillon, Autonomous Wireless Sensor Node for Building Climate Conditioning Application, in Proceedings of the 4th International Conference on Sensor Technologies and Applications (SENSORCOMM’10), Venice/Mestre, Italy, 18-25 July 2010, pp. 68-73. [9]. G. U. Gamm, S. Sester, L. M. Reindl, SmartGate– connecting wireless sensor nodes to the Internet, Vol. 2, 2013, pp. 45-50. [10]. SanUSB tool (http://tinyurl.com/SanUSB). [11]. S. C. S. Jucá, P. C. M. Carvalho, R. I. S. Pereira, D. Petrov, U. Hilleringmann, Design and Implementation of a High Temperature Control Monitoring Applied to Micro Thermoelectric Generators, in Proceedings of International Conference on Renewable Energies and Power Quality (ICREPQ’13), Bilbao, Spain, No. 425, 20-22 March 2013. [12]. VII Technological Infobrasil Congress Classification 2014 (http://www.infobrasil.inf.br/pagina/programa cao-apresentacao-de-artigos). [13]. J. W. Paulson, G. Succi, A. Eberlein, An empirical study of open-source and closed-source software products, in Proceedings of the IEEE Transactions on Software Engineering (TSE’04), Edinburgh, UK, 25 May 2004, pp. 246-256. [14]. G. S. V. Radha, K. Rao, G. Radhamani, WiMAX: A Wireless Technology Revolution, Auerbach Publications, 2007. [15]. Official IEEE 802.11 working group timelines (http://www.ieee802.org/11). [16]. Wireless data acquisition systems development (http://www.lcm.com.br/site/livros/detalhesLivro/f/de senvolvimento-de-sistemas-de-aquisicao-de-dadossem-fio.html). [17]. S. C. S. Jucá, P. C. M. Carvalho, R. I. S. Pereira, WiFi Monitoring Embedded System for Electrical Microgeneration using Renewable Energy Sources, in Proceedings of the 8th International Conference on Sensor Technologies and Applications (SENSORCOMM’14), Lisbon, Portugal, 16-20 November 2014, pp. 21-26. ___________________ 2015 Copyright ©, International Frequency Sensor Association (IFSA) Publishing, S. L. All rights reserved. (http://www.sensorsportal.com) 120
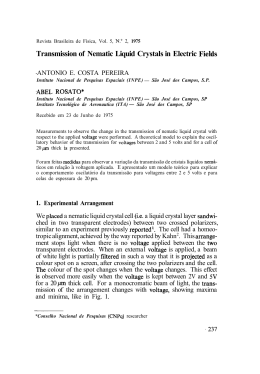
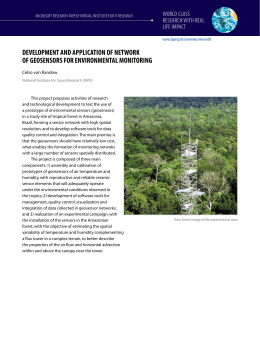
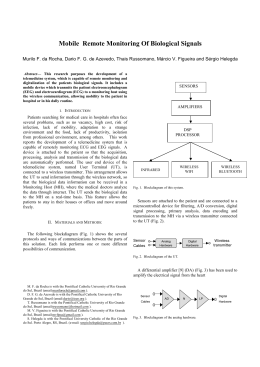
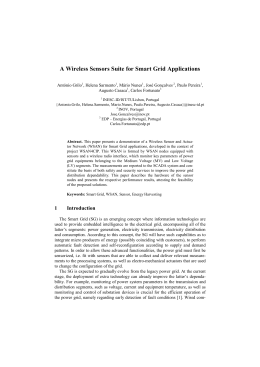
Baixar