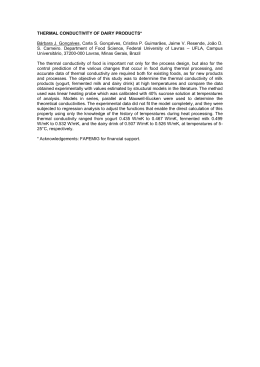
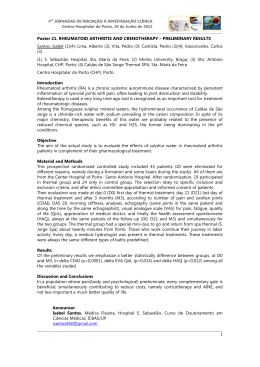
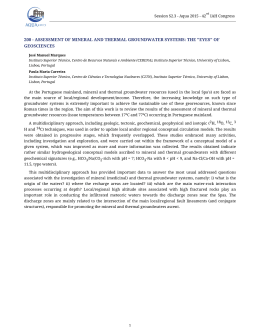
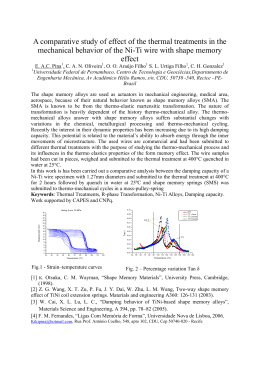
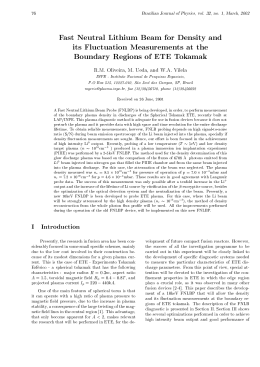
REVIEW OF SCIENTIFIC INSTRUMENTS VOLUME 74, NUMBER 1 JANUARY 2003 Thermal lens temperature scanning for quantitative measurements in transparent materials „invited… J. H. Rohling, J. R. D. Pereira, A. N. Medina, A. C. Bento, and M. L. Baessoa) Departamento de Fı́sica, Universidade Estadual de Maringá, Av. Colombo, 5790, 87020-900, Maringá, PR, Brazil J. A. Sampaio, S. M. Lima, and T. Catunda Instituto de Fı́sica de São Carlos, Grupo de Espectroscopia de Sólidos, Universidade de São Paulo, Av. Dr. Carlos Botelho, 1465, 13560-250, São Carlos, SP, Brazil L. C. M. Miranda Instituto Nacional de Pesquisas Espaciais, 12201-970, São José dos Campos, SP, Brazil 共Presented on 24 June 2002兲 In this work the ability of thermal lens spectrometry for different temperature studies in transparent materials is discussed. The method was applied in polymers and optical glasses to measure the thermo-optical properties as a function of the temperature. The focus of the discussion will be on the temperature range where the glass transition occurs. The perspectives of future studies in this area will be discussed. © 2003 American Institute of Physics. 关DOI: 10.1063/1.1517157兴 I. INTRODUCTION On the other hand, the ultimate goal in the study of the thermal and optical properties as a function of the temperature is the determination of the role played by these parameters in the material phase transitions. It is well known that thermal conductivity 共K兲, thermal diffusivity 共D兲, and the coefficient of temperature of the refractive index (dn/dT) present strong variations in their values when the temperature of the sample is close to the region where the phase transition is expected to occur. It is recognized that the precise determination of phase transition temperature is still an experimental challenge that needs to be accomplished. Conventional calorimetric methods demand the use of a reference sample and therefore a temperature lag between the tested sample and the reference may take place. This does not allow locating the phase transition temperature. In this work an overview of the recent developments in the application of the TL method to measure the quantitative values of the thermal and optical properties of transparent materials as a function of temperature will be presented. The TL experimental data obtained in polyvinyl chloride 共PVC兲 in the temperature range from 22 to 70 °C, in polycarbonate from 22 to 170 °C and in fluoride glasses from 22 to 300 °C will be shown. These temperature ranges include the glass transitions region of these materials. It is discussed how the experimentally determined TL parameters can be used to locate the glass transitions in these materials. In addition, a The accidental observation of the thermal lens effect in the early 1960’s resulted in the development of the technique called thermal lens spectrometry 共TLS兲.1–15 The TL effect is created when a Gaussian laser beam passes through an absorbing medium and part of the absorbed energy is converted into heat. As a consequence, the refractive index of the illuminated area is changed, producing a radial profile in the sample equivalent to that of the beam intensity. This is the so-called thermal lens effect. The propagation of a probe laser beam through the TL will be affected and a phase shift in its wavefront will be induced. The thermo-optical properties of the sample can be determined by measuring this induced phase shift.4 –30 Since the first observation, the TL experimental configuration and theoretical models have been improved in order to provide both higher sensitivity and the possibility of performing quantitative measurements of the investigated samples.4,5,10,22 As a result, the TL method is now employed as a sensitive analytical tool to determine the thermo-optical properties of transparent materials. However, despite the wide range of applications of this technique, so far the measurements have been carried out mostly near room temperature. Since the TL technique is an intrinsically remote method the measurements on a sample placed inside a harsh environment present, in principle, no additional difficulty. As illustrated in Fig. 1, the experimental arrangement can be set in such a way that a space of about 0.5 m between the two lenses can be used to introduce a thermal heating device to control the sample temperature. Using this procedure we recently introduced the TL technique for quantitative measurements as a function of temperature. The experiments have been performed to study optical glasses,9,13,23 polymers,24 –27 and liquid crystals.28 –30 a兲 FIG. 1. Probe and excitation beams in the mode mismatched TL configuration. Author to whom correspondence should be addressed; electronic mail: [email protected] 0034-6748/2003/74(1)/291/6/$20.00 291 © 2003 American Institute of Physics Downloaded 21 Jan 2003 to 143.107.228.221. Redistribution subject to AIP license or copyright, see http://ojps.aip.org/rsio/rsicr.jsp 292 Rohling et al. Rev. Sci. Instrum., Vol. 74, No. 1, January 2003 e is the excitation beam waist at the sample position. The solution of the heat conduction equation depends on the employed boundary conditions. Shen et al.4,5 developed the infinitive aberrant model for the mode-mismatched configuration. Using the conditions ⌬T(r,0)⫽0,(r⬍⬁) and ⌬T(⬁,t)⫽0(t⬎0), the temporal evolution of the temperature profile ⌬T(r,t) induced by the TL in the sample is given by4,5 ⌬T 共 r,t 兲 ⫽ 冕冋 2 P eA e t 1 2 e 0 1⫹ 共 2t ⬘ /t c 兲 c 冋 ⫻exp ⫺2r 2 / 2e 1⫹ 共 2t ⬘ /t c 兲 册 册 dt ⬘ , 共1兲 in which is the density, c the specific heat, A e the optical absorption coefficient at the excitation beam wavelength, and t c the characteristic TL time constant, defined as FIG. 2. TL experimental setup. t c⫽ comparison with conventional calorimetric methods is made. Finally, it is proposed that the current thermal lens technique can be adopted as a new tool, called differential thermal lens temperature scanning, especially designed for the investigation of the phase transitions in transparent materials. The perspectives of future studies in this area will be discussed. II. EXPERIMENT The employed TL experimental setup is shown in Fig. 2. The two laser beam mode mismatched TL configuration was used with the excitation beam at 514.5 nm and a probe beam at 632.8 nm. The mode-mismatched configuration has been shown to be the most sensitive experimental setup for the TL measurements. This arrangement uses two laser beams with different spot sizes at the sample position. TL measurements can be performed for both time-resolved and steady state mode. The time-resolved method permits the measurement of the development of the thermal lens in a short period of time, and the advantage of this procedure when compared with steady state mode is that it allows to measure the sample thermal diffusivity.4,6,10,17 The experiment is performed in the following way: first, the probe beam is aligned, using mirror 5, in order to have its center passing through the pinhole positioned in front of the detector; after using mirror 2 the excitation beam is used to induce the thermal lens in the central part of the probe beam and a consequent change in its intensity in the detector, photodiode 2. This signal variation is recorded by the oscilloscope and the data thus obtained are transferred to a microcomputer for subsequent analysis. The theoretical treatment of the thermal lens effect takes into account the spherical aberration of the thermal lens and also considers the whole optical path length change with temperature.10 The first step in the development of the model is to consider the heat source profile, Q(r), induced by the laser beam. Q(r) is proportional to the Gaussian intensity profile, which can be expressed as: I e (r)⫽(2 P e / 2e ) exp(⫺2r2/2e ), in which P e is the excitation beam power and 2e 4D with D⫽ K , c 共2兲 where D is the thermal diffusivity and K is the thermal conductivity. This temperature rise, which carries a Gaussian profile, induces a slight distortion in the probe beam wavefront that can be associated with the change in the optical path length of the sample with respect to the axis of the beam, as follows:10 冉 冊 ⌽ p ds ⫽l 0 2 dT 关 ⌬T 共 r,t 兲 ⫺⌬T 共 0,t 兲兴 共3兲 p in which ⌽ is the phase shift induced when the probe beam passes through the TL, p is the probe beam wavelength, l 0 is the sample thickness, and (ds/dT) p is the temperature dependence of the optical path length of the sample. Finally, using the Fresnel diffraction theory, the probe beam intensity at the detector plane can be written as an analytical expression for absolute determination of the thermo-optical properties of the sample, as4,5 冋 I 共 t 兲 ⫽I 共 0 兲 1⫺ tan⫺1 2 ⫻ 冉 2mV 关共 1⫹2m 兲 2 ⫹V 2 兴共 t c /2t 兲 ⫹1⫹2m⫹V 2 冊册 2 , 共4兲 in which ⫽⫺ 冉 冊 P e A e l 0 ds K p dT ; p V⫽ Z1 ; Zc m⫽ 冉 冊 p e 2 . 共5兲 In Eq. 共4兲 I(t) is the temporal dependence of the probe laser beam intensity at the detector, I(0) is the initial value of I(t), is the thermally induced phase shift of the probe beam after its passing through the sample, p is the probe beam spot size at the sample, Z c is the confocal distance of the probe beam, Z 1 is the distance from the probe beam waist to the sample. We should mention that the parameter ds/dT describes the whole optical path length change induced by Downloaded 21 Jan 2003 to 143.107.228.221. Redistribution subject to AIP license or copyright, see http://ojps.aip.org/rsio/rsicr.jsp Rev. Sci. Instrum., Vol. 74, No. 1, January 2003 the excitation beam, which means that for solid material it depends on several mechanisms such as the sample bulging during the illumination and also on the stress-optical coefficient. In the case of liquid samples we have ds/dT ⫽dn/dT. Therefore, using least-square curve fitting of Eq. 共4兲 to the TL transient experimental data, and t c can be obtained. The poly共vinyl chloride兲 共PVC兲 film used was a 200 m thick with 12 mm diameter disk. The polycarbonate sample consisted of a 1.4 mm thick, 12 mm diameter disk of polysafe poly共carbonate兲 manufactured by Wilson Safety Products Co. The fluoride glass compositions were fluoroindates 共PGIZCa, ISZn, InSBZnGdN兲 and fluorozirconates 共ZBLAN兲.23 The starting materials used for the preparation of the glasses were fluorides 共BDH and Strem products兲 and oxides In2 O3 , ZnO, Ga2 O3 共MetalEurop兲. The ammonium bifluoride was used to transform oxides into fluorides. The mixtures were heated in a platinum crucible for melting and refining. Finally, the liquid was poured into a brass mold at temperatures few degrees smaller than T g to prepare samples 4 mm thick. All these operations were performed in a glove box with inert atmosphere whose moisture was kept below 10 ppm. These glasses have low optical absorption coefficients, ⬍10⫺3 cm⫺1 , and phonon energies of the order of 500 cm⫺1 . These characteristics make the TL signal of these systems difficult to detect. To overcome this problem the samples were doped with a small amount of CoF2 which induces optical absorption bands in the samples, one of them centered at about 540 nm. The CoF2 doping concentrations were: 0.392 mol % for ISZn, 0.20 mol % for PGIZCa, 0.29 mol % for InSBZnGdN, and 0.155 mol % for the ZBLAN. In order to validate and evaluate the sensitivity of the TL method we carried out complementary measurements of differential scanning calorimetry 共DSC兲 for polymer samples and differential thermal analysis 共DTA兲 for the optical glasses. III. RESULTS AND DISCUSSION A. Thermal lens for glass transition analysis of polymers Figure 3 shows the resulting temperature dependence obtained for the thermal diffusivity and the normalized thermal lens signal, , for the PVC sample. To better understand the temperature dependence of both D and / P, we have also carried out DSC measurements. In Fig. 4共a兲 we present a typical DSC curve for our PVC sample. This result indicates that the glass transition region extends from 50 to about 67 °C with a peak at 62.5 °C. In Fig. 3 we observe that both D and show a marked change in their temperature dependence in this glass transition region. Between 50 to about 67 °C, D decreases by a factor of about 2 while / P experiences an increase of the order of 3.5. The somewhat complex temperature dependence of may be better understood by looking at the temperature derivative of the solid line of curve b in Fig. 3, shown in Fig. 4共b兲. It shows us that, on increasing the temperature, (1/ ) ⫻(d /dT) increases, reaching a peak around 55 °C, then decreases very sharply to a minimum at roughly 61 °C, to Photoacoustic and photothermal phenomena 293 FIG. 3. Temperature dependence of the thermal diffusivity and / P for PVC. finally reach a maximum at 64 °C as shown in the upper curve. The comparison between the two plots in Fig. 4 is such that the first peak in curve 共b兲, which occurs at 55.2 °C corresponds to the beginning of the glass transition as determined by the DSC curve, whereas the minimum between the two peaks of curve 共b兲 corresponds to the inflection point of the DSC curve before reaching its minimum at 62.5 °C. We adopted this minimum point as the glass transition temperature. This result is indeed not as surprising as it may look at a first glance. In a DSC experiment one has a reference material, the sample to be probed, and a predetermined heating 共or cooling兲 rate is imposed to the system for undergoing a given temperature excursion. A servosystem makes the sample to follow the temperature of the reference and the heating power difference between the sample and the reference is recorded. That is, since dT/dt is fixed, one records essentially dQ/dT. Figure 5 shows the resulting temperature dependence obtained for the thermal diffusivity and the TL signal parameter, / P, for the polycarbonate sample. The DSC data are shown in curve 共c兲. As performed for the PVC sample, in Fig. 6 we present the temperature derivative of / P. For comparison, a plot of the temperature derivative of the DSC data is also presented in Fig. 6, curve 共b兲. The existence of two minima in the DSC temperature derivative data seems to reflect the fact that the polycarbonate sample has two dominant phases. One phase corresponding to a glass transition temperature of about 146 °C and another one with T g of FIG. 4. Temperature derivative of / P and DSC for PVC. Downloaded 21 Jan 2003 to 143.107.228.221. Redistribution subject to AIP license or copyright, see http://ojps.aip.org/rsio/rsicr.jsp 294 Rev. Sci. Instrum., Vol. 74, No. 1, January 2003 Rohling et al. FIG. 5. Temperature dependence of the thermal diffusivity and / P for polycarbonate. about 148 °C. These two phases correspond to pure polycarbonate and to a PCA/ABS 共acrylonitrile–butadiene–styrene兲 blend. This ABS blend is used to improve the mechanical shock resistance of the polycarbonate used as safety eyeglasses. In the temperature derivative of / P 关Fig. 6共a兲兴 in the range between 140 and 160 °C the peaks exhibit a distinct correlation with those of the temperature derivative of DSC 关Fig. 6共b兲兴. The maxima occur at 144.8 and 150 °C, corresponding to the minima of the DSC temperature derivative. That is, the temperature dependence of / P apparently has more information than that contained in the DSC curve. The similarity between the behavior of (1/ )(d /dT) and the DSC curve showed for both, PVC and polycarbonate, suggest that the TL technique can be used to perform an equivalent differential scanning technique, namely, a differential thermal lens scanning, in which we set a given heating rate and measure the rate of change of the TL signal. The resulting signal of this technique would be d /dt FIG. 6. Temperature derivative of / P and DSC for polycarbonate. FIG. 7. Temperature dependence of the normalized TL phase shift for: 共a兲 InSBZnGdN, 共b兲 ISZN, 共c兲 PGIZCa, 共d兲 ZBLAN glasses. ⫽(d/dT)(dT/dt), that is proportional to d /dT, and can provide information regarding the onset of the glass transition. B. Thermal lens for glass transition analysis of optical glasses Figure 7 shows the normalized TL phase shift 共兲 as a function of temperature for the four different glasses studied in this work, while Fig. 8 shows the temperature dependence of their thermal diffusivities. The error for / P values is of the order of 2%, while for D it is about 5%. From Eq. 共5兲 we note that / P depends on several parameters, such as K, A e , l 0 , and ds/dT. Therefore, we adopted the room temperature / P as the reference datum for normalization. In this way the data for different glasses can be compared in terms of the temperature dependence of the TL signal amplitude. Similarly, to the observations for polymers, Figs. 7 and 8 show variations in / P and D values when the temperature excursion passed through the regions where the glass transitions of the samples were expected to occur. Following the same procedure described above for polymers, to further explore the TL results the first derivative of the resulting temperature dependence of the TL signal parameter, / P, was performed. The resulting curves are shown in Figs. 9–12. For a better view, we show only the temperature range between 220 and 300 °C, close to the temperature at which T g occurs. For comparison the DTA curve of each glass is also shown in the respective (1/ )(d /dT) figures. An additional point to be observed in the TL and DTA data is that T g shifted when the different glasses are compared. For example, T g changed from about 253 °C for the ZBLAN glass to ⬃290 °C for the InSBZnGdN glass. Again, similar to the previously described procedure employed for polymers, in Figs. 9–12 the temperature deriva- Downloaded 21 Jan 2003 to 143.107.228.221. Redistribution subject to AIP license or copyright, see http://ojps.aip.org/rsio/rsicr.jsp Rev. Sci. Instrum., Vol. 74, No. 1, January 2003 Photoacoustic and photothermal phenomena 295 FIG. 10. Temperature derivative of the thermal lens signal 共a兲 and the DTA data 共b兲 for the ISZN glass. FIG. 8. Temperature dependence of the thermal diffusivity for: 共a兲 InSBZnGdN, 共b兲 ISZN, 共c兲 PGIZCa, 共d兲 ZBLAN glasses. tive of / P was used to attempt to locate the glass transition temperature. These plots show quite well the glass transitions. We suggest therefore that the TL technique can also be used to perform measurement equivalent to DTA. One of the advantages of the TL method is that this technique does not require a reference sample for the experiments. This prevents the occurrence of the temperature lag between the sample and the reference, especially in the region of T g , which occurs with the conventional calorimetric measurements. Here, again, as shown for polymers samples, our results for optical glasses show that by setting a given heating rate and measuring the rate of change of the TL signal, a differential scanning can be obtained. The resulting signal of this scanning technique would be d /dt⫽(d /dT)(dT/dt), that is proportional to d /dT, and can provide information regarding the onset of the glass transition. As is well known from the literature, one of the procedures usually used to locate the glass transition is to assume T g as the crossing point of the FIG. 9. Temperature derivative of the thermal lens signal 共a兲 and the DTA data 共b兲 for the InSBZnGdN glass. two straight lines, as shown in the DTA data presented in the figures above. This is an empirical way of identifying the transition which has subjective errors. From the TL data we observed that: (1/ )(d /dT) initially increases with increasing temperatures, goes through a maximum, then decreases to a minimum, followed by a new maximum and a subsequent decrease. The minimum between the two maxima indicated in the curves 共a兲 of Figs. 9–12 could be assumed to be the T g region, since it is the point at which / P in Fig. 7 has a smaller rate of variation as compared to the temperatures below and above this region. This could be a more precise way to determine the glass transition as compared to the usual procedure adopted in conventional calorimetric measurements. The estimated error of our TL T g data is of the order of 2 °C. A further reduction of the error may be possible, since the temperature fluctuation induced by the laser beam necessary to obtain the TL signal is of the order of mK. This indicates therefore that accurate measurements very close to the glass transition can be obtained by this sensitive technique by reducing the temperature intervals between the data points. IV. CONCLUSIONS AND PERSPECTIVES FOR FUTURE WORK In conclusion, in this article we discuss the use of thermal lens technique to determine the thermo-optical proper- FIG. 11. Temperature derivative of the thermal lens signal 共a兲 and the DTA data 共b兲 for the PGIZCa glass. Downloaded 21 Jan 2003 to 143.107.228.221. Redistribution subject to AIP license or copyright, see http://ojps.aip.org/rsio/rsicr.jsp 296 Rohling et al. Rev. Sci. Instrum., Vol. 74, No. 1, January 2003 6 FIG. 12. Temperature derivative of the thermal lens signal 共a兲 and the DTA data 共b兲 for the ZBLAN glass. ties of transparent materials as a function of the temperature. It is also discussed how the experimentally determined TL parameters can be used to locate the glass transition of these materials. The results showed the ability of the thermal lens technique to perform the measurements very close to the phase transition. As compared to the conventional calorimetric methods we should emphasize that this technique does not require the use of a reference sample. As a future work, we propose that the technique could be adapted to a compact device, called differential thermal lens scanning, especially designed for the investigation of the phase transition in transparent materials. ACKNOWLEDGMENTS The authors are thankful to the Brazilian Agencies, CNPq, CAPES, and Fundaç:o Araucária for the financial support of this work. 1 J. P. Gordon, R. C. C. Leite, R. S. More, S. P. S. Porto, and J. R. Whinnery, Bull. Am. Phys. Soc. 9, 501 共1964兲. 2 J. P. Gordon, R. C. C. Leite, R. S. More, S. P. S. Porto, and J. R. Whinnery, Appl. Phys. Lett. 5, 141 共1964兲. 3 J. P. Gordon, R. C. C. Leite, R. S. More, S. P. S. Porto, and J. R. Whinnery, J. Appl. Phys. 36, 3 共1965兲. 4 J. Shen, Ph.D. thesis, UMIST, Manchester, 1993. 5 J. Shen, R. D. Lowe, and R. D. Snook, Chem. Phys. 165, 385 共1992兲. M. L. Baesso, J. Shen, and R. D. Snook, Chem. Phys. Lett. 197, 255 共1992兲. 7 M. L. Baesso, A. C. Bento, A. A. Andrade, T. Catunda, J. A. Sampaio, and S. Gama, J. Non-Cryst. Solids 219, 165 共1997兲. 8 S. E. Bialkowsk, Photothermal Spectroscopy Methods for Chemical Analysis 共Wiley, New York, 1996兲. 9 S. M. Lima, J. A. Sampaio, T. Catunda, A. C. Bento, L. C. M. Miranda, and M. L. Baesso, J. Non-Cryst. Solids 273, 215 共2000兲. 10 M. L. Baesso, J. Shen, and R. D. Snook, J. Appl. Phys. 75, 3732 共1994兲. 11 S. Shen, M. L. Baesso, and R. D. Snook, J. Appl. Phys. 75, 3738 共1994兲. 12 M. L. Baesso, A. C. Bento, A. A. Andrade, T. Catunda, E. Pecoraro, L. A. O. Nunes, J. A. Sampaio, and S. Gama, Phys. Rev. B 57, 10 545 共1998兲. 13 S. M. Lima, T. Catunda, R. Lebullenger, A. C. Hernandes, M. L. Baesso, A. C. Bento, and L. C. M. Miranda, Phys. Rev. B 60, 15 173 共1999兲. 14 S. M. Lima, A. A. Andrade, R. Lebullenger, A. C. Hernandes, T. Catunda, and M. L. Baesso, Appl. Phys. Lett. 78, 3220 共2001兲. 15 M. L. Baesso, A. S. Fontes, A. C. Bento, and L. C. M. Miranda, Anal. Sci. 17, S103 共2001兲. 16 M. L. Baesso, A. C. Bento, A. A. Andrade, T. Catunda, J. A. Sampaio, and S. Gama, J. Non-Cryst. Solids 219, 165 共1997兲. 17 M. L. Baesso, A. C. Bento, A. R. Duarte, A. M. Neto, and L. C. M. Miranda, J. Appl. Phys. 85, 8112 共1999兲. 18 S. M. Lima, J. A. Sampaio, T. Catunda, R. Lebullenger, A. C. Hernandes, M. L. Baesso, A. C. Bento, and F. C. G. Gandra, J. Non-Cryst. Solids 256 & 257, 337 共1999兲. 19 J. A. Sampaio, T. Catunda, S. Gama, and M. L. Baesso, J. Non-Cryst. Solids 284, 210 共2001兲. 20 J. A. Sampaio, T. Catunda, F. C. G. Gandra, S. Gama, A. C. Bento, L. C. M. Miranda, and M. L. Baesso, J. Non-Cryst. Solids 247, 196 共1999兲. 21 E. Peliçon, J. H. Rohling, A. N. Medina, A. C. Bento, M. L. Baesso, D. F. de Souza, S. L. Oliveira, J. A. Sampaio, S. M. Lima, L. A. O. Nunes, and T. Catinda, J. Non-Cryst. Solids 304, 244 共2002兲. 22 S. J. Sheldon, L. V. Knight, and J. M. Thorne, Appl. Opt. 21, 1663 共1982兲. 23 J. A. Sampaio, S. M. Lima, T. Catunda, A. N. Medina, A. C. Bento, and M. L. Baesso, J. Non-Cryst. Solids 304, 315 共2002兲. 24 J. H. Rohling, A. N. Medina, A. C. Bento, J. R. D. Pereira, M. L. Baesso, and L. C. M. Miranda, J. Phys. D 34, 407 共2001兲. 25 J. H. Rohling, A. M. F. Caldeira, J. R. D. Pereira, A. N. Medina, A. C. Bento, M. L. Baesso, and L. C. M. Miranda, J. Appl. Phys. 89, 2220 共2001兲. 26 J. H. Rohling, A. N. Medina, J. R. D. Pereira, A. F. Rubira, A. C. Bento, L. C. M. Miranda, and M. L. Baesso, Anal. Sci. 17, S103 共2001兲. 27 J. H. Rohling, J. Mura, A. N. Medina, A. J. Palangana, A. C. Bento, J. R. D. Pereira, M. L. Baesso, and L. C. M. Miranda, Braz. J. Phys. 32, 575 共2002兲. 28 J. R. D. Pereira, A. J. Palangana, A. M. Mansanares, E. C. da Silva, A. C. Bento, and M. L. Baesso, Phys. Rev. E 61, 5410 共2000兲. 29 J. R. D. Pereira, A. J. Palangana, A. M. Mansanares, and M. L. Baesso, Phys. Rev. E 64, 701 共2001兲. 30 J. R. D. Pereira, A. J. Palangana, A. M. Mansanares, E. C. da Silva, A. C. Bento, and M. L. Baesso, Anal. Sci. 17, 175 共2001兲. Downloaded 21 Jan 2003 to 143.107.228.221. Redistribution subject to AIP license or copyright, see http://ojps.aip.org/rsio/rsicr.jsp
Baixar