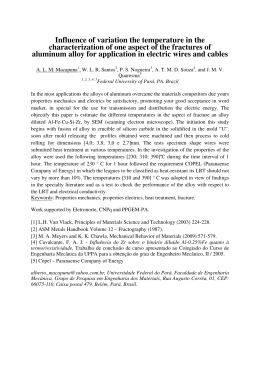
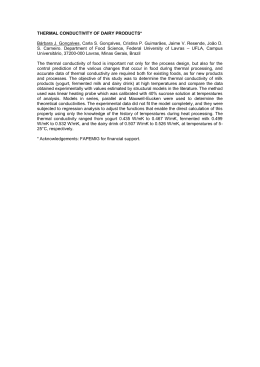
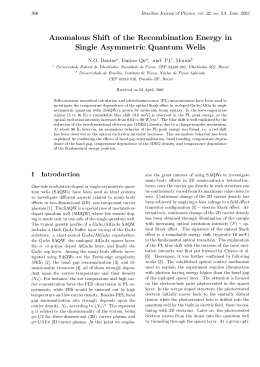
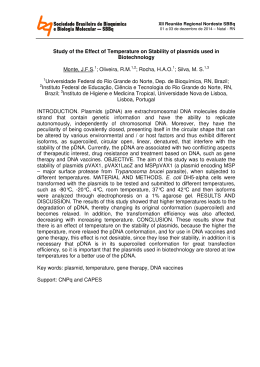
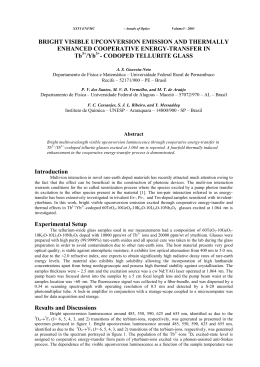
Brazilian Journal of Physics, vol. 40, no. 1, March, 2010 15 Comparison of some theoretical models for fittings of the temperature dependence of the fundamental energy gap in GaAs R. R. O. Morais,∗ I. F. L. Dias, J. L. Duarte, and E. Laureto Departamento de Fı́sica, Universidade Estadual de Londrina – UEL, CP6001, CEP 86051-970, Londrina, Paraná-Brazil S. A. Lourenço Instituto de Fı́sica, Universidade Federal de Uberlândia, CP593, CEP 38400-902, Uberlândia, MG, Brazil E. C. F. da Silva and A. A. Quivy Instituto de Fı́sica, Universidade de São Paulo – IFUSP, CP66318, CEP 05315-970, São Paulo, São Paulo, Brazil (Received on 24 November, 2008) In this work we report on a comparison of some theoretical models usually used to fit the dependence on temperature of the fundamental energy gap of semiconductor materials. We used in our investigations the theoretical models of Viña, Pässler-p and Pässler-ρ to fit several sets of experimental data, available in the literature for the energy gap of GaAs in the temperature range from 12 to 974 K. Performing several fittings for different values of the upper limit of the analyzed temperature range (T max ), we were able to follow in a systematic way the evolution of the fitting parameters up to the limit of high temperatures and make a comparison between the zero-point values obtained from the different models by extrapolating the linear dependence of the gaps at high T to T = 0 K and that determined by the dependence of the gap on isotope mass. Using experimental data measured by absorption spectroscopy, we observed the non-linear behavior of Eg (T) of GaAs for T > ΘD . Keywords: Non-linear behavior of Eg (T); Zero-point energy; Temperature dependence of the gap; Gallium arsenide I. INTRODUCTION The dependence on temperature of the energy gap, Eg (T), is a very important characteristic of semiconductor materials and heterostructures and of great scientific and technological interest. For a large number of semiconductor materials, the energy gap decreases with the increase of the temperature and shows different behaviors depending of the analyzed range of temperature. At low (T < 0.02 ΘD , where ΘD is the Debye temperature) and intermediary temperatures (T = ΘD ) the decrease of Eg (T) is non-linear. For high temperatures (T >> ΘD ) the energy gap decreases linearly with temperature [1-3]. The linear decrease of Eg (T) occurs due to the contribution of two distinct mechanisms: the electron-phonon interaction and the thermal expansion of the lattice [4-7]. In general, the contribution of the thermal expansion for the change of Eg (T) is small as compared to the contribution of the electron-phonon interaction [7, 8]. By this reason, several models proposed in the literature just take into account the electron-phonon interaction as a first approximation to the behavior of the Eg (T ) [9]. In the case of GaAs, the electron-phonon interactions which lead to a decrease of the energy gap with the temperature are associated to the longitudinal-acoustic (LA) and the longitudinal-optical (LO) phonons, being the dominant contribution due to the LA phonons [9-11]. Among several models usually used to describe Eg (T), we find in the literature the distinguished models of Viña [12] (1984), Pässler-p [9] and Pässler-ρ [13] (1997). Essentially, these models differ among themselves with respect to the behavior of Eg (T) at low temperatures. The model of Viña [12] shows a plateau behavior for T < 50 K, making clear the absence of any dependence of the energy gap with temperature. ∗ Electronic address: [email protected] The Pässler-ρ [13] model shows a quadratic dependence of Eg (T ) [14]. The Pässler-p model shows a T p [1] dependence for T < 0.02 ΘD with p = 4. For several semiconductor materials Eg (T) still shows a T p -dependence with the increase of temperature, but for values of p in the range from 2 up to 3.3. In the limit of high temperatures (T >> ΘD ), all the models describe a linear asymptotic behavior of the energy gap with temperature given by[13]: Θi Eg (T ) = Eg (0) − αi T − (1) 2 where αi = −dEgi (T )/dT )T → ∞ = αB , α p or αρ· Θi = ΘB , Θ p or Θρ are empirical parameters related to the effective energy of the phonons in the temperature scale (Θe f f = hεi/kB )) associated to the models of Viña, Pässler-p and Pässler-ρ respectively. Extrapolating the linear dependence of Eg (T ) from high temperatures back to T = 0 K, it is possible to estimate the renormalization of the energy gap at zero temperature, i.e., the zero-point energy ∆E(0) defined as ∆E(0) = E(0) − Eg (0), where the non-renormalized energy gap, E(0), is the energy of the crystalline system with immobile atoms at theirs equilibrium positions, and Eg (0) is the renormalized gap at T = 0 K. For the different models, ∆E(0) can be written as: ∆E(0) = αi Θi ≡ ai 2 (2) with αi and Θi as defined in Eq. (1). It is worthwhile to comment that, according to D. Rönnow et al [15], the renormalization of the gap is highly dependent on the model used to fit the temperature dependence of the energy gap. Still according to the same authors, the value of ∆E(0) estimated from the temperature dependence of Eg (T ) should be used as a criterion for the applicability of the different proposed models [15]. Results from the literature show that the values of ∆E(0) 16 for GaAs and others semiconductor materials seem to be dependent on the upper limit of the range of temperature used to perform the fits [16]. Due to the possibility to produce semiconductor materials with precise isotopic composition, nowadays it is possible to analyze the material properties as a function of the variation of the isotopic masses. At low temperatures, the change of the energy gap with the isotopic mass is proportional to M −1/2 , where M is the mean effective masses of the constituent atoms of the material [17]. In the high temperature range, the energy gap does not depend on M. For GaAs, due to its similarity with Ge and due to the fact that As has only one stable isotope, the effect of the substitution of the 69 Ga and 71 Ga isotopes on the energy gap can be described by [18]: ∂Eg 1 1 = ∆E(0) (3) ∂MGa 2 2MGe where MGe = 70 amu and ∆E(0) = 53 meV. N. Garro et al [19] obtained ∂Eg /∂MGa = 0.39 (0.06) meV/amu for the direct energy gap of GaAs using reflectivity measurements at 10 K, and 0.43 meV/amu performing calculations with the pseudopotential method. If we use the experimental value ∂Eg /∂MGa = 0.39 meV/amu in Eq. (3), a value of ∆E(0) = 110 meV is obtained for GaAs. As a matter of fact, the values of ∆E(0) that are found in the literature for GaAs from estimates of isotopic substitution, linear extrapolation, and theoretical calculations are quite different [16,18,20]. According to our understanding, one important factor that must be taken into account for the analysis of these contrasting results is the lack of systematic experimental date for T ≥ ΘD , which hides a possible non-linear behavior of Eg (T ) in the high temperature range. With respect to the issue, we notice that several estimates of ∆E(0) obtained by extrapolation procedures of the Eg (T ) curve at T = 0 K are obtained with parameters determined from fits in small domains of temperature, with the upper limit of the temperature interval smaller than the Debye temperature [16]. According to Pässler [3], a precise description of Eg (T ) and a reliable extrapolation procedure from high to very low temperatures can only be obtained if the experimental data set is measured up to or higher than the Debye temperature. However, the Debye temperature of several materials is relatively high (for instance, ΘD (C) = 1880 K [3], ΘD (AlN)= 1020 K and ΘD (GaN)= 870 K [21]), and there is a lack of experimental data for several materials at temperatures around ΘD . Experimental data from Panish [22], Shen [23] and Lautenschlager [11], usually used in the literature to describe Eg (T ) at high temperatures [3, 24], covers a wide temperature range but have a reduced number of data points with a large numerical dispersion, which does not allow us to infer about the non-linear behavior of Eg (T ). In a relatively old work, Bludau et al [25] analyzing the dependence on temperature of the indirect energy gap of Si have mentioned that it seems that the predicted linearity of Eg (T ) is not a precise description of the behavior of energy gap at high temperatures. Cardona and Thewalt [16] also make remarks about the accuracy of the results deriving from perturbation theory that keeps only up to the second order terms of the atomic displacements (proportional to < u2 >) in the Hamiltonians used to describe the electron-phonon interactions. At high temperatures < u2 > is proportional to T, but the inclusion of higher order terms R. R. O. Morais et al. which are not considered in the linear approximation could lead to larger values of the exponents of T. In this way, procedures based on the linear approximation together with extrapolation from high to low temperatures or only the high temperature behavior of Eg (T ) can lead to incorrect values of the physical quantities as ∆E(0) or erroneous calculations of the thermal expansion contribution and the electron-phonon interaction to the change of the energy gap with temperature. In the present work we analyzed the applicability of different theoretical models to describe to dependence of the fundamental energy gap with temperature in the range from 12 up to 957 K/974 K. To analyze the region for temperature T > 300 K we used experimental data from several researchers [11, 22, 23, 26, 27]. Performing several fittings for different values of the upper limit of the analyzed temperature range (Tmax ), we were able to follow in a systematic way the evolution of the fitting parameters up to the limit of high temperatures and discuss the origin of the contrasting results related to the renormalization of the zero-point energy. Moreover, based on the experimental data of Johnson et al [27] we were able to confirm evidences of non-linear behavior of the GaAs energy gap for T > 300 K. II. THEORETICAL DETAILS In this section, we present a short description of the theoretical expressions used to perform the fits of Eg (T ) versus T. The expression proposed by Viña et al [12] is given by: Eg (T ) = EB − aB " 2 1+ exp ΘB T − 1 # (4) where Eg (T = 0) = EB − aB is the energy gap at T = 0 K; aB represents the strength of the electron-phonon interaction; ΘB = ~ω/kB is a characteristic temperature representing the effective mean energy of the phonons (Θ ≡ hεi/kB ) on the temperature scale, which coincides with the phonon temperature in the single oscillator model, but does not have any correspondence with any peak in the phonon spectra; αB = 2aB /ΘB is the slope of the curve Eg (T ) versus T as T → ∞, i.e., αB ≡ −(dEg (T )/dT )T →∞ . The material-specific degree of phonon dispersion (dispersion coefficient), given by ∆ = [(< ε2 > − < ε >2 )/ < ε >2 ]1/2 , is zero [28] in this case. The expression proposed by Pässler [9] in the p-type model is given by: αpΘp Eg (T ) = Egp (0) − 2 "s p 2T 1+ Θp p # −1 (5) where Egp (0) is the energy gap at T = 0 K; α p is the slope of Eg (T ) as T → ∞ i.e., α p ≡ (dEg (T )/dT )T →∞ ; Θ p is an empirical parameter associated to the effective mean energy of the phonons in the temperature scale Θ = hεi/kB and is given by the expression Θ = Θ p [1.152 +0.145 ln(p – 1.7)], with a dispersion coefficient given by ∆ = (p2 −1)−1/2 , where p is an exponent of the spectral function. The other model used in our work is the ρ-type Pässler i Brazilian Journal of Physics, vol. 40,“ID733” no. 1, March, 2010 — 2010/1/22 — 16:16 — page 3 — #3 model [13]: Brazilian Journal of Physics, vol. 40, no. 1, March, 2010 αρ Θρ Eg (T ) = Egρ (0) − 2 model [13]: s 2 4 2 π ρ 4T 4T 4 αρ Θρ+ 1+ E (T − 1 g2 ) = Egρ (0) 6 −Θρ 2 Θρ s 2 2 4 Θ ρ π 4T 4T ρ 4 (1 − 1 + − ρ)1 +coth −+1 (6) 2 6 Θ Θρ 2Tρ ρ energy gap at T= 0 K; αρ where Egρ (0) = Eg (T = 0) is Θthe −1 (6) + (1 − ρ) coth is the slope of Eg (T ) as T →2T ∞, αρ ≡ −(dEg (T )/dT )T →∞ ; Θρ is an empirical parameter related to the cutoff frequency Egρ (0) = Eg (T = 0) is the energy gap at T= 0K; αρ ωwhere 0 (Θρ = ~ω0 /kB ) and to the effective mean energy of the is the slope ∞, αρ and ≡ −(dE )/dTrelation )T →∞ ; g (T) as T → scale g (Tthe phonons in of theEtemperature obeys Θ is an empirical parameter related to the cutoff frequency ρ Θr = Θρ (1 − 0.5ρ), with a dispersion coefficient given by ω0 (Θρ = ~ω /kB ) and to the effective mean energy of the ∆= (2 − ρ)−10[ρ(4 − 3ρ)/3]1/2 . The ρ-parameter controls the phonons in the temperature scale and obeys the relation relative weight of each type of interaction: ρ → 1 represents Θ = Θρ (1 − 0.5ρ), with a dispersion coefficient given by ther prevalence of the acoustic-phonon interaction, and ρ → 0 −1 [ρ(4 1/2 . The ρ-parameter ∆ = (2 − ρ) − 3ρ)/3] controls the represents the prevalence of interaction with optical phonons. relative weight of each type of interaction: ρ → 1 represents In order to determine the fit parameters related to each thethe prevalence acoustic-phonon ρ→ oretical model, ofwetheused a chi-squaredinteraction, procedure.and The cri-0 represents the prevalence of interaction with optical phonons. terion used to obtain the best-fit parameters was calculated In ordertotothe determine the fit parameters related to each theaccording expression: oretical model, we used a chi-squared procedure. The cri the n parameterswas terion used to obtain calculated 1 best-fit exp ad j 2 2 (7) according to Sthe=expression: ∑ Eg j − Eg j n − m j=1 n 1 exp ad j 2 2 (7) Eg j − Eg j ∑ exp Sad= j n − m the where Eg j (Eg j ) indicates j=1 experimental (adjusted) values of the energy gap of the ith-data point. The factor (n – m) exp ad j iswhere the number degrees of freedom left after fitting n data Eg j (Eof g j ) indicates the experimental (adjusted) valpoints m adjustable parameters the fitting function. ues of with the energy gap of the ith-data in point. The factor (n – m) is the number of degrees of freedom left after fitting n data points with m adjustable parameters in the fitting function. III. EXPERIMENTAL DETAILS III. EXPERIMENTAL DETAILS The experimental data of the temperature dependence of the energy gap used in the present work were redigitalized Thethe experimental data of thedata temperature of from following published obtained dependence with different the energy gap used in the present work were redigitalized characterization techniques: photoluminescence data from from et thealfollowing published data 12 obtained with Grilli [26], in the range from K up to 280different K / 33 characterization techniques:et photoluminescence data from data-points; Lautenschlager al [11] (ellipsometry), from ∼ Grilli [26], the range from 12[23] K up(absorption) to 280 K / 33 data297 K et to al 510 K / in 9 points; Shen et al from ∼ points; et al [11] (ellipsometry), from ∼ 297K 300 K toLautenschlager 881 K / 6 points; Panish et al [22] (absorption), from to 510K/9 points; Shen et al Johnson [23] (absorption) ∼ 300K 294 K to 974 / 5 points, and et al [27]from (absorption) to 881K/6 al [22]Details (absorption), fromprepa294K from 330 Kpoints; to 957Panish K / 23etpoints. of sample to 974 / 5 points, and Johnson et al [27] (absorption) from ration and experimental procedure can be found in the cited 330K to 957K/23 points. Details of sample preparation and references. experimental procedure can be found in theof cited In order to perform a systematic analysis the references. experimenIn orderwe to perform systematic analysis tal results, grouped athe experimental dataofinthe twoexperimengroups: I) tal results, weKgrouped thefrom experimental in data two groups: I) data from 12 to 280 K Grilli et aldata [26], from 294 data K toLautenschlager 280 K from Grilli et al [26], dataetfrom 294 K to from 974 K12from et al [11], Shen al [23], K toPanish 974 Ketfrom Lautenschlager Shen et alGrilli [23], and al [22]; II) data fromet12alK[11], to 280 K from and Panish et al [22]; II) data from 12K to 280K from Grilli et al [26] and data from 330 K to 957 K from Johnson et al et al The [26] experimental and data fromdata 330from K togroup 957 KI from [27]. for T Johnson > 294 Ketisala [27].consistent The experimental data fromallowed group Iusfor > 294Kaccuis a very set of data which to Tperform veryfittings consistent set of data which allowed us to perform accurate for temperatures above the room temperature but rate fittings temperatures room temperature but with a large for dispersion in thatabove wholethe temperatures range (see with 1). a large dispersion in that whole temperatures range (see Fig. A still more consistent data set analyzed by us conFig. of 1).theAabsorption still more data consistent datainsettheanalyzed by us consists measured Urbach-tail region sists of the absorption data measured in the Urbach-tail region by Johnson et al [27] (group II). So, according to our strategy, for the high temperature region we have one set of data 17 by Johnson et al [27] (group II). So, according to our strategy, 3 for the high temperature region we have one set of data with 20 data-points (group I) and another set with 23 data-points (group with almost equal limit temperatures (974 with 20II) data-points (group I) upper and another set with 23 dataK / 957(group K), which enable us equal to perform a systematic analpoints II) with almost upper limit temperatures ysis of the applicability of the different to describe (974K/957K), which enable us to performmodels a systematic analE ). the From these experimental data wemodels were also able to g (Tof ysis applicability of the different to describe compare the results obtained fromdata different dataalso setsable and to to Eg (T ). From these experimental we were check anomalous behaviors of the obtained fit parameters. compare the results obtained from different data sets and to check anomalous behaviors of the obtained fit parameters. FIG. 1: 1: Experimental Experimental data FIG. data of of Eg(T) Eg (T ) in in the the range range from from ∼294 ∼294 up up to to ∼974 K al al [11] (empty circle), ShenShen et al et [23] ∼974 K from fromLautenchlager Lautenchlageretet [11] (empty circle), al (empty triangle), Panish et al [22] square) and Johnson et al [23] (empty triangle), Panish et al (empty [22] (empty square) and Johnson [27] and experimental data from al [26] the et al (full [27] circle) (full circle) and experimental data Grilli from et Grilli et alin[26] range < T 12 < 280 The inset the fitted curves the experin the 12 range < TK.< 280 K.shows The inset shows the to fitted curves imental data from Grilli al [26] (empty at low temperatures, to the experimental dataetfrom Grilli et alstrar), [26] (empty strar), at low according to the Vinã, Pässler-p and Pässler-p Pässler-ρ and models.Experimental temperatures, according to the Vinã, Pässler-ρ models. data of Eg(T) in the range from ∼294 up to ∼974 K from Lautenchlager et al [11] (empty circle), Shen et al [23] (empty triangle), Panish et al [22] (empty square) and Johnson et al [27] (full circle) and experimental data from Grilli et al [26] in the range 12 < T < 280 K. The inset the fitted curves to the experimental data IV. shows RESULTS AND DISCUSSIONS from Grilli et al [26] (empty strar), at low temperatures, according to the Vinã, Pässler-p and Pässler-ρ models. In Fig. 1 we show the experimental data for Eg (T ) from the groups I and II in the temperature range ∼ 12 < T < 974(957) K, and the fitted curves using the different models considered in the present work. The inset of this figure shows the redigiIV. RESULTS AND DISCUSSIONS talized data of Eg (T ) in the range ∼ 12 K < T <∼ 100 K together with the fitted curves considering the whole analyzed In Fig. 1 we show theWe experimental forregion Eg (T)offrom domain of temperatures. can observedata in the low the groups Ithe andsame II inpattern the temperature range ∼in12 T < temperature already observed the<litera974(957)K, using thea different models ture [13, 29] and withthe thefitted Viña curves model showing plateau behavior considered The inset thisones figure shows for T = 50 in K the andpresent values work. of S2 larger thanofthat obtained the redigitalized data of Eg (T ) infitthe range 12K < Tmodel <∼ with the other two models. The with the ∼ Pässler-ρ 100K totogether with the fitted curvesbehavior considering leads an approximately quadratic of Eg the (T ) whole with a 2 comparable analyzed of temperatures. We can observe the revalue of Sdomain to the one obtained with the in Pässler-ρ gion of low temperature the same pattern already observed in model. The values of the parameters obtained from the fits the literature [13, 29] with the Viña model showing a plateau according to the different models are 2shown in Table I. The behavior for T to = high 50K and values of (T S > larger thatEones extrapolations temperatures 280than K) for g (T ) obtained the for other models.parameters The fit with theFigs. Pässler-ρ (see Fig. with 1) and thetwo adjusted (see 2-4) modelperformed leads to anusing approximately behavior Egtem(T ) were the data ofquadratic Grilli et at [26] inofthe 2 with a value S Kcomparable with the perature rangeof12 < T < 280toK.theAsone canobtained be observed, the Pässler-ρ model.by The values of the obtained from curves obtained extrapolation areparameters located above the experthe fits according tofact the confirms different that models are shown in Taimental points. This erroneous conclusions ble I. The extrapolations to high temperatures (T > 280K) for Eg (T) (see Fig. 1) and for the adjusted parameters (see Figs. 2-4) were performed using the data of Grilli et at [26] in the i 18 R. R. O. Morais et al. to increase with the increase of Tmax . The values for ∆E(0) obtained from the product αB = 2aB /ΘB using Tmax ∼ 3ΘD (ΘD = 360 K for GaAs) are ∼ 64.1 meV and ∼ 73 meV for the two experimental data groups I and II respectively (see Table I). The values of the parameters determined from extrapolations to high temperatures stay constant with the increase of Tmax and the obtained curves pass well below the experimental points. Therefore, we verify that to obtain consistent extrapolations using the Viña model it is necessary to have experimental data beyond the Debye temperature. The pa- p g 1,540 a) P 400 1,510 160 aP Passler-p 25,9 250 21,6 200 17,2 c) P 0,8 B (eV) E Eg 1,510 100 3,2 I) 0,4 p Passler-p 225 19,4 B 175 I) 150 II) B 12,9 20 e) 0,55 I) 300 450 600 T (K) MAX 750 II) B (meV/K) 0,35 Viña I) II) 0,20 150 300 450 600 T (K) MAX 750 1,8 150 300 450 600 T (K) MAX 750 900 900 0,40 B 900 II) 0,45 0,25 750 2,0 aB Viña 0,50 0,30 (K) MAX 2,2 150 0,60 600 T 2,4 40 30 450 2,6 50 15,1 300 p 60 (meV) 70 21,6 d) e) I) 3,0 II) aB (meV) 23,7 250 B (K) 275 17,2 0,6 150 B Viña 2,8 80 Viña d) II) 0,5 E 1,530 200 0,7 p 80 40 25,9 c) p 60 1,540 1,490 300 (meV/K) II) 1,560 1,550 1,500 PasslerI) 1,570 1,520 B b) 1,580 II) 1,530 (0) (eV) 1,590 a) Viña I) 30,2 300 1,490 ap (meV) B g 34,5 1,500 120 E b) p 1,520 I) 1,540 38,8 p II) 350 140 1,550 PasslerI) II) (K) (0) (eV) 450 p I) 1,530 p g Passler- 900 FIG. 2: Temperature range dependence of the fitting parameters obtained according to the Viña model [12] for the experimental data from group I (full star) and II (empty square). The dashed line is obtained by extrapolation of the parameters values determined from fits to the experimental data of Grilli et al [26]. The parameters EgB and αB are calculated from the relations EgB = EB - aB and αB = 2aB /ΘB , respectively. The error bars are calculated by method of error propagation. In Figs 2(b)-(d) we show the parameters EB , ΘB , and aB obtained with the model of Viña [12]. In order to compare these data with the others obtained by us, we also show EgB (0) = EB − aB (Fig. 2(a)) and αB = 2aB /ΘB (Fig. 2(e)). The symbols represent the values of the parameters obtained in different ranges of temperature for different values of Tmax . The values of EgB (0), determined for different values of Tmax , are almost constant in the whole temperature range for the different sets of experimental data. The parameters EB , ΘB , and aB obtained from group I increase in the range 12 K < T < 280 K showing a tendency to saturate for T > 350 K. The parameters EB , ΘB and aB from group II show a slight tendency FIG. 3: Temperature range dependence of the fitting parameters obtained according to the Pässler-p [9] for the experimental data from group I (full star) and II (empty square).The dashed line is obtained by extrapolation of the parameters values determined from fits to the experimental data of Grilli et al [26]. The parameter a p is calculated by a p = α p Θ p /2. The error bars are calculated by method of error propagation. rameters obtained with the Pässler-p model [9] are presented in Figs. 3(a)-(d). The parameter a p defined as a p = α p Θ p /2 is shown in Fig. 3(c). The values of the gap parameter Egp (0) (Fig. 3(a)) has practically a constant value with Tmax . The parameters Θ p , α p and a p show a similar behavior with Tmax (compare the shape of the curves in Figs. 3(b)-(d)). Concerning the results from group-II, we verified a step increase of Θ p , α p and a p parameters in the range 280 K < T < 350 K and a small decrease with further increase of the temperature. The parameter p has values in the range from 2.4 up to 2.7 in the whole analyzed temperature range, which gives intermediary dispersion coefficients (0.3 < 0.4 (p = 2.7) < ∆ < 0.54 (p = 2.4) < 0.577) and leads to a small difference among the results from the different groups of data in the temperature range delimited by Tmax (see Table I). In general, the standard behavior of the parameters determined from the different data sets by the Pässler–p model is very similar. The curves obtained with the parameters determined from the extrapolation procedure are very close to the experimental data (see Fig. 3). Based on our findings we can say that the extrapolations using the Pässler-p model provide results more consistent with (meV) E p 1,550 E about the behavior of Eg (T ) at high T are inferred if the experimental data are within a small temperature range. The fits obtained with the different models in the full temperature range coincide in the high temperature region for both groups of experimental data. We see in Fig. 1 that the experimental values of Eg (T ) obtained by Johnson et al [27] are located, in general, below the data from group I. This fact is well evident when we observe the curves fitted to the different sets of experimental data. A possible explanation for this difference can be related to the different procedure used by Johnson et al [27] to obtain Eg (T ), which is based on observation of the Urbach tail. Another possibility which should also be considered is that the data of Johnson et al [27] were obtained with the same technique, the same procedure, the same sample in the whole domain of analyzed temperatures, which can provide a more systematic behavior for Eg (T ), with a smaller dispersion, differently from the others data sets. Brazilian Journal of Physics, vol. 40, no. 1, March, 2010 19 the experimental data for T > 280 K. We also verified that the curves determined by extrapolation for T > ΘD (ΘD = 360 K for GaAs) are superimposed to the experimental data in this temperature range. Larger errors in the range 280 K < T < 500 K are probably due to the dispersion of the group-I experimental data. The parameter a p tends to ∼ 58 meV (∼ 68 meV corrected) and to 70 meV (84 meV corrected) for the two experimental data group I and II respectively (see Table I). (0) (eV) a) (0) Passler- r (K) r 1,510 1,500 1,490 a 120 c) Passler- 38,8 34,5 I) II) 350 1,520 b) Passler- 400 II) 1,530 Eg 450 I) 30,2 300 25,9 250 21,6 200 17,2 150 12,9 (meV) Eg 1,540 r 1,550 d) 0,55 I) 0,50 (meV/K) II) 80 60 a (meV) 100 40 0,45 0,40 PasslerI) 0,35 II) 20 150 1,2 PasslerI) 0,9 e) 300 450 600 T (K) MAX 750 900 FIG. 5: Temperature dependence of the GaAs energy gap in the temperature range from ∼ 294 up to ∼974 K. The variation is calculated by the change of Eg (T ) at two consecutive temperatures divided by the respective temperature interval which that change occurred. The temperature mean value in each interval is plotted for each temperature interval. II) 0,6 0,3 0,0 150 300 450 600 T (K) MAX 750 900 FIG. 4: Temperature range dependence of the fitting parameters obtained according to the Pässler-ρ [13] for the experimental data from group I (full star) and II (empty square).The dashed line is obtained by extrapolation of the parameters values determined from fits to the experimental data of Grilli et al [26].The parameters Θr and aρ are calculated by the equations Θr = Θρ (1-0.5ρ) and aρ = αρ Θr /2. The parameter a p is calculated by a p = α p Θ p /2. The error bars are calculated by method of error propagation. In Figs. 4 (a)-(e) we show the parameters obtained from the Pässler-ρ model [13]. We see in Fig. 4(a) that the values Egρ (0) are practically constant with T max . The parameters Θr , aρ and αρ show similar trends with the increase of the temperature. The results of group II show an abrupt increase in the range 280 K < T < 350 K. The parameter Θr from group I show large error bars and oscillatory behavior around 500 K. Moreover, the tendency of all the parameters with the increase of the temperature is practically the same and does not depend on T max . The ρ-parameter has values in the range from 0.4 up to 0.8 for groups I and II. However, its value is more concentrated in the region 0.3 < ρ < 0.6, which leads to an intermediary dispersion in the range 0.328 < ∆ < 0.574, in agreement with the criterion of applicability of the Pässler model [29]. Similarly to the results of the Pässler-p model, the results obtained with Pässler-ρ are also in excellent agreement with the experimental data and are more consistent when compared to the ones obtained with the Viña model. The parameter aρ tends to ∼ 65 meV and ∼ 76 meV for the two experimental data group I and II respectively (see Table I). In general, the fitting parameters are strongly dependent of the range of temperature chose to perform the fits, i.e., the chosen value of Tmax , mainly in the range 12 K < T < 450 K for the case of the Viña model, and in the range 12 K < T < 300 K for the Pässler-p and Pässler-ρ models. Therefore, the extrapolations of the fitted curves for Eg (T ) from the low temperature experimental data to the high temperature regions lead to parameters with very consistent values for T > 450 K for the Viña model, and T > 360 K for the Pässler-p and Pässler-ρ models. Considering Tmax = 974 K or 957 K, the Pässler-ρ model provides parameters with larger error bars. In order to correlate our findings with the GaAs density of phonons we must take into account a correction for the value of Θ p according to the expression Θe f f ≡< ε/kB >= Θ p [1.152 +0.145ln(p– 1.7)] [3]. This correction increases about 10% to 20% the value of Θ p if we consider the range 280 K < T < 957 / 974 K. Considering the fits performed for Tmax (957/974 K) the changes of the values of kB Θi (i = B, p effective, ρ) due to the inclusion of the corrections vary from 22.2 meV (ΘB from group I) up to 27.8 meV (Θe f f p from group II), as can be seen in Table I. The values of Θi from the two data sets are, therefore, below the cut-off energy of the LA-phonon branch (εLA = 28 meV). This result indicates that the decrease of the energy gap with temperature is mainly due to the interaction of electrons with LA phonons. Complementary analysis, performed by expanding the range of temperature up to T ∼ 1179 K and the models of Viña and Pässler-ρ along with the data from Beaudoin et al [30] which were obtained with a similar experimental procedure used by Johnson et al [27], show that the value of the ai parameter does not show an enlargement tendency with the increase the expansion of the temperature range, becoming stabilized around ∼ 75 meV (Viña) and ∼ 79 meV (Pässlerρ) [31]. The values obtained here are therefore different from that founded in the literature obtained extrapolating the linear dependence of the gaps at high T to T = 0 K and that determined by the dependence of the gap on isotope mass [16,18,20]. As we mention before, we consider that the lack of experimental data of Eg (T ) in the high-T range in the fit models of Eg (T ) is one of the relevant factors to consider for 20 R. R. O. Morais et al. Table I – Fitting parameters of Eg(T) and their respective incertitudes according to Viña (EgB(0), EB, ΘB, aB, αB) [12] , Pässler-p (Egp(0), Θp, ap, αp, p) [9] and Pässler-ρ (Egρ(0), Θr, aρ, αρ, ρ) [13] models for the temperature ranges 12 K < T < ~192 K, 12 K< T < 280 K, and 12 K < T < 974 K for the group I experimental data and in the range 12 K < T < 957 K for group II. The last column shows the values of S2 (see Eq. 7). a) Viña ∆T I) 12-192 12-280 I) 12-974 II) 12-957 I) EgB(0) (meV) 1519.1 ± 2.5 1518.4 ± 2.0 1518.0 ± 5.3 1517.6 ± 1.8 EB (meV) 1566.1 ± 1.6 1570.4 ± 1.2 1582.1 ± 2.8 1590.1 ± 0.9 ΘB aB αB (K) (meV) 214.88 (18.5) ± 4.36 227.97 (19.6) ± 3.57 258.14 (22.2) ± 12.0 278.31 (23.9) ± 3.75 (meV) 47.0 ± 1.6 52.0 ± 1.3 64.1 ± 3.4 72.5 ± 1.1 (meV/K) 0.43 ± 1.73x10⁻² 0.46 ± 1.35 x10⁻² 0.50 ± 3.50 x10⁻² 0.52 ± 1.05 x10⁻² b) Pässler-p ∆T Egp(0) (meV) Θp ap (K) (meV) 12-192 12-280 I) 12-974 II) 12-957 1519.2 ± 0.07 1519.1 ± 0.09 1519.0 ± 1.42 1519.2 ± 0.34 215.43 (18.6) ± 12.68 219.44 (18.9) ± 5.99 236.90 (20.4) ± 18.0 268.25 (23.1) ± 5.63 (meV) 50.6 ± 3.4 51.6 ± 5.72 58.1 ± 9.01 69.7 ± 1.50 I) I) ∆T I) 12-192 12-280 12-974 II) 12-957 I) I) Θeffp aeffp (K) (meV) 249.45 (21.5) ± 14.53 255.45 (22.2) ± 6.82 276.53 (23.8) ± 20.55 322.90 (27.8) ± 6.27 (meV) 58.6 ± 3.9 60.0 ± 1.80 67.8 ± 10.8 84.0 ± 1.7 c) Pässler-ρ ∆T Egρ(0) (meV) 12-192 12-280 I) 12-974 II) 12-957 1519.3 ± 0.07 1519.3 ± 0.09 1519.2 ± 1.70 1519.4 ± 0.30 I) I) αp p 0.47 ± 0.0152 0.47 ± 0.0054 0.49 ± 0.0069 0.52 ± 0.00169 2.66 ± 0.086 2.62 ± 0.06 2.6 ± 0.37 2.40 ± 0.07 4.69x10⁻⁴ 5.17x10⁻⁴ 19.2 x10⁻² 1.07 x10⁻² S2 (10-4 meV2) αρ Θr aρ (meV) (meV/K) ρ 60.2 ± 3.8 60.7 ± 2.72 65.4 ± 21.8 76.1 ± 6.5 0.48 ± 0.087 0.48 ± 0.004 0.50 ± 0.01 0.53 ± 0.001 0.38 ± 0.04 0.41 ± 0.04 0.35 ± 0.41 0.52 ± 0.08 the precise description of Eg (T ). In face of the dispersion of results for ∆E(0) values from both procedures (extrapolating the linear dependence of the gaps at high T to T = 0 K and the dependence of the gap on isotope mass) we inferred that or the linear dependence of Eg (T ) at high temperatures (T >> ΘD ) is not reached in the analyzed temperature range or, as pointed out by Cardona and Thewalt [16], electron-phonon anharmonic effects lead to a higher-order dependence of the energy gap with temperature. Therefore, the choice of upper limit of temperature to which Eg (T ) has a linear dependence with T is arbitrary, and can lead to incorrect values of ∆E(0) when Eq. 2 is used. For instance, using the Pässler-p model [9] to describe the temperature dependence of the energy gap of GaAs in the range from 2 K to 280 K, and the values Θ p = 226 K, α p = 0.347 meV/K and p = 2.51, Cardona et al [18] estimated ∆E(0) = 53 meV (- 53 meV in the Cardona [16] notation) from the photoluminescence data measured by Grilli et al [26]. Using another set of experimental data with a different upper limit defining the domain of temperature (974 K ∼ 2.7ΘD ), Cardona et al [18] obtained ∆E(0) = 90 meV. As can be find out from these results, the values of ∆E(0) obtained for GaAs seem to be dependent on the upper limit of the domain of temperature used to perform the fits. It is also important to say that the value of 90 meV was obtained from the fits of two sets of experimental results: (i) the data obtained by Grilli et al [26] in the range 2 K < T < 280 K and (ii) the absorption data obtained by Panish et al [22] in the high temperature region (294 K < T < 974 K). However, these data for high temperatures were recorded in a relatively large tem- S2 (10-4 meV2) (meV/K) (K) (meV) 251.01(21.6) ± 13.49 252.80(21.8) ± 10.5 261.80(22.6) ± 96.8 287.90(24.8) ± 25.2 S2 (10-4 meV2) 3.57x10⁻⁴ 23.8x10⁻⁴ 19.2 x10⁻² 1.83 x10⁻² 4.61x10⁻⁴ 4.84x10⁻⁴ 19.3x10⁻² 1.01x10⁻² perature range with a reduced set of data points (5 points), which prejudices the fits and the carried out analysis. The lack of systematic experimental data for temperatures above the room temperature is an entanglement for the analysis of Eg (T ) for a large number of materials. The data from Johnson et al [27] allow, a more systematic analysis of Eg (T ) for GaAs. Using the finite difference method to analyze the experimental data of Eg (T ) obtained by Johnson et al [27], it is possible to visualize the change of the parameter αexp = −∆Egexp (T )/∆T by performing derivatives in successive ranges of Eg (T ). In Fig. 5 we show the values of αexp as a function of the mean temperature for each interval ∆T obtained with the data of Johnson et al [27]. Therefore, αexpn is given by: αexp n = ∆Eg (T ) Eg (Tn ) − Eg (Tn−1 ) = ∆T Tn − Tn−1 1 (8) where Tn and Tn−1 are consecutive values of T, and Eg (Tn ), Eg (Tn−1 ) are the respective experimental values of the energy gap. In general, in the range from 330 K up to 957 K, the value of αexpn decreases from -0.47 to -0.55 meV/K between two consecutive intervals. This variation of αexpn is relatively large (∼ 17%) considering the predicted linear behavior of Eg (T ) at high temperatures. The non-linear behavior of Eg (T ) was already foreseen by Bludau et al [25] who used second order polynomes to fit the temperature dependence of Si indirect-energy gap. Cardona and Thewalt [16] also point out the importance of anharmonic terms (which leads to higher order terms in T) in the electron-phonon interaction to analyze the temperature dependence of the lattice Brazilian Journal of Physics, vol. 40, no. 1, March, 2010 parameter of Si. The experimental data of Eg (T ), from the results of Johnson et al [27], even in the limit of high temperatures, show a small curvature that must be taken into account when we analyze the temperature dependence of the energy gaps. The extrapolation from the linear dependence at high temperature to low temperature tends to be done with some degree of arbitrariness, which can explain the contrasting results of ∆E(0) obtained with from the different experimental procedures. Therefore, the results of Johnson et al [27] allowed us confirm the non-linear temperature dependence of the GaAs energy gap at high temperature. So, our findings indicate that more systematic experimental studies searching the high temperature region (T >> ΘD ) must be performed in order to obtain a precise description of the dependence of the energy gap with temperature. V. CONCLUSIONS In this work we analyzed the temperature dependence of the GaAs energy gap using different sets of experimental data. We performed fits of Eg (T ) versus T in different domains of temperature defined by different upper temperatures. We were able to make a systematic comparison of the fit- [1] M. Cardona, T. A. Meyer and M. L. W. Thewalt, Phys. Rev. Lett. 92, 196403-1 (2004); [2] P. Debye, Ann. Phys. 22, 180 (1907); [3] R. Pässler, Phys. Status Solidi (b) 216, 975 (1999); [4] P. B. Allen and V. Heine, J. Phys. C: Solid State 9, 2305 (1976); [5] S. Zollner, S. Gopalan and M. Cardona, Sol. Stat. Commun. 77, 485 (1945); [6] P. B. Allen and M. Cardona, Phys. Rev. B 23, 1495 (1981); [7] A. Manoogian and J. C. Wooley, Can. J. Phys. 62, 285 (1984); [8] J. P. Walter, R. R. L. Zucca, M. L. Cohen and Y. L. Shen, Phys. Rev. Lett. 24, 102 (1970); [9] R. Pässler, Phys. Status Solidi (b) 200, 155 (1997); [10] C. Lárez and C. Rincón, J. Phys. Chem. Solids 58, 1111 (1997); [11] P. Lautenschlager, M. Garriga, S. Logothetidis and M. Cardona, Phys. Rev. B 35, 9174 (1987); [12] L. Viña, S. Logohtetidis and M. Cardona, Phys. Rev. B 30, 1979 (1984); [13] R. Pässler, J. Appl. Phys. 83, 3356 (1998); [14] R. Pässler, E. Griebl, H. Riepl, G. Lautner, S. Bauer, H. PÇreis, W. Gebdhardt, P. Buda, D.J. As, D. Schikora, K. Lischka, K. Papagelis, S. Ves, J. Appl. Phys. 86, 4403 (1999); [15] D. Rönnow, L. F. Lastras-Matı́nez and M. Cardona, Eur. Phys. J. B 5, 29 (1998); [16] M. Cardona and M. L. W. Thewalt, Rev. Mod. Phys. 77, 1173 (2005); 21 ting parameters obtained with three theoretical models in a large temperature range (12 K to 974 K / 957 K). The values obtained for the zero point renormalizations energy - ∆E(0) - from different experimental data groups and from different theoretical models for fitting the temperature dependence of GaAs obtained extrapolating the linear dependence of the gaps at high T to T = 0 K varying between 64.1 meV (Viña model) and 84 meV (Pässler-p model). Using absorption experimental data measured in temperatures higher than the room temperature we were able to observe the non-linearity of Eg (T ) as already reported in the literature, with a quite large value for dEg (T )/dT in the range 280 K < T < 957 K. We believe that a more realistic description of Eg (T ) can only be obtained if the effects of the non-linearity at high temperatures are included in the theoretical models describing the dependence on temperature of the energy gap. ACKNOWLEDGEMENTS The authors would like to thank the financial support granted by the Brazilian agencies CAPES, CNPq, Fundação Araucária and FBB. [17] C. Parks, A. K. Ramdas, S. Rodriguez, K. M. Itoh and E. E. Haller, Phys. Rev. B 49, 14244 (1994); [18] M. Cardona, Phys. Status. Solid. (a) 188, 1209 (2001); [19] N. Garro, A. Cantarero, M. Cardona, A. Göbel, T. Ruf. And K. Eberl, Phys. Rev. B 54(7), 4732 (1996); [20] T. A. Meyer, D. Karaiskaj, M. L. W. Thewalt and M. Cardona, Sol. Stat. Commun. 126, 119 (2003); [21] R. Pässler, J. Appl. Phys. 90, 3956 (2001); [22] M. B. Panish and H. C. Casey, Jr., J. Appl. Phys. 40, 163 (1969); [23] H. Shen, S. H. Pan, Z. Hang, Jin Leng, Fred. H. pollak, J. M. Woodall and R. N. Sacks, Appl. Phys. Lett. 53, 1080 (1988); [24] C. D. Thurmond, J. Electrochem. Soc.:Solid State Science and Technology 122, 1134 (1975); [25] W. Bludau, A. Onton and W. Heinke, J. Appl. Phys. 45, 1846 (1974); [26] E. Grilli, M. Guzzi, R. Zamboni and L. Pavesi, Phys Rev. B 45, 1638 (1992); [27] S. R. Johnson and T. Tiedje, J. Appl. Phys. 78, 5609 (1995); [28] R. Pässler, J. Appl. Phys. 88, 2570 (2000); [29] R. Pässler, Phys. Rev. B 66, 085201-1 (2002); [30] M. Beaudoin, A. J. G. DeVries, S. R. Johnson, H. Laman and T. Tiedje, Appl. Phys. Lett. 70, 3540 (1997); [31] R. R. O. Morais, to publish
Baixar