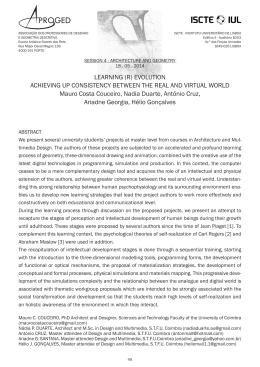
Energy for Sustainability 2013
Sustainable Cities: Designing for People and the Planet
Coimbra, 8 to 10 September, 2013
COMMUNICATING LIFE-CYCLE ASSESSMENT RESULTS: A
COMPARISON OF VEHICLE ALTERNATIVES IN PORTUGAL
Ana Rita Domingues1*, Pedro Marques2, Rita Garcia2, Fausto Freire2 and Luís Dias1,3
1
INESC Coimbra
Rua Antero de Quental, n.º199, 3000-033 Coimbra, Portugal
Email: [email protected], [email protected], web: http://www.uc.pt/en/org/inescc
2
ADAI-LAETA
Faculdade de Ciências e Tecnologia - Departamento de Engenharia Mecânica
Universidade de Coimbra
Pólo II Campus, Rua Luís Reis Santos, 3030-788 Coimbra, Portugal
Email: [email protected], [email protected], [email protected],
web: http://www2.dem.uc.pt/CenterIndustrialEcology/
3
Faculdade de Economia, Universidade de Coimbra
Av. Dias da Silva 165, 3004-512 Coimbra, Portugal
Keywords: Environmental impacts, electric vehicle, energy, life-cycle assessment,
normalisation.
Abstract A variety of alternative vehicle technologies are emerging, leading to a
diversification on consumer choice and the need to assess their environmental impacts. This
paper aims to compare vehicle alternatives through a Life-Cycle Assessment (LCA),
proposing relevant Normalisation References (NR) as a way of communicating LCA results.
Six compact passenger vehicles available in Portugal are comparatively assessed: a gasoline
and a diesel internal combustion vehicles, a hybrid electric vehicle, two plug-in electric
vehicles (10 miles and 40 miles), and a battery electric vehicle. These alternatives are
compared on the basis of two alternative NR for seven Life-Cycle Impact Assessment (LCIA)
indicators and five use-phase indicators. The two NR selected were average fleet impacts
calculated for i) the 2011 Portuguese fleet and ii) a renovated fleet considering the new
EURO 5 vehicles according to the distribution of vehicle types in Portugal. The results show
that the Battery Electric Vehicle (BEV) is the alternative with the lowest impacts in most of
the indicators considered; on the other hand, the gasoline internal combustion vehicle is the
alternative with the highest impacts in most of the indicators considered. The use of two NR
provided different conclusions, even though the best and worst alternative for each specific
indicator is identical.
Ana Rita Domingues1, Pedro Marques2, Rita Garcia2, Fausto Freire2 and Luís Dias1
1
INTRODUCTION
In the last decades, a growing concern about pollution from vehicle transportation has
emerged. The European Union legislation has contributed to improve vehicle efficiency and
established targets for the emission of pollutants (e.g. the European Emission Standards –
EURO standards). Some countries introduced areas known as Low Emission Zones (LEZ),
which limit the circulation of vehicles that do not meet the criteria defined. In addition, in
some areas specific speed limits were established to reduce emission of pollutants. There has
been also significant research in new vehicle technologies with less potential impacts in the
environment and energy requirements (the latter related to energy dependence concerns);
however, there is controversy in the actual benefits of some new technologies in terms of lifecycle environmental impacts and energy requirements. The main objective of this study is to
comparatively assess the environmental impacts and energy requirements of vehicle
alternatives available in Portugal and to present a novel way to communicate Life-Cycle
Assessment (LCA) results. The alternatives were compared on the basis of seven Life-Cycle
Impact Assessment (LCIA) indicators and five use-phase indicators, calculated using two
Normalisation References (NR).
2
METHODOLOGY
LCA was applied to assess potential environmental impacts of vehicle alternatives through
their life-cycle. Indicators focused on the use phase were also analysed, since this phase was
considered very important in the comparison of vehicles. The results and inventory presented
in this paper were built on previous and current LCA research performed at the University of
Coimbra on electricity generation and vehicles, e.g. [1].
The inventory data was characterized into specific environmental impact categories according
to selected LCIA methods. In this study two complementary LCIA methods were used with a
total of seven impact categories (indicators): CML 2001 (CML) for six environmental impact
categories – Abiotic Depletion (AD), Acidification (AC), Eutrophication (EUT), Global
Warming (GW), Ozone Layer Depletion (OLD), and Photochemical Oxidation (PO) – and
Cumulative Energy Demand (CED) to calculate total non-Renewable primary Energy
consumption (nREn). These indicators were calculated adopting a cradle-to-grave perspective.
The model considered the overall life-cycle of vehicles and their components (e.g. batteries),
as well as the electricity generation system and the production of fossil fuels (gasoline and
diesel). Additional indicators focused on vehicle use phase: Operation Energy (OE), Petrol
Fossil Energy (PFE) and tailpipe emissions (NOx, CO, Particulate Matter – PM). The
Functional Unit (FU) selected was 1 km driving distance.
According to [2], normalisation represents a crucial role in the interpretation of LCA results.
The results of this assessment were normalised using two NR. The two NR selected were
average fleet impacts calculated for i) the 2011 Portuguese fleet (NR1, see Table 1 a) and ii) a
renovated fleet considering the new EURO 5 vehicles according to the distribution of vehicle
types in the Portuguese fleet (NR2, see Table 1 b). The normalised value for a vehicle
alternative is the ratio between its impacts and the reference: if greater than 1 it has higher
2
Ana Rita Domingues1, Pedro Marques2, Rita Garcia2, Fausto Freire2 and Luís Dias1
impacts, if less than 1 it has lower impacts. The use of these normalisation references is
intended to facilitate the communication of LCIA results.
Indicators
Average existing
fleet emissions
AD (g Sb eq)
AC (g SO2 eq)
EUT (g PO4 eq)
GW(g CO2 eq)
OLD (g CFC-11 eq)
PO (g C2H4 eq)
nREn (fossil) (MJ)
OE(MJ)
PFE (MJ)
NOx (g)
CO (g)
PM (g)
1.55
0.70
0.13
232.16
2.75 x 10⁻⁵
0.06
3.42
b)
NR 2
a)
NR 1
Table 1.Normalisation references: a) NR1 b) NR2 (64.4% Gasoline, 35.4% Diesel, 0.2% HEV, 0% PHEV, 5.07
x 10-5 BEV).
2.47
2.81
0.27
1.10
0.11
Indicators
Average renovated
fleet emissions
AD (g Sb eq)
AC (g SO2 eq)
EUT (g PO4 eq)
GW(g CO2 eq)
OLD (g CFC-11 eq)
PO (g C2H4 eq)
nREn (fossil) (MJ)
OE(MJ)
PFE (MJ)
NOx (g)
CO (g)
PM (g)
1.59
0.66
0.15
236.01
2.71 x 10⁻⁵
0.06
3.45
2.37
2.78
0.09
0.67
0.10
2.1 Goal and scope
This study aims at comparing 6 vehicle alternatives of EURO 5 compact passenger vehicles:
Volkswagen Golf 1.4 (Gasoline Internal Combustion Engine Vehicle – GICEV), Volkswagen
Golf 1.6 TDI (Diesel Internal Combustion Engine Vehicle – DICEV), Toyota Prius 1.8
(Hybrid Electric Vehicle - HEV), Toyota Prius Plug-in 1.8 (Plug-in Hybrid Electric Vehicle
10 miles - PHEV10), Chevrolet Volt 1.4 (Plug-in Hybrid Electric Vehicle 40 miles PHEV40), and the Battery Electric Vehicle Nissan Leaf (BEV). It is assumed that each
vehicle runs for 200 000 km in its service life. The main characteristics of the vehicle engine
technologies are summarized in Table 2. All vehicles use gasoline, except DICEV and BEV.
Table 2. Vehicle technology: main characteristics.
Criteria
Weight of vehicle (battery included) kg
Gasoline| Diesel (l/100 km)
Electricity (Wh/km)
Battery capacity (kWh)
Full discharge (km)
n.a.: not applicable
GICEV
1270
7.2
n.a.
n.a.
n.a.
DICEV
1295
6.3
n.a.
n.a.
n.a.
HEV
1500
4.5
n.a.
1,3
n.a.
PHEV10
1525
4.7
249
4,4
16
PHEV40
1732
3.9
163
16
64
BEV
1525
n.a.
137
24
175
2.2 Input data and assumptions
The main sources of data are peer-reviewed literature and the Ecoinvent v2 database [3]. The
daily distance travelled was defined according to [4]. Specific data for the Portuguese context
was used whenever possible, including the specific characteristics of the vehicles available in
Portugal, the Portuguese electricity mix for 2011, and the Portuguese passenger vehicle fleet.
3
Ana Rita Domingues1, Pedro Marques2, Rita Garcia2, Fausto Freire2 and Luís Dias1
3 APPLICATION: EVALUATION OF VEHICLE ALTERNATIVES IN PORTUGAL
Figure 1 shows the normalisation results for each alternative, where normalised values above
1 represent impacts for which the alternative is worse than the reference (i.e., worse than the
average emissions of the Portuguese fleet in 2011 for NR1 results, or worse than the average
fleet emissions in a scenario where all vehicles were replaced by analogous new EURO 5
vehicles for NR2 results). Note that dashed bars (OLD for PHEV40) represent values above 3.
It should be noted that both NR1 and NR2 resulted in the same worst and best vehicle for
each indicator.
Figure 1. Normalised Reference (NR) results.
As can be observed in Figure 1, the new EURO 5 compact vehicles have higher potential
environmental impacts and energy requirements than the Portuguese 2011 fleet for some
indicators (bars above 1). Particularly in NR 1, GICEV and DICEV have higher potential
impacts in EUT than the 2011 fleet because 2011 fleet is mainly constituted by sub-compact
vehicles, which consume less fuel than compact vehicles, and EUT impacts are mostly related
to the upstream processes of the fuel life cycle. The residual number of PHEV, HEV and BEV
may justify the high (relatively to NR) potential impacts in EUT and OLD that result from the
consumption of electricity generated from coal (EUT) and the battery production (OLD).
PHEV40 is the alternative with higher impacts in OLD, due to the constitution of the lithium
iron phosphate battery (LiFePO4). PHEV10 has the same type of battery but it weighs much
less, causing lower OLD impacts. In the use phase, PHEV10 is the alternative with higher
impacts in OE, which may be justified by the combination of a high use of gasoline due to the
low battery capacity, as well as the electricity use. GICEV has more impacts in AD, GW and
nREn when compared with the fleet. These results are influenced by the fact that in the fleet,
4
Ana Rita Domingues1, Pedro Marques2, Rita Garcia2, Fausto Freire2 and Luís Dias1
diesel vehicles have a higher contribution per km travelled (FU) since its VKT (vehicle km
travelled) is higher than for gasoline vehicles.
NR2 results compare each vehicle alternative with the potential impacts of replacing the fleet
with the new EURO 5 vehicles maintaining the respective distribution in the fleet in 2011.
This compares the vehicle alternative with an average new vehicle (where “average” is a
weighted average taking into account the number of vehicles of each type). DICEV’s
potential impacts in NOx are more salient for this NR. This is due to the fleet composition,
mainly constituted by gasoline vehicles (64%), which have significantly lower NOx
emissions.
PHEV40 is the best alternative in AD, GW and nREn, and the worst in OLD. HEV is the best
alternative in EUT. Overall BEV is the alternative with fewer impacts in OLD, PO and all use
phase indicators, but it has more impacts in EUT. If these impacts could be reduced or
mitigated then increasing the proportion of BEV in the fleet would be able to reduce
significantly its environmental impacts and energy requirements.
4 CONCLUSIONS
Normalisation offers a way to inform stakeholders about the relative significance of LCA
results. We used two NR (the average emissions of the 2001 Portuguese fleet and the average
emissions of a renovated fleet considering the new EURO 5 vehicles according to the
distribution of vehicle types in the fleet).The NR are well documented which allows a better
insight understanding of the results. Using two different NR allows presenting different
perspectives in the environmental and energy assessment of the vehicles. Nevertheless, the
results calculated with the two NR show that the relative position of the alternatives did not
change. The results for each vehicle assessed may be different in different regions due to
different electricity mixes and fleet compositions. Also future changes in the Portuguese mix
could introduce different contributions of renewable energy sources in the use phase. In terms
of security of energy supply, BEV is the best alternative because it needs less imported energy
(crude oil) than any other alternative. The consumption of conventional fuels represents an
important cause of environmental impacts.
The work presented in this paper is an example of the comparison of vehicle alternatives that
requires future development after normalisation such as the use of weighting coefficients and
a Multi-Criteria Decision Analysis (MCDA).
ACKNOWLEDGEMENTS
The authors acknowledge the support of Fundação para a Ciência e a Tecnologia (FCT) under
the projects MIT/SET/0014/2009, MIT/MCA/0066/2009, PTDC/SEN-TRA/117251/2010,
PEst-C/EEI/UI0308/2011 and EMSURE (CENTRO 07-0224-FEDER-002004).
REFERENCES
[1]
F. Freire, P. Marques, Electric Vehicles in Portugal : an integrated energy , greenhouse
gas and cost life-cycle analysis, IEEE International Symposium on Sustainable
Systems and Technology (ISSST). (2012) 1 – 6.
5
Ana Rita Domingues1, Pedro Marques2, Rita Garcia2, Fausto Freire2 and Luís Dias1
[2]
[3]
[4]
J. Kim, Y. Yang, J. Bae, S. Suh, The Importance of Normalization References in
Interpreting Life Cycle Assessment Results, Journal of Industrial Ecology. 00 (2012)
1–11.
M. Spielmann, C. Bauer, R. Dones, M. Tuchschmid, Transport Services. ecoinvent
report No.14, Dubendorf, 2007.
N.S. Pearre, W. Kempton, R.L. Guensler, V. V. Elango, Electric vehicles: How much
range is required for a day’s driving?, Transportation Research Part C: Emerging
Technologies. 19 (2011) 1171–1184.
6
Baixar