Academia. Revista Latinoamericana de
Administración
ISSN: 1012-8255
[email protected]
Consejo Latinoamericano de Escuelas de
Administración
Organismo Internacional
de Oliveira Neto, Odilon José; Gallo Garcia, Fabio
The efficiency of the future market for Brazilian live cattle
Academia. Revista Latinoamericana de Administración, vol. 26, núm. 2, mayo-marzo, 2013, pp. 199228
Consejo Latinoamericano de Escuelas de Administración
Bogotá, Organismo Internacional
Available in: http://www.redalyc.org/articulo.oa?id=71629938002
How to cite
Complete issue
More information about this article
Journal's homepage in redalyc.org
Scientific Information System
Network of Scientific Journals from Latin America, the Caribbean, Spain and Portugal
Non-profit academic project, developed under the open access initiative
The current issue and full text archive of this journal is available at
www.emeraldinsight.com/1012-8255.htm
The efficiency of the future
market for Brazilian live cattle
Eficiência do mercado futuro do
boi gordo Brasileiro
Odilon José de Oliveira Neto and Fabio Gallo Garcia
Sa~o Paulo School of Business Administration, Getulio Vargas Foundation,
Sa~o Paulo, Brazil
Future market
for Brazilian
live cattle
199
Received 9 May 2012
Revised 10 March 2013
14 March 2013
Accepted 23 March 2013
Abstract
Purpose – This paper investigates the efficiency of the futures market for Brazilian live cattle to predict
prices in the spot market of Argentinian steers. The lack of derivatives related to the beef market in the
futures exchange in Argentina was the main factor behind the decision to analyse the efficiency of the
Brazilian live cattle futures as a predictor of spot prices of Argentinian steers.
Design/methodology/approach – We opted to employ the efficient markets hypothesis to approach
the question. The hypothesis that futures prices are non-biased predictors of spot prices is considered
to be a true proposition only if the efficient markets hypothesis is not rejected. In methodological
terms, the efficiency of the futures market for Brazilian live cattle relative to the spot market of
Argentinian steers was verified using the Johansen co-integration test. A vector error correction
model – which enables verification of the question of bias in the prediction of prices, was used to
estimate the long-term equilibrium between spot and futures prices.
Findings/originality/value – The results provided no evidence of bias in the prediction of prices and
found the predictive efficiency of the Brazilian live cattle futures market relative to the spot market of
Argentinians steers to be approximately 80 per cent. Thus, the future prices of Brazilian live cattle can
expressly assist participants in the Argentinian beef production chain to predict the spot prices of steers.
Keywords Efficient market hypothesis, Futures market, Live cattle, Steer, Co-integration,
Futures markets, Livestock, Brazil
Paper type Research paper
Resumo
Purpose – Esse trabalho verifica a eficiência do mercado futuro do boi gordo brasileiro em relac¸~ao ao
mercado a vista dos novilhos argentinos. A ausência de derivativos relacionados ao mercado da carne
bovina em bolsa de futuros na Argentina foi o principal aspecto motivador da análise da eficiência do
mercado futuro do boi gordo brasileiro como preditordos prec¸os a vista dos novilhos argentinos.
Design/methodology/approach – Assim sendo, optou-se por uma abordagem à luz da teoria da
hipótese dos mercados eficientes. A hipótese de que os prec¸os futuros s~ao preditores n~ao viesados dos
prec¸os a vista é tida como uma proposic¸~ao verdadeira somente se a hipótese de eficiência de mercado
n~ao for rejeitada. No contexto metodológico, a eficiência do mercado futuro do boi gordo brasileiro
em relac¸~ao ao mercado a vista dos novilhos argentinos foi verificada a partir do teste de cointegrac¸~ao
de Johansen, enquanto que o equilı́brio no longo prazo entre os prec¸os a vista e futuros, que possibilita
a verificac¸~ao da quest~ao do viés na predic¸~ao dos prec¸os, foi estimado por um modelo vetorial de
correc¸~ao de erro.
Findings/Originality/value – Os resultados evidenciaram o n~ao viés na predic¸~ao dos prec¸os e a
eficiência do mercado futuro do boi gordo brasileiro em relac¸~ao ao mercado a vista dos novilhos
argentinos de aproximadamente 80%. Logo, os prec¸os futuros do boi gordo brasileiro podem auxiliar
de maneira expressiva os agentes da cadeia produtiva da carne bovina argentina na predic¸~ao dos
prec¸os a vista dos novilhos.
Palavras-Chave Hipótese do Mercado Eficiente, Mercado Futuro, Boi Gordo, Novilho, Cointegrac¸~ao
Academia Revista Latinoamericana
de Administración
Vol. 26 No. 2, 2013
pp. 199-228
r Emerald Group Publishing Limited
1012-8255
DOI 10.1108/ARLA-06-2013-0065
ARLA
26,2
200
1. Introduction
The wealth generated from agricultural markets and agro industries are very
important to the gross domestic product (GDP) of the economy of several South
American countries. The set of operations and businesses made in this market,
nominated as agribusiness, represents approximately 23 and 32 per cent of the Brazilian
and Argentinean GDP, respectively, both major South American economies. In this
context, the operations and businesses related to the beef market represents around 13
per cent of the agribusinesses GDP in these countries (Centre of Advanced Studies in
Applied Economic (CEPEA), 2011; Ministry of Agriculture, Livestock and Fishing of
Argentina (MAGYP), 2011; United States Department of Agriculture (USDA), 2011).
In 2010, together, Brazil and Argentina were expected to account for around 25
per cent of the contingent of bovine meat worldwide. Brazil, with 185.16 million of
bovines, and Argentina, with 49.05 millions of bovines, hold the first and fourth place
of commercial bovine cattle in the world. During this same period, the annual
production of bovine meat in Brazil and Argentina was of 9.12 and 2.60 millions of
tonnes, which puts them in second and fourth position in the world ranking of bovine
meat production (USDA, 2011).
The exports of Brazilian and Argentinean bovine meat was of 1.56 million and 0.298
million of tonnes of bovine meat in 2010, representing 20.77 and 4 per cent of the world
commodity exports, respectively (Associac¸~ao Brasileira das Indústrias Exportadoras
de Carnes (ABIEC), 2011; MAGYP, 2011; USDA, 2011).
The Argentinean and Brazilian bovine meat markets share some common
characteristics. Among these, it is particularly noticeable that in 2009, of the 87
countries which commercialised bovine meat with refrigerated warehouses installed in
Argentina, 72 also acquired the product from refrigerated warehouses operating in
Brazil, which represents 83 per cent of the common destination for the commodity
export (Instituto de Promoción de la Carne Vacuna Argentina (IPVCA), 2012; Melo, 2010).
Despite the significant economic figures from bovine meat markets, it is important
to highlight the existence of derivative tools negotiated in stock exchange contributing
to the management of price volatility. At present, Australia, Brazil, the USA, have
derivative tools dealt in the stock with the objective of mitigating the price risk
generated from beef cattle spot markets. However, Argentina lacks the derivative
instruments which seek to cover the risk generated by the uncertainties of the bovine
meat spot markets.
In Argentina, different attempts to negotiate future contracts and price index of
bovine meat were thwarted throughout the years, having these derivatives failed
shortly after being launched due to lack of funds.
Relevant studies point out at the factors which led to the short life cycle of future
contracts of bovine meat in Argentina, such as future contracts which did not consider
the common interests of the agents dealing in the productive chain, and incompatibility
of the derivative standard in terms of size, expiration and guarantee margins (Comiso,
2007; Dopchiz, 2008).
The problems faced by the agents of the productive chain of Argentinean bovine
meat, as a result of the lack of derivatives in future markets, is an element which
contributes to increase the research on the efficiency of other markets in managing
price risk. Meanwhile, it is highlighted that the alternative to protection against risk is
only possible when the efficiency market hypothesis (EMH) is not rejected.
In a future efficient market, the future current prices of a contract to deliver a
product in a future date are robust estimators of the spot prices for that same date,
and they incorporate the whole set of data to predict the future price. Therefore, the
ability of spot prices to incorporate the available data are what determines if a market
is efficient or not (Fama, 1970; Moraes et al., 2009).
Therefore, when considering the differences in production and commercialisation of
beef cattle and the peculiarities of the Argentinean and Brazilian bovine meat market,
and the problematic of management of price risk, in particularly the market of
Argentinean bovine meat, the following question is posed: the future prices of live
cattle in the Brazilian Securities, Commodities and Futures Exchange (BM&
FBOVESPA) are unbiased predictors of spot prices of the Argentinean steers on the
contracts expiry date?
In light of all the above, this study aims to verify the efficiency of the Brazilian
future live finished cattle markets in relation of the Argentinean spot market of steers
in the presence of a risk premium.
2. Theoretical foundation
An efficient market is a market where all available information is fully reflected on
the prices so that any changes are only possible after incorporating new information.
As such, in an efficient market, the opportunities of generating earnings through the
information found in the prices are limited. This is the hypothesis defined as the EMH
(Fama, 1970).
Historically, an EMH is divided into three categories, which relate to different types
of information. The test “weak form EMH” verifies if all the incorporated information
to the former prices is reflected in the spot price. Testing the semi-strong form EMH
checks if a set of public available information is found reflected in the spot prices.
The strong form EMH test ascertains if all the available information, public or not, is
integrally reflected on the spot prices and if any investor would obtain higher earnings
(Bodie et al., 2010; Fama, 1970, 1991).
Based on the concept by Fama (1970), in which a EMH is where the prices of the
actives completely reflect the available information, the efficiency of future prices
are tested through the equation: St þ 1 ¼ a þ bFt þ ut þ 1, where, St þ 1 is the spot price of
the period t þ 1; Ft and the future price in the period t ; and ut þ 1 is the independent
error variable and identically distributed with a mean equal to 0 and a constant
variance. The coefficients a and b are constant in an efficient market with values a ¼ 0
and b ¼ 1; and therefore Et(St þ 1Ft) ¼ 0.
In this context, and in order to not reject the weak-form EMH test, the price in the
spot market should not only reflect the set of available information, but also the future
price of the actives on the contract’s expiry date t þ 1 must be an unbiased estimator
of the spot price of the same active in moment t.
According to Fama (1970, 1991), Camargos and Barbosa (2003) and Alves et al.
(2008) some basic suppositions of the EMH test are highlighted: the environment of
perfect occurrence, concordance in terms of expectative of the investors regarding
information and failure to consider the costs of transaction and of information. This is
because, given the market imperfections and the admission of costly and asymmetric
information, the EMH would be rejected because the results are ba1 (Fama, 1970;
Zulauf and Irwin, 1997).
The speed with which agents analyse the available information is an element that
can cause bias in the price, if the processing ability for a few some is higher than
the rest, in this case Et(St þ 1Ft)a0. Considering that possibility account, the EMH
Future market
for Brazilian
live cattle
201
ARLA
26,2
202
as stated by Fama (1970) would allow the existence of a risk premium. The bias in
the price, in this instance, it is noted as aa0, being the value a defined as a risk
compensation (Moraes et al., 2009; Alves et al., 2008; Zulauf and Irwin, 1997;
Fama, 1970).
As such, there are two versions of the EMH according to Fama (1970). A first one
with a ¼ 0 and b ¼ 1, and a second with aa0 and ba1, being the coefficients through
time constant or not. Although the risk premium is controversial for the EMH, its
existence is an empirical, as opposed to a conceptual, issue. Subsequently, in the second
version of EMH, the risk reward does not invalidate the test since it does not depend
on the absence of the latter (Moraes et al., 2009; Zulauf and Irwin, 1997).
The EMH version that results in aa0 and ba1 was also evidenced in the research
conducted by Danthine (1978), who concluded that the presence of risk premiums does
not interfere with the test, since the EMH does not depend on its absence.
Different results for EMH tests are reported in several research works for which
future markets where the main objective, which raised criticism on this subject. While
studies such as the ones conducted by Beck (1994), Pizzi and Just (1998), Acker and
Racine (1999), Chu et al. (1999), Jumah and Martin (1999), Melo et al. (2006), Silva Neto
et al. (2010), Abitante (2008) and Moraes et al. (2009), did not reject the EMH in its weak
form, other studies (Leuthold, 1979; Bressler and Covey, 1991; Lai and Lai, 1991; Alves
et al., 2008) rejected the EMH for the future markets investigated.
Contradicting the studies that strongly rejected the EMH, some research credited
specific elements for the lack of robustness to support it. This is the case of the studies
by Fama and French (1987), Kellard et al. (1999), McKenzie and Holt (2002) and
Kenourgios (2005).
The different results obtained for the EMH test on future agricultural commodities
markets are attributed to factors such as: contract owners, product characteristic,
seasonality, spacing of contracts’ observations, analysis period, institutional factors,
governmental interventions, statistical procedures and econometric techniques of
analysis, among others (Kellard et al., 1999; Newbold et al., 1999). Also, it is
highlighted that conclusions on EMH must be interpreted with caution to the point of
considering the specificities of the agricultural market and the two methods applied
to the research.
The analysis on the capability of future prices in predicting spot prices uses
the different research methods since EMH was first authored. Furthermore, with the
development of co-integration techniques, several studies opted to use these for EHM
testing. The co-integration technique developed by Engle and Granger (1987) was
widely used to analyse the stationarity of the linear combination between financial
series, such as the equilibrium of these in the long term. However, the limitation in the
analysis of the co-integration of two or more series restricts their application
throughout the research on EMH.
The Engle and Granger (1987) technique has been used since first released by these
authors for research involving only two variables, particularly because is easily
applicable. Studies from/by Bressler and Covey (1991), Kellard et al. (1999), Newbold
et al. (1999) and Melo et al. (2006), achieved consistent results for EMH testing by
applying the co-integration technique by Engle and Granger (1987).
The development of a co-integration technique that allows EMH testing with
precision, particularly in instances where the analysis deals with more than two
variables, was first developed by Johansen (1988). The co-integration technique
proposed by Johansen is set out by deriving the maximum-likelihood test and follows
with the estimation of the parameters from the balance ratio between non-seasonal
time series.
The Johansen (1988) co-integration test for the autoregressive vector also allows
verifying the interaction between spot and future prices. The linear and seasonal
combination between non-seasonal variables, required for EMH confirmation, found in
Enders (2004) one of its main supporters.
The Johansen (1988) co-integration test was used for several EMH testing in future
agricultural markets, mainly in view of the parsimony and robustness of the results
obtained from its application. Among these studies, Kenourgios (2005), Abitante (2008),
Alves et al. (2008) and Moraes et al. (2009) are the most relevant.
Since EMH was first developed, studies have been conducted using agricultural
commodities such as: sugar, finished cattle, coffee, ethanol, corn, soy, among others.
All of them included products and markets with similar characteristics, even within
the same territorial range. However, in this study EMH is tested for markets from
different countries, in this instance, future Brazilian markets and the Argentinean spot
markets of beef cuts.
3. Methodology
The present research is characterised as quantitative of the descriptive type. In this
sense, it seeks to establish the relation between cause and effect of the variables aiming
to determine the basis for estimation with the accuracy demanded by the tested
hypothesis.
The time series analysis was applied with the purpose of verifying the dynamic and
temporal structure of the data. Consequently it was evaluated: the linear association,
stationarity, serial autocorrelation and co-integration among the prices. The techniques
of co-integration were applied with the purpose of verifying the existence of a longterm relation between future and spot prices. All the analyses will follow the rigour
demanded by each particular statistical test.
The time series analyses were carried out with Eviews 7.0 software. To structure the
equations the Mathtype 5 software was used. The data processing was aided by using
Microsoft Excel software 2007 version.
3.1 Data and procedures
The daily series of the spot market prices of the Argentinean steer cuts and future
prices of beef cattle in BM&FBOVESPA, used to test the EMH, included the period
between the 2 of January of 2002 and 13 of May of 2011.
The daily quotes referring to the indicators of future beef cattle prices of the
BM&FBOVESPA were obtained from the CEPEA, responsible for the daily
dissemination of daily-adjusted prices of future contracts. The defined indicator,
originally in Brazilian Reales, is also published in American Dollars.
The future contract of live cattle refers to 330 liquid beef (15 kilograms). The
Brazilian live finished cattle is characterised as a male bovine, alive, castrated, with
a convex carcase, with pasture or feedlot feeding, with a weight between 450 and 550
kilograms and maximum age of 42 months (Bolsa de Valores, Mercadorias e Futuros
(BM&FBOVESPA), 2012).
The daily quotations of current Argentinean steers prices were obtained from the
MAGYP and refer to the spot prices used in the Liniers Markets S.A, which is the most
important Bovine spot transaction centre in Argentina. The prices of Argentinean
Future market
for Brazilian
live cattle
203
ARLA
26,2
204
steers are counted by kilogram/live weight, and the reference currency is the
Argentinean peso.
The Argentinean young steer is a male bovine, young, alive, castrated, presenting
between two and four definitive incisor teeth, with a rectilinear carcase, fed on
pasture or feedlot, with a weight between 300 and 430 kilograms and an age of
around 30 months. As such the adult Argentinean steer differs by having a minimum
of six permanent incisor teeth, conformed to a carcase between sub-convex and
convex, weight between 431 and 520 kilograms and ages between 30 and 42 months
(MAGYP, 2011).
The spot prices of Argentinean steers were transformed into dollars according to
the daily quotes of the Argentinean Republic Central Bank, and immediately
transformed in liquid arrobas, considering the equivalent profiting of 50 per cent of
the carcass.
The presence of days without price quotes and the illegitimated outliers were
deleted from the sample. Subsequently, a series of prices were logged in order to
remove exponential tendencies and validate the linear association. There procedures
follow the patterns of EMH testing with the application of co-integration
techniques.
3.2 Hypothesis and statistical tests
The present study verified the hypothesis that future prices, on the due date of the
future contract of the beef livestock of the BM&FBOVESPA, were unbiased predictors
of the spot prices for the Argentinean steers cuts. To verify the efficiency of future
markets, statistical stationary tests to assert the integrative order and the
co-integration tests where sequentially applied.
The market efficiency testing demands that the variables, spot and future prices, to
be co-integrated in the same order. Therefore, the series of prices must have a unit root,
that is, they must not be seasonal.
From a wider perspective, the co-integration relation is taken as long-term balance
phenomena, therefore, although these variables deviate from their relation in the short
term, these associations will be retaken in the long term.
From these two tests of unitary roots of Augmented Dickey and Fuller (1981) and
Phillips and Perron (1988), know as ADF and Phillips-Perron, respectively, it was
possible to identify with higher accuracy if the series were integrated in the same order,
as I(1). The Phillips-Perron and ADF stationary tests verify if the null and alternative
hypothesis: H0: ytBI(1) and H1: ytBI(0).
Although needed, the same order of integration does not mean necessarily that the
series are co-integrated; therefore, it was opted to apply the Johansen (1988) and
Johansen and Juselius (1990) trace test to verify the linear combinations type I(0). This
test allows investigate the existence of long-term balance between the spot and future
prices, essential conditions for EMH acceptance.
Johansen’s (1988) methodology takes its starting point in the vector autoregression
(VAR) of order p given by, yt ¼ A1yt1 þ y þ Apytp þ et, where yt, is an n 1 vector
of variables that are integrated of order one, I(1). In this case, the previous equation can
be re written as:
p1
Y
X
yt1 þ . . . þ
Gyt1 þ et
ð1Þ
Dyt ¼ m þ
i¼1
where:
Y
¼
p
X
Ai 1 and G ¼ i¼1
p
X
Aj
ð2Þ
j¼iþ1
Q
If the coefficient matrix
has a reduced
rank Q
ron, then there exist r n matrices
Q
a and b each with rank r such that
¼ ab and
¼ byt is stationary. r is the number
of co-integrating relationships, the elements of a are known as the adjustment
parameters in the vector error correction (VEC) model and each column of b is a
co-integrating vector.
It can be shown that for a given r, the maximum likelihood estimator b matrix
defines the combination of yt1 that yields the r largest canonical correlation[1] of Dyt
with yt1, after correcting for lagged differences and deterministic variables when
present.
The significance of the likelihood ratio tests of the canonical correlations were
obtained from the trace test, according to the following equation:
ltraco̧ ¼ T
n
X
lnð1 ^lt Þ
ð3Þ
i¼rþ1
where T is the sample size, and l# r þ 1 is i-estimator largest canonical correlation. The
trace test tests the null hypothesis of the number of co-integrating vectors are less or
equal to r, against the alternative hypothesis that the number of co-integrating vectors
are higher than r. The hypotheses, null or alternative, of the co-integrating trace test
are the following:
H0. r ¼ 0, there is no co-integrating.
H1. rX1, there is co-integrating.
A significance level of 5 per cent to reject or not the hypothesis was used. The
asymptotic critical values of the test can be found in Johansen and Juselius (1990) and
are also given by most econometric software packages, such as Eviews 7.0, used in
the empirical tests of the present study. However, it is noted that Eviews 7.0 uses the
critical values of Mackinnon (1996) to test stationarity of the residuals considering the
co-integrating. To test if the residual derived from the model estimations are auto
correlated, the d of Durbin and Watson (1951) statistical test was applied.
If the prices cannot be co-integrated and only show a short-term relation, they have
to be modelled on a bivariate VAR structure making the following equation:
DSt ¼ cs þ
DFt ¼ cf þ
k
X
bsi DSti þ
k
X
i¼1
i¼1
k
X
k
X
i¼1
bfi DSti þ
bsi DFti þ mst
ð4Þ
bfi DFti þ mft
i¼1
where c is the e intercept and, bsi and bfi are positive parameters. mst and mft are random
independent vectors and identically distributed (i.d.d.). The use of the model means
Future market
for Brazilian
live cattle
205
ARLA
26,2
206
deciding which one is the lagged component, k, optimal, or which one starts with a
value of one and increases one lag to each integration until the residual correlation will
be eliminated from the equation system.
However, when knowing that the series are co-integrated according to what Lien
and Luo (1993) showed, it is chosen to estimate a model with error correction, which
takes into account the long-term equilibrium between the movement of spot and future
prices, and allows to verify the bias issue on the price predictions. Therefore, the
system Equations (4) of the VAR structure was transformed into a rigourous bivariate
autoregressive VEC according to the following equation:
DSt ¼ cs þ
DFt ¼ cf þ
k
X
bsi DSti þ
k
X
i¼1
i¼1
k
X
k
X
i¼1
bfi DSti þ
bsi DFti þ gs Zt1 þ mst
ð5Þ
bfi DFti gf Zt1 þ mft
i¼1
where gs and gf are positive parameters and Zt1 is the error correction term which
measures how the dependent variable is adjusted to the deviations of the previous
periods promoted by the equilibrium in the long term, as specified in the following
equation:
ð6Þ
Zt1 ¼ a bFt þ St1
That can be transformed into the following equation:
St1 ¼ a þ bFt þ Zt1
ð7Þ
where a is a constant and b is a co-integration vector. These two variables of the error
correction model, shown in the Equations (5), correspond to the VAR(k) model in
the first differences, increased in the error correction term gsZt1 and gfZt1. The
coefficient gs and gf are interpreted as adjustment speeds. The higher gs, the higher the
result of St to the previous deviances, due to the long-term equilibrium.
As such, regarding the EMH, the market price must reflect the available
information, meaning, Ft of the future contracts in time t þ 1 is an unbiased estimator
of the spot prices in the futures, St þ 1, according to the following equation:
St1 ¼ a þ bFt þ ut1
ð8Þ
The null and alternative hypotheses, for the efficiency of future Brazilian live finished
cattle market in relation to the Argentinean spot market of steers, tested in the study
are the following:
H0.
aa0 and ba1 with (bp0), the market is inefficient.
H1A. a ¼ 0 and b ¼ 1 the market is efficient and there is no existence of risk
premium.
H1B. aa0 and ba1 com (0obo1), the market is efficient, with the presence of risk
premium. In this case the degree of efficiency varies between 0 and 1.
The relaxing of the H1A for a H1B, referring to EMH, is due to the relation between
spot prices and future products with similar characteristics, but not identical.
From the verification of the statistical parameters obtained by applying the
Johansen’s (1988) co-integration test and Johansen and Juselius (1990) and the use
of the VEC model it was possible to test, respectively, the EMH and the issue of bias in
the price prediction of this study.
4. Presentation and analysis of the results
The behaviour of the spot prices of Argentinean young and adult steers and future
prices of the Brazilian live finished cattle logarithms, are presented in Figure 1. The
movement of the price series is quite similar, however, the future prices are generally
found to be slightly higher than the spot prices. Clear differences between future and
spot prices are evident in the first semester of 2002 and between the years 2007 and
2009.
It is suggested that the difference of the spot prices in the 2002, in relation to the
future prices shown in Figure 1, are mainly due to the devaluation in currency
exchange of the Argentinean currency. On the other side, it shows that the distancing
of the prices between 2007 and 2009, coincides with the numerous governmental
interventions in the markets of Argentinean beef meat during this periods, such as:
increase in the export taxes, weight restriction in the animal abattoir, export
prohibitions, limitation in the export quotes for the Hilton export quota for 180 days.
However, although other important studies such as Melo (2010), also credit the price
reduction of Argentinean beef, between 2007 and 2009, to those events, they did not
find enough robust information that could support this affirmation.
In Figure 1, it is possible to verify association traces and joint stochastic tendencies
between spot and future prices. As such with co-integrated indexes between the prices
Future market
for Brazilian
live cattle
207
2.0
1.8
1.6
1.4
1.2
1.0
0.8
2002 2003 2004 2005 2006 2007 2008 2009 2010
Log future prices Brazilian live cattle
Log spot prices Argentinian adult steers
Log spot prices Argentinian young steers
Source: Research Data
Figure 1.
Future prices of live cattle
and spot prices of steers
ARLA
26,2
208
series, to carry an econometric test is essential in order to have a more accurate
analyses and conclusions in this regard.
To begin the analysis process of the association between the study variables, Table I
shows the linear association between the spot and future price series.
According to the results of Table I, it can be ascertained that the future prices of
Brazilian live finished cattle and spot prices of Argentinean steers are strongly and
positively associated with 86.43 per cent at a 1 per cent significance level. However
the positive association between the Brazilian live finished cattle and spot prices
of the Argentinean adult steer cattle is even stronger, reaching the 87.67 per cent with
a 1 per cent statistical significance Although these results are not conclusive in
co-handling of prices, they point out a possible relation between the studied variables
and therefore are indicators of mix between the long-term prices. The verification of
the relation between the variables follows the unit root detection test.
The Philips-Perron and the increased ADF unit root test where used applying a
series of spot and future prices with the objective of determining the presence or not
of unitary roots and as a premise for the co-integration tests. The results are shown
in Table II.
Based on the results of Table II, the tests do not reject the null hypothesis in the
presence of unit root in the temporal series of the levelled spot and future prices.
However, the tests in the first difference reject the null hypothesis, therefore there is an
indication that the series of spot and future prices are integrated in one order, I(1). The
DW statistics, with values close to two, indicate that the spot and future price series, in
the first difference, do not present issues of autocorrelation.
The optimal number of lagging in the two estimating tests of co-integration was the
first step to estimate the model by incorporating information of the long-term effects.
The dimension of the estimated model is the parsimony of the co-integration regression
being the elements involved in this decision.
The Akaike (AIC), Schwarz (SBC) and Hanna-Quinn (HQC) information criteria,
have as a characteristic to penalise the increase of new lagging of the VAR models.
These were used to define the optimal number of lags. Table III present the optimal
number of lagging of the estimation of co-integration tests according to the
information criteria.
According to the results of Table III, the optimal number of lags of the
co-integration tests between the spot prices of the young and adult Argentinean steers
and future prices of live finished cattle by the SBC criteria is equal to three. Although
two criteria AIC and HQC established an ideal lag number equal to seven, due to the
parsimony principle, the robustness and the respective definition of information SBC
criteria were respected by three lagged, alias the VAR model (3).
Price series
Table I.
Linear association
between spot prices
of Argentinian steers and
future prices of Brazilian
live cattle in the
BM&FBOVESPA
Brazilian live cattle
Argentinian young steer
Argentinian adult steer
Brazilian live cattle
Argentinian young steer
Argentinian adult steer
1.0000*
0.8643*
1.0000*
0.8767*
0.9941*
1.0000*
Note: *Significance level of 1 per cent
Source: Data of the research
5.52935
5.52654
5.52832
2.54698
In level
1.06107
0.9250ns
5.63234
5.61824
5.62716
2.01182
7.46253
7.45971
7.46149
2.00679
1st difference
28.34031
0.0000*
7.46744
7.46181
7.46537
1.99796
Notes: ns, does not show statistical significance. *Significant level at 1 per cent
Source: Research Data
In level
1.13498
0.9342ns
5.60634
5.60353
5.60531
2.03233
2,56613
1,94098
1,61659
5.63278
5.6215
5.62864
2.01156
In level
28.54646
0.0000*
2.56613
1.94098
1.61659
1st difference
63.47617
0.00010*
Argentinian young steer
1st difference
42.37027
0.00010*
Brazilian live cattle
Phillips and Perron test (PP)
Test PP
In level
t-statistics
1.68307
p-value (t)
0.9780ns
Critical values
Level 1%
Level 5%
Level 10%
AIC
7.46154
SBC
7.45872
HQC
7.4605
DW
1.88847
Augmented teste Dickey-Fuller (ADF)
Test ADF
In level
t-statistics
1.68854
p-value (t)
0.9783ns
Critical values
Level 1%
Level 5%
Level 10%
AIC
7.46787
SBC
7.45942
HQC
7.46477
DW
1.99774
Time series
5.35592
5.34464
5.35178
2.0122
1st difference
0.79492
0.8843ns
5.22778
5.22496
5.22675
2.63557
In level
1.1366
0.9344ns
5.35661
5.34815
5.3535
2.01207
In level
32.49301
0.0000*
5.33436
5.33154
5.33332
2.07406
1st difference
72.88902
0.00010*
Argentinian adult steer
Future market
for Brazilian
live cattle
209
Table II.
Root unitary tests
of the spot and future
price series
ARLA
26,2
Number
of lags
210
Table III.
Test of detecting the
optimal number of lags
of co-integration tests
0
1
2
3
4
5
6
7
Argentinian young steer
spot prices and future prices
Argentinian adult steer spot prices
and future prices
Information criteria
Information criteria
AIC
2,742,109
1,273,362
1,284,898
1,286,871
1,287,325
1,287,640
1,287,953
1,288,624a
SBC
2,736,452
1,271.665
1,282.069
1,282,911a
1,282,234
1,281,417
1,280,599
1,280,139
HQC
2,740,031
1,272.739
1,283.859
1,285.416
1,285.455
1,285.354
1,285.251
1,285,506a
AIC
2,742,109
1,273.362
1,284.898
1,286.871
1,287.325
1,287.640
1,287.953
1,288,624a
SBC
2,736,452
1,271.665
1,282.069
12,82,911a
1,282.234
1,281.417
1,280.599
1,280,139
HQC
2,740,031
1,272,739
1,283,859
1,285,416
1,285,455
1,285,354
1,285,251
1,285,506a
Note: aOptimal number of lags according to the different information criteria
Source: Data of the research
The existence of co-integration between the spot and future prices were verified by the
Johansen (1988) trace test and Johansen and Juselius (1990), as it can be seen in Table IV.
The results of the test on Table IV, reject the null hypothesis of not having no
co-integration vector, with a 5 per cent statistical significance. As such, although
the co-integration is an essential condition to test market efficiency, it is of fundamental
importance to validate if the future prices are unbiased estimators of spot prices.
In view of all this, the evidences of market efficiency or not and the unbiased
estimates of the prices in the long term were analysed with the vector equations of
co-integration and two VEC estimator models, as it can be observed in Tables V and VI.
Starting from the VAR model (3) two logarithms of spot and future prices, the VEC
models (2) were estimated with an inclusion of two error correction terms. This is
because the properties of the third lagging of the levelled models were found to be
included in the second lagging of the first difference. In Table V the regression
coefficient of the vectors of co-integration between spot and future prices are presented.
The b coefficient of the first regression of the co-integration vector in Table V
determines that, in the long term, the rising of future prices in Brazilian live finished
cattle has a 1 per cent concomitant transaction of approximately, 0.81 per cent of the
spot price of Argentinean young steers in the spot market. The equilibrium in the long
term between spot prices of Argentinean young steers and future prices of Brazilian
Co-integration
test
Number of
co-integration
vectors
Table IV.
Trace tests to verify the
co-integration between the
spot and future prices
¼ 0a
p1
Argentinian young steer spot
Argentinian adult steer spot
prices and future prices
prices and future prices
Trace
Trace
Critical value
Critical value
Eigenvalue ltrac¸o
(5%)
p-value Eigenvalue ltrac¸o
(5%)
p-value
0.00855 27.73047
0.00538 10.69583
25.87211
12.51798
0.02910
0.09890
Note: aMark the rejection of hypothesis at 5 per cent level
Source: Research Data
0.00763
0.00551
26.14387
10.95745
25.87211
12.51798
0.04630
0.08990
Co-integration vector
Constant
b
SE
t-statistic
Hypothesis testing
Young steer
Adult steer
0.255387
0.812112*
0.12139
6,69023
Reject H0
Reject H1A
Does not reject H1B
0.307886
0.746209*
0.11871
6,28603
Reject H0
Reject H1A
Does not reject H1B
Notes: (H1B) aa0 and ba1 with (0obo1), the efficient markets with a presence of risk premium.
*Significant level of 5 per cent
Source: Research Data
VEC model
Constant
Zt1
DSt1
DFt1
DSt2
DFt2
DCR
Log likelihood
AIC
SBC
Young steer
Future market
for Brazilian
live cattle
211
Table V.
Co-integration equation
between spot prices
and future prices
Adult steer
0.000280 (0.85562)
0.009129 (2.21422)
0.287047 (12.7675)
0.022090 (0.30844)
0.017412 (3.15060)
0.084631 (1.49863)
7.06E09
13000.71
13.08485
13.04540
0.000272 (0.72755)
0.011361 (2.43142)
0.350613 (15.6080)
0.033710 (0.52268)
0.115728 (5.18050)
0.075580 (1.17156)
Table VI.
9.20E09
Coefficients
of
the
VEC (2)
12,737.97
model with the inclusion
12.82012
of the error correction
12.78067
mechanisms for
spot prices of the
Notes: t-statistic is present in parentheses. DCR, Determinant of the residual covariance
Argentinian steers
Source: Research data
live finished cattle, according to the first equation of co-integration vectors of Table V,
is 81.21 per cent efficient.
On the other hand, the b coefficient of the second regression of co-integration
vectors in Table V indicates that, in the long term, a future price increase in Brazilian
live finished cattle with a 1 per cent concomitant transaction of around 0.75 per cent
of the price of the Argentinean adult steers in the spot market. The equation of
co-integration vector in Table V shows the presence of risk premiums. The equilibrium
in the long term between spot prices of adult Argentinean steers and future prices
of Brazilian live finished cattle, according to the co-integration equation of Table VI is
74.62 per cent efficient.
When the equation of the co-integration vectors in Table V and the models VEC (2)
in Table VI were analysed, the lagged error terms were detected Zt, of the
co-integration regressions. Based on Equation (8), these are different from zero with
5 per cent significance level.
The number of coefficient of the VEC model (2) estimates, with significance at 1 and
5 per cent make the statistical values t presented in brackets on Table VI corroborate
the results of this trace for co-integration between spot and future prices presented
in Table IV. As such, the conclusions on the hypothesis of efficient markets continue
to be valid.
ARLA
26,2
212
5. Conclusions
The objective of this paper was to verity the efficiency of future market of Brazilian live
finished cattle in BM&FBOVESPA, as a predictor of the prices of steer cuts in the
Argentinean spot market in the presence of risk premiums.
Initially, a strong positive linear association higher than 85 per cent was found
between the spot and future markets. Subsequently for the unit root test, it was found
in the first difference, that the prices are seasonal, hence integrated in order one.
The result of the trace test indicates the presence of the co-integration vector
between the spot prices of Argentinean steers and future prices of the Brazilian live
finished cattle. The application of the error correction model, VEC, allows to test for the
EMH with the presence of premium risk. The results showed that the risk premium
does not cause the rejection of the hypothesis of unbiased future prices.
The results show that for a market efficiency in the long term between the spot
prices of Argentinean young steers and future prices of Brazilian live finished cattle of
approximately of 81 per cent. In regards to the market efficiency in the long term
between the spot prices of Argentinean adult steers and future prices of Brazilian live
finished cattle, is around 75 per cent. These results suggest that the future beef cattle
prices can significantly help to predict spot prices of Argentinean steers.
Therefore, in can be stated based on the results of the co-integration tests and
unbiased on the prices, that the future markets of Brazilian live finished cattle is
efficient, and in the long term the future prices of beef are unbiased estimates of the
spot prices of Argentinean steers.
The results obtained in this study contrast with the ones found by Bressler and
Covey (1991), McKenzie and Holt (2002) and Alves et al. (2008). Although it
corroborates the research of Kellard et al. (1999), Melo et al. (2006), Abitante (2008) and
Moraes et al. (2009).
The results found in the different EMH tests for future agricultural markets are
credited to diverse factors, specifically the analysis period, seasonality, governmental
intervention and institutional structures. In this context, the differences among the
products, the spot market and the pattern of the derivatives of the future markets in
regards to this study contribute to the research of different perspective of the EMH.
Therefore, the maturity of the future market of the live finished cattle, added to the
growth of the participation of different agents of the productive chain of the bovine
meat, is an indicative, of the future contracts of the live finished cattle of the
BM&FBOVESPA. These tend to be used more every time as a protection tool against
the price changes in the spot market, not only by agents that act on the Brazilian
bovine market, but also in other market. It already happens in a significant volume
with other commodities, in other stocks as for examples soy and its derivatives in the
Chicago Board of Trade.
The great number of methods that can be used to test the EMH allows that different
researches on the relation between markets with similar characteristics as this study to
be made, especially, within the context of comparing the efficiency between the
derivatives of different stocks to mitigate the risk of agricultural price commodities of
countries that lack or do not have these tools available.
~o
1. Introduc¸a
As riquezas geradas pelos mercados agrı́colas e agroindustriais s~ao muito importantes
para a composic¸~ao do produto interno bruto (PIB) da economia de diversos paı́ses da
América do Sul. O conjunto de operac¸ões e negócios realizados neste mercado,
denominado agronegócio, representa, aproximadamente, 23% e 32% do PIB do Brasil
e da Argentina, respectivamente, maiores economias sul-americanas. Neste contexto,
as operac¸ões e negócios relacionados ao mercado da carne bovina representam cerca de
13% do PIB do agronegócio nesses paı́ses (CEPEA, 2011; MAGYP, 2011; USDA, 2011).
Em 2010, juntos, Brasil e Argentina responderam por algo perto de 25% do
contingente de bovinos de corte no mundo. O Brasil, com 185,16 milhões de bovinos e a
Argentina, com 49,05 milhões de bovinos, ocupam a primeira e a quarta colocac¸~ao em
rebanho bovino comercial no mundo. Neste mesmo perı́odo, a produc¸~ao anual de carne
bovina no Brasil e na Argentina foi de 9,12 e 2,60 milhões de toneladas, o que os coloca
na segunda e quarta posic¸ões no ranking mundial em produc¸~ao de carne bovina
(USDA, 2011).
As exportac¸ões de carne bovina brasileira e argentina foram de 1,56 milhões e 298
mil toneladas de carne bovina em 2010, representando, respectivamente, 20,77% e 4%
das exportac¸ões mundiais da commodity (ABIEC, 2011; MAGYP, 2011; USDA, 2011).
O mercado da carne bovina brasileira e argentina apresenta algumas caracterı́sticas
em comum, dentre estas, salienta-se que em 2009, dos 87 paı́ses que comercializaram
carne bovina com frigorı́ficos instalados na Argentina, 72 também adquiriram o
produto de frigorı́ficos atuantes no Brasil, o que representa 83% de destino comum
para exportac¸~ao da commodity (IPVCA, 2012; Melo, 2010).
Apesar dos números significativos do mercado da carne bovina, ressalta-se a
importância da existência de instrumentos derivativos negociados em bolsa
organizada que propiciem o gerenciamento da volatilidade dos prec¸os. Austrália,
Brasil, Estados Unidos da América (EUA), atualmente, contam com instrumentos
derivativos negociados em bolsa com objetivo de mitigar os riscos de prec¸os do
mercado a vista de bovinos de corte. Porém, a Argentina carece de instrumentos
derivativos que objetivem a cobertura do risco gerada pelas incertezas do mercado a
vista da carne bovina.
Na Argentina, diversas tentativas de negociac¸~ao de contratos futuros e de ı́ndice de
prec¸os de carne bovina foram frustradas ao longo dos anos, sendo estes derivativos
lanc¸ados e em um curto espac¸o de tempo fracassados por falta de liquidez.
Importantes estudos apontam para elementos que levaram ao curto ciclo de vida
dos contratos futuros de carne bovina na Argentina, como contratos futuros que n~ao
atendiam a interesses comuns dos agentes da cadeia produtiva, e incompatibilidade
dos padrões dos derivativos em termos de tamanho, vencimento e margens de garantia
(Comiso, 2007; Dopchiz, 2008).
O problema enfrentado pelos agentes da cadeia produtiva da carne bovina
argentina, decorrente da carência de derivativos em mercados futuros, é um elemento
que colabora para que se realise a investigac¸~ao sobre a eficiência de outro mercado
na administrac¸~ao do risco de prec¸os. No entanto, ressalta-se que a alternativa de
protec¸~ao contra o risco só é possı́vel quando n~ao se rejeita a hipótese do mercado
eficiente (HME).
Em um mercado futuro eficiente, os prec¸os futuros correntes de um contrato para
entrega de um produto em uma data futura s~ao estimadores robustos dos prec¸os à vista
para essa mesma data, e incorporam todo o conjunto de informac¸ões para prever o
prec¸o futuro. Logo, a capacidade dos prec¸os a vista em incorporar as informac¸ões
disponı́veis é que determina se um mercado é ou n~ao eficiente (Fama, 1970; Moraes
et al., 2009).
Portanto, ao considerar as diferenc¸as da produc¸~ao e comercializac¸~ao de bovinos
de corte e as particularidades do mercado da carne bovina brasileira e argentina, e a
Future market
for Brazilian
live cattle
213
ARLA
26,2
214
problemática no gerenciamento dos prec¸os, em especial, a enfrentada na bovinocultura
de corte e mercado da carne bovina argentina, é que emerge a quest~ao: os prec¸os
futuros do boi gordo na Bolsa de Valores, Mercadorias e Futuros – S~ao Paulo/Brasil
(BM&FBOVESPA) s~ao preditores n~ao viesados dos prec¸os a vista dos novilhos de corte
argentinos na data do vencimento dos contratos?
Assim sendo, este estudo tem por objetivo verificar a eficiência do mercado futuro
do boi gordo brasileiro em relac¸~ao ao mercado a vista argentino de novilhos de corte na
presenc¸a de prêmio ao risco.
~o teórica
2. Fundamentac¸a
Um mercado eficiente é aquele em que as informac¸ões disponı́veis encontram-se
totalmente refletidas nos prec¸os e quaisquer mudanc¸as que venham a ocorrer só s~ao
possı́veis pela incorporac¸~ao de novas informac¸ões. Desta forma, em um mercado
eficiente, as oportunidades de gerac¸~ao de lucros por meio do conteúdo informacional
inserido nos prec¸os s~ao limitadas. Esta é a denominada hipótese do mercado eficiente
(HME) (Fama, 1970).
Historicamente, a HME se divide em três categorias, sendo estas relacionadas
a tipos distintos de informac¸ões. O teste da forma fraca da HME verifica se
todas as informac¸ões incorporadas aos prec¸os anteriores encontram-se refletidas
no prec¸o a vista. O teste da forma semiforte da HME constata se o conjunto
de informac¸ões publicamente disponı́veis encontra-se refletida nos prec¸os a vista.
Já o teste da forma forte da HME, apura se todas as informac¸ões, publicamente
ou n~ao, disponı́veis, encontram-se integralmente refletidas nos prec¸os a vista
e se qualquer investidor conseguiria obter lucros superiores (Bodie et al., 2010;
Fama, 1991, 1970).
Baseando-se na concepc¸~ao de Fama (1970), de que a HME é aquela em que os prec¸os
dos ativos refletem completamente as informac¸ões disponı́veis, a eficiência dos prec¸os
futuros vem sendo testada por meio da equac¸~ao: St þ 1 ¼ a þ bFt þ ut þ 1, onde, St þ 1 é o
prec¸o a vista no perı́odo t þ 1; Ft é o prec¸o futuro no perı́odo t; e ut þ 1 é o termo de erro
independente e identicamente distribuı́do com média igual a zero e variância constante;
os coeficientes a e b s~ao constantes de um mercado eficiente com valores a ¼ 0 e b ¼ 1;
e, portanto, Et(St þ 1Ft) ¼ 0.
Nesse contexto, para n~ao rejeitar o teste da HME na forma fraca, o prec¸o no mercado
a vista n~ao só deve refletir o conjunto de informac¸ões disponı́veis, como também o
prec¸o futuro do ativo na data de vencimento do contrato t þ 1 deve ser um estimador
n~ao viesado do prec¸o a vista deste mesmo ativo no momento t.
Fundamentado em Fama (1991, 1970), Camargos and Barbosa (2003) e Alves et al.
(2008) chamam a atenc¸~ao para alguns pressupostos elementares do teste da HME, s~ao
eles: o ambiente de concorrência perfeita, concordância em termos das expectativas dos
investidores sobre as informac¸ões e a n~ao considerac¸~ao dos custos de transac¸~ao e de
informac¸~ao. Isto porque, dadas as imperfeic¸ões do mercado e a admiss~ao de
informac¸ões custosas e assimétricas, a HME seria rejeitada, uma vez que o resultado
seria ba1 (Fama, 1970; Zulauf and Irwin, 1997).
A velocidade dos agentes em analisar as informac¸ões disponı́veis é um elemento que
pode gerar viés no prec¸o, caso a capacidade de processamento de uns seja superior a dos
demais, neste caso, Et(St þ 1Ft)a0. Considerando esta possibilidade, a HME de Fama
(1970) permitiria a existência de um prêmio pelo risco. O viés no prec¸o, neste caso,
é denotado como aa0, sendo o valor a definido como a compensac¸~ao pelo risco (Moraes
et al., 2009; Alves et al., 2008; Zulauf and Irwin, 1997; Fama, 1970).
Dessa forma, existiriam duas versões para a HME de Fama (1970), a primeira com
a ¼ 0e b ¼ 1 e, a segunda com aa0e ba1, sendo os coeficientes constantes ou n~ao no
tempo. Apesar do prêmio ao risco ser controverso para a HME, a existência deste é uma
quest~ao empı́rica e n~ao conceitual. Logo, na segunda vers~ao da HME, o prêmio ao risco
n~ao invalida o teste, visto que ele n~ao depende da ausência deste (Moraes et al., 2009;
Zulauf and Irwin, 1997).
A vers~ao da HME que resulta em aa0 e ba1 foi também evidenciada na
investigac¸~ao de Danthine (1978), que concluı́ram que a presenc¸a do prêmio ao risco n~ao
interfere no teste, já que a HME n~ao depende da ausência deste.
Resultados distintos sobre os testes da HME est~ao presentes em várias
investigac¸ões que tem como objeto os mercados futuros, o que fomenta crı́ticas
a seu respeito. Enquanto estudos como os de Beck (1994), Pizzi and Just (1998), Acker
and Racine (1999), Chu et al. (1999), Jumah and Martin (1999), Melo et al. (2006), Silva
Neto et al. (2010), Abitante (2008) e Moraes et al. (2009), n~ao rejeitaram a HME na forma
fraca, outros, como os de Leuthold (1979) e Bressler and Covey (1991), Lai and Lai
(1991), e, Alves et al. (2008), rejeitaram a HME para os mercados futuros investigados.
Contrariando os estudos que se definem pela forte rejeic¸~ao da HME, algumas
investigac¸ões creditam a elementos especı́ficos a falta de robustez para suportá-la.
Essa situac¸~ao é evidenciada nos estudos de Fama and French (1987), Kellard et al.
(1999), McKenzie and Holt (2002), e Kenourgios (2005).
Os resultados diferentes para os testes da HME em mercados futuros de
commodities agrı́colas s~ao atribuı́dos a fatores como: padrões dos contratos,
caracterı́sticas dos produtos, sazonalidade, espac¸amento das observac¸ões de
contratos, perı́odo de análise, fatores institucionais, intervenc¸ões governamentais,
procedimentos estatı́sticos e técnicas econométricas de análise, entre outros
(Kellard et al., 1999; Newbold et al., 1999). Logo, destaca-se que as conclusões sobre
a HME devem ser cautelosas a ponto de considerarem as especificidades do mercado
agrı́cola e dos métodos aplicados à investigac¸~ao.
A análise sobre a capacidade dos prec¸os futuros na de predic¸~ao dos prec¸os a vista
utiliza-se de diferentes métodos de investigac¸~ao desde a origem da HME. Todavia, com
o desenvolvimento das técnicas de cointegrac¸~ao, vários estudos optaram pelo seu uso
para testá-la. A técnica de cointegrac¸~ao desenvolvida por Engle and Granger (1987)
foi amplamente usada para analisar a estacionariedade da combinac¸~ao linear entre
séries financeiras, assim como o equilı́brio destas no longo prazo. Porém a limitac¸~ao em
analisar a cointegrac¸~ao de mais de duas séries restringiu sua aplicac¸~ao ao longo da
pesquisa sobre a HME.
A técnica de Engle and Granger (1987) vem sendo utilizada desde ent~ao para
investigac¸ões que envolvam apenas duas variáveis, em especial, em raz~ao de sua
facilidade de aplicac¸~ao. Estudos de Bressler and Covey (1991); Kellard et al. (1999);
Newbold et al. (1999), e Melo et al. (2006), alcanc¸aram resultados consistentes para os
testes da HME pela aplicac¸~ao da técnica de cointegrac¸~ao de Engle and Granger (1987).
O desenvolvimento de uma técnica de cointegrac¸~ao que permitisse testar a HME
com precis~ao, mesmo em situac¸ões em que a análise envolve mais de duas variáveis,
teve Johansen (1988) como um dos precursores. A técnica de cointegrac¸~ao proposta por
Johansen parte da derivac¸~ao do teste pelo método de máxima-verossimilhanc¸a e segue
com a estimac¸~ao dos parâmetros da relac¸~ao de equilı́brio entre as séries n~ao
estacionárias.
O teste de cointegrac¸~ao de Johansen (1988) pelo vetor autorregressivo permite ainda
a verificac¸~ao das interac¸ões entre prec¸os a vista e futuros. A combinac¸~ao linear e
Future market
for Brazilian
live cattle
215
ARLA
26,2
216
estacionária entre variáveis n~ao estacionárias, exigida para confirmac¸~ao da HME,
tem Enders (2004) como um dos principais defensores.
O teste de cointegrac¸~ao de Johansen (1988) foi usado em diversos testes da HME
em mercados futuros agrı́colas, principalmente em vista da parcimônia e robustez dos
resultados conseguidos pela sua aplicac¸~ao; dentre estes estudos, destacam-se
Kenourgios (2005), Abitante (2008), Alves et al. (2008), Moraes et al. (2009), e entre outros.
Desde o surgimento da HME, estudos têm sido realizados com commodities
agrı́colas, como: ac¸úcar, boi gordo, café, etanol, milho, soja, entre outras, todos
envolvendo produtos e mercados com caracterı́sticas muito semelhantes, inclusive com
a mesma abrangência territorial. Porém, testa-se neste estudo a HME para mercados de
diferentes paı́ses, neste caso, o mercado futuro brasileiro e o mercado a vista argentino,
de bovinos de corte.
3. Metodologia
A presente pesquisa caracteriza-se como quantitativa do tipo descritiva. Neste sentido,
buscou-se estabelecer a relac¸~ao entre causa e efeito das variáveis visando determinar
uma base de estimac¸~ao com rigor exigido pelos testes de hipóteses.
A análise de séries temporais foi aplicada com propósito de verificar as dinâmicas e
estruturas temporais dos dados. Em seguida foram avaliadas: a associac¸~ao linear,
estacionariedade, autocorrelac¸~ao serial e cointegrac¸~ao entre os prec¸os. As técnicas de
cointegrac¸~ao s~ao aplicadas visando verificar a existência do relacionamento de longo
prazo entre os prec¸os futuros e a vista. Todas as análises seguiram os rigores exigidos
para cada teste estatı́stico em particular.
As análises das séries temporais foram apoiadas pelo uso do software Eviews 7.0.
Para estruturac¸~ao das equac¸ões foi usado o software Mathtype 5. Já o tratamento dos
dados apoiou-se no uso do software Microsoft Excel vers~ao 2007.
3.1 Dados e procedimentos
As séries diárias de prec¸os do mercado a vista dos novilhos de corte argentinos e
prec¸os futuros da arroba do boi gordo na BM&FBOVESPA, utilizados para testar a
HME, compreendem o perı́odo entre 02 de janeiro de 2002 e 13 de maio de 2011.
As cotac¸ões diárias referentes ao indicador de prec¸os futuros da arroba do boi gordo
da BM&FBOVESPA foram obtidas junto ao Centro de Estudos Avanc¸ados em
Economia Aplicada (CEPEA), responsável pela divulgac¸~ao diária de prec¸os de ajuste
diário dos contratos futuros. O Indicador é definido, originalmente, em reais, e também
divulgado em dólares americanos.
O contrato futuro do boi gordo refere-se a 330 arrobas lı́quidas (15 quilogramas).
O boi gordo brasileiro é caracterizado como um bovino macho, vivo, castrado, com
carcac¸a convexa, alimentado a pasto ou confinamento, com peso entre 450 e 550
quilogramas e idade máxima de 42 meses (BM&FBOVESPA, 2012).
As cotac¸ões diárias referentes aos prec¸os a vista dos novilhos de corte argentinos
foram obtidas junto ao Ministério da Agricultura, Pecuária e Pesca da Argentina
(MAGYP) e referem-se aos prec¸os a vista praticados no Mercado de Liniers S.A, que é o
mais importante centro de transac¸ões a vista de bovinos na Argentina. Os prec¸os dos
novilhos argentinos s~ao cotados por quilograma/peso vivo, e a moeda referencial é o
peso argentino.
O novilho precoce argentino é um bovino macho, jovem, vivo, castrado,
apresentando entre dois e quatro dentes incisivos definitivos, com carcac¸a retilı́nea,
alimentado a pasto ou confinamento, com peso entre 300 e 430 quilogramas e idade em
torno de 30 meses. Já o novilho adulto argentino diferencia-se por ter, no mı́nimo seis
dentes incisivos permanentes, conformac¸~ao de carcac¸a entre subconvexa e convexa,
peso entre 431 e 520 quilogramas e idade entre 30 e 42 meses (MAGYP, 2011).
Os prec¸os a vista dos novilhos argentinos foram transformados em dólar conforme
cotac¸~ao diária do Banco Central da República da Argentina e, em seguida,
transformados em arrobas lı́quidas, considerando o aproveitamento equivalente à
carcac¸a de 50%.
A presenc¸a de dias sem cotac¸~ao de prec¸os e os outliers n~ao legı́timos foram
eliminados da amostra. Em seguida, as séries de prec¸os foram logaritmizadas visando
remover as tendências exponenciais e avaliadas quanto à associac¸~ao linear. Esses
procedimentos seguem os padrões dos testes da HME com a aplicac¸~ao de técnicas
de cointegrac¸~ao.
3.2 Hipótese e Testes Estatísticos
No presente estudo foi verificada a hipótese de que os prec¸os futuros, na data do
vencimento dos contratos futuros de boi gordo na BM&FBOVESPA, s~ao preditores
n~ao viesados dos prec¸os a vista dos novilhos de corte argentinos. Para verificar a
eficiência do mercado futuro foram aplicados, sequencialmente, os testes estatı́sticos
de estacionariedade para a constatac¸~ao da ordem de integrac¸~ao e os testes de
cointegrac¸~ao.
O teste de eficiência de mercado exige, necessariamente, que as variáveis, prec¸os a
vista e futuros, sejam cointegradas na mesma ordem. Portanto, as séries de prec¸os
devem possuir raiz unitária, ou seja, ser n~ao estacionárias.
Posto de forma mais generalizada, uma relac¸~ao de cointegrac¸~ao é tida como um
fenômeno de equilı́brio de longo prazo, ou seja, mesmo que essas variáveis se desviem
do seu relacionamento no curto prazo, esta associac¸~ao será retomada no longo prazo.
A partir dos testes de raiz unitária de Dickey and Fuller Aumentando (1981) e
Phillips and Perron (1988), de conhecidos por Phillips-Perron e ADF, respectivamente,
foi possı́vel identificar com maior acurácia se as séries s~ao integradas em mesma
ordem, ou seja, I(1). Os testes de Phillips-Perron e ADF para estacionariedade verificam
as hipóteses nula e alternativa: H0: ytBI(1) e H1: ytBI(0).
Apesar de necessária, a integrac¸~ao de mesma ordem n~ao quer dizer que as séries
sejam cointegradas; assim sendo, optou-se pela aplicac¸~ao do teste trac¸o de Johansen
(1988) e Johansen and Juselius (1990) para a verificac¸~ao de combinac¸ões lineares do tipo
I(0). Este teste permitiu investigar a existência de equilı́brio a longo prazo entre os
prec¸os a vista e futuros, condic¸ões fundamentais para aceitac¸~ao da HME.
A metodologia de Johansen (1988) tem como ponto de partida o vetor
autorregressivo de ordem p dado por, yt ¼ A1yt1 þ y þ Apytp þ et, onde yt, é um
vetor n 1 de variáveis que s~ao integradas de ordem um, I(1). Neste caso, a equac¸~ao
anterior pode ser reescrita como:
Dyt ¼ m þ
Y
yt1 þ . . . þ
p1
X
Gyt1 þ et
ð1Þ
i¼1
Onde:
Y
¼
p
X
i¼1
Ai 1 and G ¼ p
X
j¼iþ1
Aj
ð2Þ
Future market
for Brazilian
live cattle
217
ARLA
26,2
218
Q
Se o coeficiente da matriz
tem posto
Q reduzido
Q ron, ent~ao, existem r n matrizes a
e b, cada uma com posto r, tal que
¼ ab e
¼ byt é estacionária, onde r é o número
de relac¸ões de cointegrac¸~ao, os elementos de a s~ao conhecidos como parâmetros de
ajustamento no vetor de correc¸~ao do erro e cada coluna de b é um vetor de integrac¸~ao.
Pode-se mostrar que, para um dado r, o estimador de máxima verossimilhanc¸a da
matriz b define uma combinac¸~ao de yt-1 que produz r correlac¸ões canônicas[2] maiores
entre Dyt e yt1, após as correc¸ões de diferenc¸as de defasagem e variáveis
determinı́sticas quando presentes.
A significância da raz~ao de verossimilhanc¸a das correlac¸ões canônicas foram
conseguidas a partir do teste trac¸o, conforme a equac¸~ao (3).
ltraco̧ ¼ T
n
X
lnð1 ^lt Þ
ð3Þ
i¼rþ1
Onde T é o tamanho da amostra, e l# r þ 1 é a i-ésima maior correlac¸~ao canônica. O teste
trac¸o avalia a hipótese nula de que o número de vetores de cointegrac¸~ao é menor ou
igual a r, contra a hipótese alternativa de que o número de vetores de cointegrac¸~ao é
superior a r. As hipóteses, nula e alternativa, do teste trac¸o de cointegrac¸~ao s~ao as
seguintes:
H0. r ¼ 0, n~ao há cointegrac¸~ao.
H1. rX1, há cointegrac¸~ao.
Considera-se o nı́vel de significância de 5% para rejeic¸~ao ou n~ao rejeic¸~ao das hipóteses.
Os valores crı́ticos assintóticos do teste ltrac¸o podem ser encontrados em Johansen and
Juselius (1990) e muitos pacotes de software econométricos, como o Eviews 7.0,
utilizado nos testes empı́ricos do presente estudo. Porém, destaca-se que o Eviews 7.0
emprega os valores crı́ticos de Mackinnon (1996) para testar a estacionariedade dos
resı́duos considerando a cointegrac¸~ao. Para testar se os resı́duos originados da
estimac¸~ao do modelo s~ao autocorrelacionados, foi aplicada a estatı́stica d de Durbin
and Watson (1951).
No caso dos prec¸os n~ao serem cointegrados e apresentarem somente uma relac¸~ao de
curto prazo, esses devem ser modelados sob uma estrutura vetorial autorregressiva
bivariada (VAR) conforme o sistema de equac¸ões 4.
DSt ¼ cs þ
DFt ¼ cf þ
k
X
bsi DSti þ
k
X
i¼1
i¼1
k
X
k
X
i¼1
bfi DSti þ
bsi DFti þ mst
ð4Þ
bfi DFti þ mft
i¼1
Onde, c é o intercepto e, bsi e bfi s~ao parâmetros positivos. mstemft s~ao vetores aleatórios
independente e identicamente distribuı́dos (i.d.d). A aplicac¸~ao do modelo implica
decidir qual é o seu comprimento de defasagem, k, ótimo, o qual se inicia com o valor
um e acrescenta-se uma defasagem a cada interac¸~ao até que a correlac¸~ao residual seja
eliminada do sistema de equac¸ões.
Porém, ao saber que as séries s~ao cointegradas conforme o exposto por Lien and
Luo (1993), deve-se optar por estimar um modelo com correc¸~ao de erro, que leve em
conta o equilı́brio de longo prazo entre os movimentos dos prec¸os a vista e futuros, e
possibilita verificar a quest~ao do viés na predic¸~ao dos prec¸os. Assim, o sistema de
equac¸ões 4 da estrutura do VAR foi transformado em uma estrutura vetorial
autorregressiva bivariada com correc¸~ao de erro (VEC) conforme a equac¸~ao 5.
DSt ¼ cs þ
k
X
bsi DSti þ
k
X
i¼1
i¼1
k
X
k
X
219
bsi DFti þ gs Zt1 þ mst
ð5Þ
DFt ¼ cf þ
bfi DSti þ
i¼1
Future market
for Brazilian
live cattle
bfi DFti gf Zt1 þ mft
i¼1
Onde gs e gf s~ao parâmetros positivos e Zt-1 é o termo de correc¸~ao do erro que mede
como a variável dependente se ajusta aos desvios dos perı́odos anteriores promovidos
pelo equilı́brio no longo prazo, como especificado na equac¸~ao 6.
Zt1 ¼ a bFt þ St1
ð6Þ
Que pode ser transformada na equac¸~ao 7.
St1 ¼ a þ bFt þ Zt1
ð7Þ
Onde, a é uma constante, e b é o vetor de cointegrac¸~ao. Estas duas variáveis do modelo
de correc¸~ao do erro, expressas no sistema de equac¸ões 5, correspondem ao modelo
VAR(k) na primeira diferenc¸a, acrescido do termo correc¸~ao do erro gsZt-1 e gfZt-1. Os
coeficientes gs e gf s~ao interpretados como a velocidade de ajustamento. Quanto maior
gs, maior a resposta de St aos desvios anteriores, devido ao equilı́brio no longo prazo.
Assim sendo, sob a HME, o prec¸o do mercado deve refletir as informac¸ões
disponı́veis, ou seja, Ft do contrato futuro no tempo t þ 1 é um estimador n~ao viesado
do prec¸o a vista no futuro, St þ 1, conforme a equac¸~ao 8.
St1 ¼ a þ bFt þ ut1
ð8Þ
As hipóteses, nula e alternativa, para eficiência do mercado futuro brasileiro do boi
gordo brasileiro em relac¸~ao ao mercado a vista argentino dos novilhos de corte,
testadas no estudo, s~ao às seguintes:
H0. aa0 e ba1 com (bp0), o mercado é ineficiente.
H1A. a ¼ 0 e b ¼ 1, o mercado é eficiente e n~ao existe prêmio ao risco.
H1B. aa0 e ba1 com (0obo1), o mercado é eficiente, com a presenc¸a de prêmio
ao risco. Neste caso, o grau de eficiência varia entre 0 e 1.
O relaxamento da H1A para a H1B, referente à HME, deve-se à relac¸~ao entre prec¸os a
vista e futuros de produtos com caracterı́sticas similares, porém n~ao idênticas.
ARLA
26,2
220
A partir da verificac¸~ao dos parâmetros estatı́sticos obtidos pela aplicac¸~ao dos testes
de cointegrac¸~ao de Johansen (1988) e Johansen and Juselius (1990) e do uso do modelo
VEC foi possı́vel testar respectivamente, a HME e a quest~ao do viés da predic¸~ao de
prec¸os proposta pelo estudo.
4. Apresentac¸~
ao e análise dos resultados
O comportamento dos prec¸os a vista do novilho precoce e novilho adulto argentinos e
dos prec¸os futuros do boi gordo brasileiro, logaritmizados, é apresentado na figura 1.
O movimento das séries de prec¸os é bastante similar, porém os prec¸os futuros,
geralmente, se encontram um pouco acima, prec¸os a vista. Diferenc¸as expressivas
entre os prec¸os futuros e a vista s~ao evidentes no primeiro semestre de 2002 e entre os
anos de 2007 e 2009.
Sugere-se que a diferenc¸a dos prec¸os a vista no ano de 2002, em relac¸~ao aos prec¸os
futuros exibidos na figura 1, deve-se, em grande parte, à desvalorizac¸~ao cambial da
moeda argentina. Por outro lado, foi verificado que o distanciamento dos prec¸os, entre
2007 e 2009, coincide com as inúmeras intervenc¸ões governamentais no mercado da
carne bovina argentina neste perı́odo, como: aumento das taxas de exportac¸~ao,
restric¸ões ao peso para o abate de animais, proibic¸~ao de exportac¸ões, limitac¸~ao das
cotas de exportac¸~ao pela cota Hilton por 180 dias. Porém, Apesar de outros estudos
importantes, como o de Melo (2010), também creditarem a reduc¸~ao dos prec¸os da carne
bovina argentina, entre 2007 e 2009, a esses eventos, n~ao se encontram informac¸ões
suficientemente robustas que possam suportar essa afirmac¸~ao.
Pela figura 1, é possı́vel verificar rastros de associac¸~ao e tendências estocásticas
conjuntas entre os prec¸os a vista e futuros. Mesmo com indı́cios de cointegrac¸~ao entre
as séries de prec¸os, a realizac¸~ao de testes econométricos é fundamental para dar maior
precis~ao à análise e conclus~ao a este respeito.
2.0
1.8
1.6
1.4
1.2
1.0
0.8
2002 2003 2004 2005 2006 2007 2008 2009 2010
Figura 1.
Prec¸os futuros do boi
gordo e prec¸os a vista dos
novilhos
Log dos preços futuros do boi gordo brasileiro
Log dos preços a vista do novilho adulto argentino
Log dos preços a vista do novilho precoce argentino
Fonte: Dados da pesquisa
Dando inicio ao processo de análise da combinac¸~ao entre as variáveis em estudo,
a tabela 1 exibe a associac¸~ao linear entre as séries de prec¸os a vista e futuros.
Com base nos resultados da tabela 1, pode-se assegurar que os prec¸os futuros
do boi gordo brasileiro e prec¸os a vista do novilho precoce argentino s~ao forte
e positivamente associados em 86,43%, com nı́vel de significância de 1%. Porém a
associac¸~ao positiva entre os prec¸os futuros do boi gordo brasileiro e prec¸os a vista do
novilho adulto argentino é ainda mais forte, chegando a 87,67%, com significância
estatı́stica de 1%. Estes resultados apesar de n~ao serem conclusivos em termos de
comovimentac¸~ao de prec¸os, sinalizam uma possı́vel relac¸~ao entre as variáveis
estudadas e, por consequencia s~ao indicativos da combinac¸~ao entre os prec¸os a longo
prazo. A verificac¸~ao sobre a relac¸~ao entre as variáveis segue com os testes de detecc¸~ao
de raiz unitária.
O teste da raiz unitária Philips-Perron e de Dickey & Fuller Aumentando foram
aplicados às séries de prec¸os a vista e futuros com objetivo de determinar a presenc¸a ou
n~ao de raı́zes unitárias e como premissa para o teste de cointegrac¸~ao. Os resultados s~ao
expostos na tabela 2.
Com base nos resultados da tabela 2, os testes n~ao rejeitam a hipótese nula da
presenc¸a de raiz unitária nas séries temporais de prec¸os a vista e futuros em nı́vel.
Porém os testes, na primeira diferenc¸a, rejeitaram a hipótese nula, ou seja, há indı́cios
de que as séries de prec¸os a vista e futuros s~ao integradas de ordem um, I(1).
A estatı́stica de DW, com valores próximos a dois, indicam que as séries de prec¸os a
vista e futuros, na primeira diferenc¸a, n~ao apresentam problemas de autocorrelac¸~ao.
O número ótimo de defasagens da estimativa dos testes de cointegrac¸~ao foi o
primeiro passo para estimac¸~ao do modelo com incorporac¸~ao informacional dos efeitos
de longo prazo. A dimens~ao do modelo estimado e a parcimônia da regress~ao de
cointegrac¸~ao s~ao os elementos envolvidos nesta decis~ao.
Os critérios de informac¸~ao de Akaike (AIC), Schwarz (SBC) e Hanna-Quinn
(HQC), que têm por caracterı́stica penalizar o acréscimo de novas defasagens aos
modelos VAR, foram aplicados para a definic¸~ao do número ótimo de defasagens.
A tabela 3 apresenta o número ótimo de defasagens das estimativas dos testes de
cointegrac¸~ao segundo os critérios de informac¸~ao.
Conforme os resultados da tabela 3, o número ótimo de defasagens do teste de
cointegrac¸~ao entre os prec¸os a vista dos novilhos precoces e novilhos adultos
argentinos e prec¸os futuros do boi gordo é igual três, pelo critério SBC. Apesar dos
critérios AIC e HQC. estabelecerem um número ideal de defasagens igual a sete, devido
o princı́pio da parcimônia, foram respeitadas a robustez e a respectiva definic¸~ao do
critério de informac¸~ao SBC Por três defasagens, ou seja, modelo VAR (3).
Série de Prec¸os
Boi Gordo Brasileiro
Novilho Precoce Argentino
Novilho Adulto Argentino
(*) Significante ao nı́vel de 1%
Fonte: Dados da pesquisa
Boi Gordo
Brasileiro
Novilho
Precoce Argentino
Novilho Adulto
Argentino
1,0000*
0,8643*
1,0000*
0,8767*
0,9941*
1,0000*
Future market
for Brazilian
live cattle
221
Tabela I.
Associac¸~ao linear entre
prec¸os a vista dos novilhos
argentinos e prec¸os
futuros do boi gordo na
BM&FBovespa
(*) significante ao nı́vel de 1%, e (ns) n~ao apresenta significância estatı́stica
Fonte: Dados da pesquisa
5,63234
5,61824
5,62716
2,01182
Em nı́vel
1,06107
0,9250 ns
5,52935
5,52654
5,52832
2,54698
Em nı́vel
1,13498
0,9342 ns
5,63278
5,6215
5,62864
2,01156
1a diferenc¸a
28,54646
0,0000*
5,60634
5,60353
5,60531
2,03233
1a diferenc¸a
63,47617
0,00010*
5,35592
5,34464
5,35178
2,0122
Em nı́vel
0,79492
0,8843 ns
5,22778
5,22496
5,22675
2,63557
Em nı́vel
1,1366
0,9344 ns
5,35661
5,34815
5,3535
2,01207
1a diferenc¸a
32,49301
0,0000*
5,33436
5,33154
5,33332
2,07406
1a diferenc¸a
72,88902
0,00010*
Tabela II.
Testes da raiz unitária das
séries de prec¸os a vista e
futuros
Teste de Phillips & Perron (PP)
Teste PP
Em nı́vel
1a diferenc¸a
Estatı́stica t
1,68307
42,37027
p – valor (t)
0,9780 ns
0,00010*
Valores crı́ticos
Nı́vel 1%
2,56613
Nı́vel 5%
1,94098
Nı́vel 10%
1,61659
AIC
7,46154
7,46253
SBC
7,45872
7,45971
HQC
7,4605
7,46149
DW
1,88847
2,00679
Teste de Dickey & Fuller Aumentando (ADF)
Teste ADF
Em nı́vel
1a diferenc¸a
Estatı́stica t
1,68854
28,34031
p – valor (t)
0,9783 ns
0,0000*
Valores crı́ticos
Nı́vel 1%
2,56613
Nı́vel 5%
1,94098
Nı́vel 10%
1,61659
AIC
7,46787
7,46744
SBC
7,45942
7,46181
HQC
7,46477
7,46537
DW
1,99774
1,99796
A Vista do Novilho Precoce Argentino
A Vista do Novilho Adulto Argentino
Futuros do Boi Gordo Brasileiro
222
Série temporal
ARLA
26,2
Prec¸os a vista do Novilho
Precoce Argentino
Número
e Prec¸os Futuros
de Defasagens Critérios de Informac¸~ao
AIC
SBC
0
1
2
3
4
5
6
7
HQC
Prec¸os a vista do Novilho
Adulto Argentino
e Prec¸os Futuros
Critérios de Informac¸~ao
AIC
SBC
Future market
for Brazilian
live cattle
HQC
2.742.109 2.736.452 2.740.031 2.742.109 2.736.452 2.740.031
1.273.362 1.271.665 1.272.739 1.273.362 1.271.665 1.272.739
1.284.898 1.282.069 1.283.859 1.284.898 1.282.069 1.283.859
1.286.871 12.82911*
1.285.416 1.286.871 12.82911*
1.285.416
1.287.325 1.282.234 1.285.455 1.287.325 1.282.234 1.285.455
1.287.640 1.281.417 1.285.354 1.287.640 1.281.417 1.285.354
1.287.953 1.280.599 1.285.251 1.287.953 1.280.599 1.285.251
12.88624*
1.280.139 12.85506* 12.88624*
1.280.139 12.85506*
(*) Número ótimo de defasagens conforme os critérios de informac¸~ao
Fonte: Dados da pesquisa
223
Tabela III.
Teste de detecc¸~ao
do número ótimo
de defasagens dos testes
de cointegrac¸~ao
A existência de cointegrac¸~ao entre os prec¸os a vista e futuros foi verificada a partir do
teste trac¸o de Johansen (1988) e Johansen and Juselius (1990), conforme pode ser
constatado na tabela 4.
Os resultados dos testes da tabela 4 rejeitaram a hipótese nula de n~ao haver nenhum
vetor de cointegrac¸~ao, com 5% de significância estatı́stica. No entanto, apesar da
cointegrac¸~ao ser uma condic¸~ao essencial para atestar a eficiência de mercado, é de
fundamental importância avaliar se os prec¸os futuros s~ao estimadores n~ao viesados
dos prec¸os a vista.
Diante disso, as evidências ou n~ao da eficiência do mercado e n~ao viés das
estimativas de prec¸os a longo prazo foram analisadas por meio das equac¸ões do vetor
de cointegrac¸~ao e dos modelos VEC estimados, como pode ser visto nas tabelas 5 e 6.
Partindo do modelo VAR (3) dos logaritmos dos prec¸os a vista e futuros, foram
estimados os modelos VEC (2) com a inclus~ao dos elementos de correc¸~ao de erros, isto
porque as propriedades da terceira defasagem dos modelos nivelados encontram-se
incluı́das na segunda defasagem da primeira diferenc¸a. A tabela 5 apresenta os
coeficientes das regressões dos vetores de cointegrac¸~ao entre os prec¸os a vista e
futuros.
O coeficiente b da primeira regress~ao do vetor de cointegrac¸~ao na tabela 5 determina
que, a longo prazo, a elevac¸~ao no prec¸o futuro do boi gordo brasileiro em 1%
comovimenta, aproximadamente, 0,81% o prec¸o a vista do novilho precoce argentino
Teste de
cointegrac¸~ao
Prec¸os a Vista do Novilho
Prec¸os a Vista do Novilho Adulto
Precoce Argentino e Prec¸os Futuros
Argentino e Prec¸os Futuros
Trac¸o
Trac¸o
Número de vetores Eigen
Valor Crı́tico
Eigen
Valor Crı́tico
de cointegrac¸~ao
value
ltrac¸o
(5%)
p- valor value
ltrac¸o
(5%)
p- valor
¼ 0*
p1
0,00855 27,73047
0,00538 10,69583
25,87211
12,51798
(*) Denota rejeic¸~ao da hipótese ao nı́vel de 5%
Fonte: Dados da pesquisa
0,02910 0,00763 26,14387
0,09890 0,00551 10,95745
25,87211
12,51798
0,04630
0,08990
Tabela IV.
Testes trac¸o para
verificac¸~ao
da cointegrac¸~ao entre
os prec¸os a vista e futuros
ARLA
26,2
224
Tabela V.
Equac¸~ao de cointegrac¸~ao
entre os prec¸os a vista e
prec¸os futuros
Vetor de Cointegrac¸~ao
Novilho Precoce
Novilho Adulto
Constante
b
Erro Padr~ao
Estatı́stica t
0,255387
0,812112*
0,12139
6.69023
Rejeita H0
Rejeita H1A
N~
ao Rejeita H1b
0,307886
0,746209*
0,11871
6.28603
Rejeita H0
Rejeita H1A
N~
ao Rejeita H1b
Teste de Hipóteses
(H1b) aa0 e ba1 com (0obo1), o mercado é eficiente, com a presenc¸a de prêmio ao risco
(*) significante ao nı́vel de 5%
Fonte: Dados da pesquisa
Modelo VEC
Novilho Precoce
Constante
0,000280 (0.85562)
Zt1
0,009129 (2.21422)
DSt1
0,287047 (12.7675)
DFt1
0,022090 (0.30844)
DSt2
0,017412 (3.15060)
DFt2
0,084631 (1.49863)
DCR
7,06E-09
Tabela VI.
Log likelihood
13000,71
Coeficientes do modelo
AIC
13,08485
VEC (2) com a inclus~ao
13,04540
do mecanismo de correc¸~ao SBC
de erro para prec¸os a vista (.) Estatı́stica t
do novilho precoce e
(DCR) Determinante da Covariância dos Resı́duos
novilho adulto argentinos Fonte: Dados da pesquisa
Novilho Adulto
0,000272
0,011361
0,350613
0,033710
0,115728
0,075580
9,20E-09
12737,97
12,82012
12,78067
(0.72755)
(2.43142)
(15.6080)
(0.52268)
(5.18050)
(1.17156)
no mercado a vista. O equilı́brio a longo prazo entre prec¸os a vista do novilho precoce
argentino e prec¸os futuros do boi gordo brasileiro, conforme a primeira equac¸~ao do
vetor de cointegrac¸~ao da tabela 5, é de 81,21% de eficiência.
Por outro lado, o coeficiente b da segunda regress~ao do vetor de cointegrac¸~ao na
tabela 5 indica que, a longo prazo, o aumento do prec¸o futuro do boi gordo brasileiro
em 1%, comovimenta, aproximadamente, 0,75% o prec¸o do novilho adulto argentino
no mercado a vista. As equac¸ões do vetor de cointegrac¸~ao da tabela 5 atestam a
presenc¸a do prêmio ao risco. O equilı́brio a longo prazo entre prec¸os a vista do novilho
adulto argentino e prec¸os futuros do boi gordo brasileiro, conforme a equac¸~ao de
cointegrac¸~ao da tabela 6, é de 74,62% de eficiência.
Examinadas as equac¸ões dos vetores de cointegrac¸~ao na tabela 5 e os modelos VEC
(2) na tabela 6, detectou-se que os termos de erro defasados, Zt, das regressões de
cointegrac¸~ao, baseados na equac¸~ao 8, s~ao diferentes de zero com nı́vel de significância
de 5%.
O número de coeficientes do modelo VEC (2) estimados significantes a 1% e 5%
conforme os valores da estatı́stica t apresentado entre parênteses na tabela 6,
corroboram os resultados do teste trac¸o para cointegrac¸~ao entre prec¸os a vista e futuro
apresentados na tabela 4. Desse modo, as conclusões sobre a hipótese do mercado
eficiente continuam válidas.
5. Conclusões
O objetivo deste artigo foi verificar a eficiência do mercado futuro do boi gordo
brasileiro na BM&FBOVESPA, como preditor dos prec¸os dos novilhos de corte no
mercado a vista argentino na presenc¸a de prêmio ao risco.
Inicialmente, constatou-se uma associac¸~ao linear forte e positiva acima de 85%
entre os prec¸os a vista e futuro. Em seguida, pelos testes de raiz unitária, detectou-se
que na primeira diferenc¸a, as séries de prec¸os s~ao estacionárias, ou seja, integradas em
ordem um.
Os resultados do teste trac¸o indicaram a presenc¸a do vetor de cointegrac¸~ao entre
os prec¸os a vista dos novilhos argentinos e prec¸os futuros do boi gordo brasileiro.
A aplicac¸~ao do modelo de correc¸~ao de erros, VEC, permitiu testar a HME com a
presenc¸a do prêmio ao risco. Os resultados mostraram que o prêmio ao risco n~ao causa
rejeic¸~ao da hipótese de n~ao viés dos prec¸os futuros.
Os resultados apontam para uma eficiência de mercado a longo prazo entre os
prec¸os a vista do novilho precoce argentino e prec¸os futuros do boi gordo brasileiro de
aproximadamente 81%. Enquanto a eficiência de mercado a longo prazo entre os
prec¸os a vista do novilho adulto argentino e prec¸os futuros do boi gordo brasileiro, gira
em torno de 75%. Esses resultados sugerem que os prec¸os futuros do boi gordo
brasileiro podem auxiliar de maneira expressiva a predic¸~ao dos prec¸os a vista dos
novilhos argentinos.
Portanto, pode-se afirmar com base nos resultados dos testes de cointegrac¸~ao e de
n~ao viés dos prec¸os, que o mercado futuro do boi gordo brasileiro é eficiente, e que
a longo prazo os prec¸os futuros do boi gordo s~ao estimadores n~ao viesados dos prec¸os a
vista dos novilhos argentinos.
Os resultados obtidos neste estudo contrastam com os encontrados por Bressler and
Covey (1991), McKenzie and Holt (2002) e Alves et al. (2008). Por outro lado, corroboram
os resultados das investigac¸ões de Kellard et al. (1999), Melo et al. (2006), Abitante
(2008) e Moraes et al. (2009).
Os resultados encontrados em diferentes testes da HME para mercados futuros
agrı́colas s~ao creditados a diversos fatores, em especial: perı́odo de análise,
sazonalidade, intervenc¸ões governamentais e estruturas institucionais. Neste
contexto, as diferenc¸as entre os produtos, o mercado a vista e os padrões dos
derivativos no mercado futuro referentes a este estudo contribuem para a investigac¸~ao
de diferentes perspectivas sobre a HME.
Porém, a maturidade do mercado futuro do boi gordo, somado ao crescimento da
participac¸~ao de diferentes agentes da cadeia produtiva da carne bovina nele, é um
indicativo de que os contratos futuros de boi gordo da BM&FBOVESPA tendem a ser
cada vez mais utilizados como instrumentos de protec¸~ao contra as oscilac¸ões de prec¸os
no mercado a vista, n~ao só por agentes que atuam no mercado da carne bovina
brasileira, como também de outros mercados, o que já acontece em volume significativo
com outras commodities, em outras bolsas, como, por exemplo, a soja e seus derivados,
na Chicago Board of Trade (CBOT).
O grande número de métodos que podem ser usados para testar a HME permite que
diferentes investigac¸ões sobre a relac¸~ao entre mercados com caracterı́sticas
semelhantes aos deste estudo sejam realizadas, em especial, no sentido de comparar
a eficiência entre derivativos de diferentes bolsas para a mitigac¸~ao do risco de prec¸os
Future market
for Brazilian
live cattle
225
ARLA
26,2
226
de commodities agrı́colas de paı́ses que tenham carência ou indisponibilidade destes
instrumentos.
Notes
1. The scope of canonical correlations is to determine a linear combination for each group of
variables (dependent or independent) which maximises the correlation between the two
groups (Rig~ao, 2009). Different canonical correlations, the multiple correlations, the
association regression between the variables indicates the degree of association between
these variables. Therefore, it is not only associated with the dependent variables but also
with the intercorrelations between the dependent variables (Henriques et al., 2005).
2. A finalidade da correlac¸~ao canônica é determinar uma combinac¸~ao linear para cada grupo
de variáveis (dependentes e independentes) que maximize a correlac¸~ao entre os dois grupos
(Rig~ao, 2009). Diferente da correlac¸~ao canônica, a correlac¸~ao múltipla, ou regress~ao de
associac¸~ao entre as variáveis, indica o grau de associac¸~ao entre as variáveis. Portanto, está
relacionada n~ao só às variáveis dependentes, mas também com as intercorrelac¸ões entre
variáveis dependentes (Henriques et al., 2005).
References
Abitante, K.G. (2008), “Cointegrac¸~ao entre os mercados spot e futuro: Evidências dos mercados
de boi gordo e soja”, Revista de Economia e Sociologia Rural, Vol. 46 No. 1, pp. 75-96.
Acker, L.F. and Racine, M.D. (1999), “Stochastic trends and cointegration in the market for
equities”, Journal of Economics and Business, Vol. 51 No. 2, pp. 133-143.
Alves, J.S., Duarte, G.S. and Lima, R.C. (2008), “Teste de eficiência do mercado futuro do álcool
anidro no Brasil: Uma análise de cointegrac¸~ao”, Revista de Economia do Nordeste,
Fortaleza, Vol. 39 No. 1, pp. 174-184.
Associac¸~ao Brasileira das Indústrias Exportadoras de Carnes (ABIEC) (2011), “Estatı́sticas”,
available at: www.abiec.com.br/41_exportacao_ano.asp (accessed 10 April 2011).
Beck, S.E. (1994), “Cointegration and market efficiency in commodity futures markets”, Applied
Economics, Vol. 26 No. 3, pp. 249-257.
Bodie, Z., Kane, A. and Marcus, A.J. (2010), Investimentos, AMGH, Porto Alegre.
Bolsa de Valores, Mercadorias e Futuros (BM&FBOVESPA) (2012), “Contratos agropecuários”,
available at: www.bmfbovespa.com.br/pt-br/a-bmfbovespa/download/Contratos-Bolsa de
Valores, Mercadorias e Futuros – Agropecuarios.pdf (accessed 15 January 2012).
Bressler, D.A. and Covey, T. (1991), “Cointegration: some results on US cattle prices”, The Journal
of Futures Markets, Vol. 11 No. 4, pp. 461-474.
Camargos, M.A. and Barbosa, F.V. (2003), “Teoria e evidência informacional do mercado de
capitais brasileiro”, Caderno de Pesquisas em Administrac¸~
ao, Vol. 10 No. 1, pp. 1-15.
Centre of Advanced Studies in Applied Economic (CEPEA) (2011), “PIB do agronegócio
Brasileiro”, available at: www.cepea.esalq.usp.br/pib/ (accessed 15 May 2011).
Chu, Q.C., Hsieh, W.G. and Tse, Y. (1999), “Price discovery on the S & P 500 index markets: an
analysis of spot index, index futures, and SPDRs”, International Review of Financial
Analysis, Vol. 8 No. 1, pp. 21-34.
Comiso, M.G. (2007), Factibilidad de un mercado de futuros y opciones de ganado bovino para
faena en Argentina, Tese (Economia), Departamento de Economia, Universidad Nacional
del Sur, Bahı́a Blanca.
Danthine, J.P. (1978), “Information, futures prices and stabilizing speculation”, Journal of
Economic Theory, Vol. 17 No. 1, pp. 79-98.
Dickey, D.A. and Fuller, W.A. (1981), “Likelihood ratio statistics for autoregressive time series
with a unit root”, Econometrica, Vol. 49 No. 4, pp. 1057-1072.
Dopchiz, M.Y. (2008), La implementación de un mercado de futuros em el sector ganadero
argentino, Tese (Economia), Facultad de Ciencias Económicas y Sociales, Universidad
Nacional de Mar del Plata, Mar del Plata, Argantina.
Durbin, J. and Watson, G.S. (1951), “Testing for serial correlation in least-squares regression II”,
Biometrika, Vol. 38 No. 1, pp. 159-178.
Enders, W. (2004), Applied Econometrics Time Series, Wiley, Hoboken, NJ.
Engle, R. and Granger, C. (1987), “Cointegration and error correction: representation, estimation
and testing”, Econometrica, Vol. 55 No. 2, pp. 251-276.
Fama, E.F. (1970), “Efficient capital markets: a review of theory and empirical work”, The Journal
of Finance, Vol. 25, pp. 383-417.
Fama, E.F. (1991), “Efficient capital markets II”, The Journal of Finance, Vol. 46 No. 5,
pp. 1575-1617.
Fama, E.F. and French, K.R. (1987), “Commodity futures prices: some evidence on forecast power,
premiums and the theory of storage”, Journal of Business, Vol. 60, pp. 55-73.
Henriques, A., Neves, C. and Pesquita, I. (2005), “Estudos correlacionais e estudos causalcomparativos: Metodologia da Investigac¸~ao I”, available at: www.educ.fc.ul.pt/docentes/
ichagas/mi1/t1textoestcorrelacionais.pdf (accessed 10 April 2012).
Instituto de Promoción de la Carne Vacuna Argentina (IPVCA) (2012), “Estadı́sticas”, available
at: www.ipcva.com.ar/estadisticas/ (accessed 23 January 2012).
Johansen, S. (1988), “Statistical analysis of cointegration vector”, Journal of Econometric Dynamic
and Control, Vol. 12 No. 2, pp. 231-254.
Johansen, S. and Juselius, K. (1990), “Maximum likelihood estimation and inference on
cointegration: with applications to the demand for Money”, Oxford Bulletin of Economics
and Statistics, Vol. 52 No. 2, pp. 169-210.
Jumah, K. and Martin, W.C. (1999), “Temporal relationship among prices on commodities
futures markets”, American Journal of Agricultural Economics, Vol. 81 No. 4, pp. 987-989.
Kellard, N., Newobold, P., Rayner, T. and Ennew, C. (1999), “The relative efficiency of commodity
futures markets”, The Journal of Futures Markets, Vol. 19 No. 4, pp. 413-432.
Kenourgios, D.F. (2005), “Testing efficiency and the unbiasedness hypothesis of the emerging
Greek futures market”, European Review of Economics and Finance, Vol. 4 No. 1,
pp. 3-20.
Lai, K.S. and Lai, M. (1991), “A cointegration test for market efficiency”, The Journal of Futures
Markets, Vol. 11 No. 5, pp. 567-575.
Leuthold., R.M. (1979), “An analysis of the futures – cash prices basis for live beef cattle”, North
Central Journal of Agricultural Economics, Vol. 1 No. 1, pp. 47-52.
Lien, D. and Luo, X. (1993), “Estimating multiperiod hedge ratios in cointegrated markets”, The
Journal of Futures Markets, Vol. 13 No. 8, pp. 909-920.
Mckenzie, A.M. and Holt, M.T. (2002), “Market efficiency in agricultural futures markets”,
Applied Economics, Vol. 34 No. 12, pp. 1519-1532.
Mackinnon, J.G. (1996), “Numerical distribution functions for unit root and cointegration tests”,
Journal of Applied Econometrics, Vol. 11 No. 6, pp. 601-618.
Melo, A.S., Lima, R.C. and Moraes, A.S. (2006), “Análise da eficiência dos mercados futuros de
commodities agrı́colas brasileiras utilizando cointegrac¸~ao”, Artigo apresentado no XLVI
Congresso da Sociedade Brasileira de Economia e Sociologia Rural, 23-27 Julho, Fortaleza.
Melo, G.B. (2010), Integrac¸~
ao entre os mercados de boi para abate na Argentina e no Brasil,
Dissertac¸~ao (Economia Aplicada), Escola Superior de Agricultura Luiz de Queiroz,
Piracicaba, Brasil.
Future market
for Brazilian
live cattle
227
ARLA
26,2
228
Ministry of Agriculture, Livestock and Fishing of Argentina (MAGYP) (2011),
“Sistema integrado de información agropecuária”, available at: www.siia.gov.ar/
(accessed 8 April 2011).
Moraes, A.S., Lima, R.C. and Melo, A.S. (2009), “Análise da eficiência do mercado futuro
brasileiro de boi gordo usando co-integrac¸~ao”, Revista de Economia e Sociologia Rural,
Vol. 47 No. 3, pp. 601-614.
Newbold, P., Rayner, A., Ennew, C. and Marrocu, E. (1999), “Futures markets efficiency: evidence
from unevenly spaced contracts”, Discussion paper No. 34, School of Economics,
University of Nottingham, Nottingham.
Phillips, P.C.B. and Perron, P. (1988), “Testing unit roots in time series regression”, Biometrika,
Vol. 75 No. 2, pp. 335-346.
Pizzi, J. and Just, A. (1998), “Efficiency of commodity futures”, American Journal of Agricultural
Economics, Vol. 80 No. 2, pp. 347-359.
Rig~ao, M.H. (2009), Correlac¸~
ao canoˆnica para identificac¸~
ao de caracteres importantes na selec¸~
ao
precoce de tubérculos de batata, Tese (doutorado em agronomia), Universidade Federal de
Santa Maria, Santa Maria.
Silva Neto, W.A., Fraga, G.J. and Marques, P.V. (2010), “Eficiência de mercado: evidências
empı́ricas para os prec¸os spot e futuro de boi gordo”, Revista de Economia, Vol. 36 No. 3,
pp. 7-24.
United States Department of Agriculture (USDA) (2011), “Data and statistcs”, available at:
www.usda.gov/wps/portal/usda/usdahome?navid¼DATA_STATISTICS&navtype¼RT&
parentnav¼AGRIBUSI_ COOP (accessed 17 June 2011).
Zulauf, C.R. and Irwin, S.H. (1997), “Market efficiency and marketing to enhance income of crop
producers”, Economic Paper Series 97-04, OFOR, Urbana-Champaign.
About the authors
Odilon José de Oliveira Neto is PhD student in Business Administration by the S~ao Paulo School
of Business Administration at the Getulio Vargas Foundation (EAESP/FGV), Brazil. He is
Professor of Finance in the course on Management at the Federal University of Uberlândia (UFU)
and leader of the Research Group on “Intelligence in Finance and Markets” at the Faculty of
Integrated Sciences of Pontal at the Federal University of Uberlândia (FACIP/UFU). Odilon José
de Oliveira Neto is the corresponding author and can be contacted at: [email protected]
Fabio Gallo Garcia is PhD in Business Administration by the S~ao Paulo School of Business
Administration at the Getulio Vargas Foundation (EAESP/FGV), Brazil. He is Professor of
Finance at the Getulio Vargas Foundation (EAESP/FGV) and Pontifical Catholic University
of Sao Paulo (PUC/SP).
To purchase reprints of this article please e-mail: [email protected]
Or visit our web site for further details: www.emeraldinsight.com/reprints
Baixar

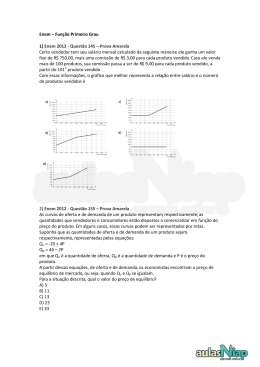
![[#0469] A relação com filhos exige generosidade](http://s1.livrozilla.com/store/data/000520567_1-7a9f7d58caad57154c082a3672187ca4-260x520.png)
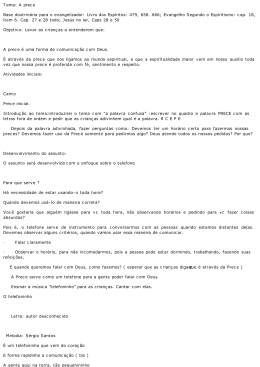
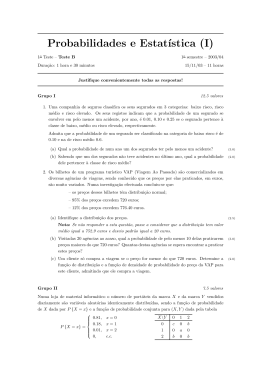
![[#0551] Tema: A prece - seu significado e importância em](http://s1.livrozilla.com/store/data/001120405_1-15a95042f56ade31df552e12b813a3fa-260x520.png)