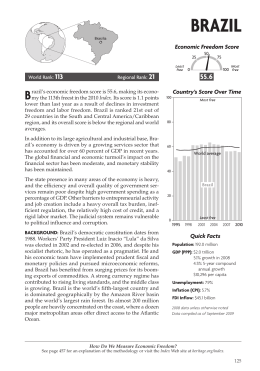
Junho '06 / (72/82)
72
73
Human Capital and Corruption: A microeconomic model of the
bribes market with democratic contestability
Pedro Cosme Costa Vieira / Aurora A. C. Teixeira
Faculdade de Economia UP / CEMPRE, Faculdade de Economia UP
resumo
Para ultrapassar eventuais falhas de
mercado, a sociedade cria leis que
estimulam ou penalizam os
comportamentos dos indivíduos no
sentido da eficiência. No nosso modelo
que tem fundamentação microeconómica,
comparamos os desvios das entidades
públicas em duas situações opostas:
autocracia vs. democracia. Assumimos
que em autocracia os governantes têm
um monopólio sobre o mercado das
‘influências’ enquanto que em democracia
há concorrência entre o governo e a
oposição. Os nossos resultados parecem
compatíveis com factos estilizados bem
conhecidos: (1) em democracia o nível de
corrupção é menor que em autocracia,
mantendo-se positivos; (2) em situações
em que o nível de capital humano é maior,
os regimens são mais democráticos e o
nível de corrupção é menor; e (3) o nível
de corrupção é maior em economias mais
reguladas.
Pour surmonter les lacunes du marché la
société crée des droits coutumiers qui
stimulent ou pénalisent l’action des individus
et dont l'application dépend de l’action des
pouvoirs publics qui peuvent être ouverts à la
résumé / abstract
corruption. Nous modelons ce comportement
dans le cas d’une autocratie et d’une
démocratie, en utilisant un cadre microéconomique. Nous supposons que dans le
cas d’une autocratie les décideurs ont le
monopole du marché de corruption, tandis
que dans une démocratie des groupes
contradictoires entrent en concurrence pour
le marché de corruption. Les modèles
construits produisent des résultats qui sont
compatibles avec des faits stylisés bien
connus, nommément que (1) dans une
démocratie, par rapport à une autocratie, le
niveau de corruption est inférieur quoique
toujours positif, (2) dans les environnements
où le niveau du capital humain est plus élevé,
le régime politique est plus proche de la
démocratie et le niveau de corruption est plus
bas, et que (3) le niveau de corruption est
plus élevé pour les économies plus réglées.
To overcome market failures society creates
common laws that stimulate or penalize
individual actions, the enforcement of which
depends on the actions of public authorities
who may be susceptible to corruption. We
model this behaviour for an autocracy versus
a democracy, using a microeconomic
framework. We assume that in an autocracy
rulers have a monopoly over the bribes
market, whereas in a democracy conflicting
groups compete in the bribes market. The
models constructed produce results that are
compatible with the well-known stylized facts,
namely that (1) in a democracy the level of
corruption is lower than in an autocracy,
although still positive, that (2) in environments
where the level of human capital is higher,
regimes are closer to democracies and the
level of corruption is lower, and that (3) the
level of corruption is higher in more regulated
economies.
JEL Classification: J24; D73; C63
Human Capital and Corruption: A microeconomic model
of the bribes market with democratic contestability
Pedro Cosme Costa Vieira;
Aurora A. C. Teixeira
1. Introduction
Researchers have been interested in the determinants and effects of corruption for quite some
time – Aidt (2003), Jain (2001), Rose-Ackerman (1999), Bardhan, (1997), and Ades and Di Tella
(1997) provide excellent and comprehensive surveys on the subject. Recently, the availability of
adequate data on corruption, especially indices of corruption perceptions for different countries,
boosted new and interesting studies (Goel and Nelson, 2005; Xin and Rudel, 2004; Fisman and
Svensson, 2002).
Corruption, although unethical, may be perfectly rational from an individual frame of reference
(Barreto, 2000). Corruption can therefore take place in any economic transaction involving the
public sector, since any economic transaction brings mutual benefits to both parties.
Given that natural resources are a factor in production, by imposing restrictions on their use
governments create economic incentives for producers to overcome these restrictions. In
addition, economic incentives also exist for producers to adjust the production process (for
example, through the division of labour) and the level of output. The producers therefore have an
incentive for attempting to corrupt the government agents who control the consumption rate for
natural resources and the level of competition.
A government strategy which maximizes the potential for corruption involves imposing very strict
limits on the use of natural resources and, in addition, a concentrated market. In this way, the
value of a natural resource (its shadow price) is enhanced and comes to represent a greater gain
when the imposed limits are overcome. It is easy for governments to justify such policies. In the
first place, it is easy to convince the public that they should economize on natural resources and
that policies should therefore be restrictive. Secondly, it is also easy to convince the public that
the existence of economies of scale means that production is more efficient if it is in the hands of
one sole producer.
We assume that government controls the use of natural resources but this concept can be
conceptually extended to accommodate any market regulation policy.
Despite having imposed tight restrictions on the use of the natural resource, government officials
can organize ways of “selling” permission to overstep these limits. For example, the
measurements of the natural resource used are not directly observed by the public and
“inspectors” can alter the figures.
Thus, the enforcement of law depends on the actions of public authorities who could be
corrupted. A new market emerges where ‘influences’ are traded. Legislators have incentives to
deviate from the goal of efficiency and produce laws that maximize the gains that can be
expected from bribes. We model this behaviour for an autocracy versus a democracy, using a
microeconomic framework. We assume that in an autocracy rulers have a monopoly over the
bribes market, whereas in a democracy conflicting groups compete in the bribes market.
The present paper is structured as follows. In the next section we formalize the model. In the
Section 3, using simulation techniques, we analyse the level of social welfare that occurs when a
government imposes a maximum level of use for a natural resource, which is distributed amongst
various producers. The Section 4 details a reduced model of interaction between government
officials and the opposition and Section 5 concludes the paper.
2. Formalization of the model
In our economy there is a natural resource and decisions on how it is assigned are the
responsibility of the government. The use of this natural resource has, on the one hand, a
positive effect in terms of company output and, on the other hand, a negative externality for
people. The government therefore has to make a ruling on the use of this natural resource that
takes both the positive and the negative effects into account.
Junho '06 / (72/82)
74
75
In abstract terms, the production of goods and services requires capital, labour and the natural
resource whose use causes environmental damage (e.g. air pollution) that has a negative effect
on the welfare of citizens.
Since environmental damage is not taken into account in the producers’ decisions, there is a
need for the government to intervene. Let us suppose that technology allows for the partial
substitution of factors that may be condensed into a Cobb-Douglas production function and that
there are increasing returns to scale.
In technological terms, assuming increasing returns to scale implies that the existence of several
producers in the market conducts to a higher output and a less efficient outcome that imply
greater use of the natural resource. Such circumstances enable corrupt government officials to
convince the electorate to adopt policies that are not the best in terms of social welfare, i.e. a
monopolistic market structure, but increase the potential gains for these individuals.
One of these policies concerns the level of market concentration. The existence of economies of
scale introduces the officials’ argument for the existence of a “natural monopoly” which favours
market concentration. If we observe the situation in various different countries, it can be seen
that this justification has been used frequently by governments (together with the Schumpeterian
issue of appropriate investment in innovation and development) to justify awarding concessions
to just a few companies. In Portugal, for example, this argument is used to justify the existence of
monopolies in water supply, waste collection, rail transport, urban public transport and port
authorities, amongst others.
A second policy is associated with the natural resource’s consumption rate. The fact that there is
a positive relationship between consumption of the natural resource and output emerges here as
a justification on the part of governments for allowing a level of use of the natural resource that is
beyond that which is socially beneficial, causing environmental damage.
Both of these policies favour the producers who are already operating in the market and who
therefore push for the situation to be maintained by paying bribes.
In formal terms, let us assume that a producer using a level of capital k, labour supply l and
amount m of the natural resource, has the output level y:
y (k,l,m) = A • kα • l β • m γ, α + β + γ > 1,
(1)
As there are economies of scale, this implies α + β + γ > 1.
Assuming that the market rate for capital is rate r, which includes depreciation and risk, that the
hourly-paid market wage is w and that the private sector price of the natural resource is zero, the
profits of a producer whose production function is represented by the expression (1) will be:
π (k,l,m) = y (k,l,m) • p – k • r – l • w,
(2)
Concentrating on market structure, let us assume, still in general terms, that the aggregate
market demand is known and decreases linearly according to price:
D = D0 – b • p ⇒ p = (D0 – D) / b
(3)
Thus the selling price of the product depends on aggregate output.
Assuming, additionally, that the producers compete according to Cournot, it follows that the
Human Capital and Corruption: A microeconomic model
of the bribes market with democratic contestability
Pedro Cosme Costa Vieira;
Aurora A. C. Teixeira
profits of a producer who assumes D+ as a reference, this being the level of output of the other
producers, will be expressed as follows:
π = y • (D0 – D+ – y) l b – k • r – l • w
(4)
The level of activity of each producer will depend on the price of the factors they use, the level of
aggregate production amongst the other producers, D+, which is assumed to be exogenous, and
the total amount of the natural resource that the government allows them to use.
Assuming that each unit of the natural resource consumed causes the environmental damage
Pa, that the wages received by employees is equal to the effort expended (i.e. working does not
lead to a direct increase in employee welfare, only in the consumption of goods and services)
and that the capital is “neutral” (capital interest do not lead to any increase in social welfare
because they represent remuneration for the sacrifice of saving), in overall social terms welfare is
expressed by the sum of the producer’s profit added to the consumer gains, from which the
environmental damage is subtracted:
(5)
If we take into consideration the fact of the market economy and the fact that producers, even in
a monopoly, have little influence on the labour and capital market, we can assume that capital
remuneration, r, the hourly-paid wages, w, and the unitary environmental damage, Pa, are
exogenous factors. Note that any discussion on the level of efficiency/inefficiency of public
planning in terms of the production of goods and services lies beyond the scope of this study.
In this context, producers aspire to a government which imposes the simplest possible laws in
order to allow producers to maximize the aggregate benefits defined in equation (5).
As scale economies are present in the production process, if the size of a producer increases,
fewer resources will be needed for each output unit produced. Therefore, if concessions for the
use of the natural resource are granted to various producers with the eventual possibility of
mergers or the acquisition of rights to the natural resource, the market will tend towards a
monopoly structure. Government officials take advantage of this situation to justify the existence
of one sole producer in the market, an argument that is easily accepted by the electorate.
However, the lack of competition in the market is socially harmful since the monopolist will set a
level of output whose marginal production costs are lower than the market price. Regulation
apparently allows this problem to be overcome but, on the one hand, it attracts corruption and,
on the other hand, it requires the regulator to have previous knowledge of the most socially
beneficial performance.
3. Simulation of market behaviour
In this section, using simulation techniques we will analyse the level of social welfare that occurs
when a government imposes a maximum level of use for a natural resource, which is distributed
amongst various producers. These compete but cannot merge (i.e. the government controls the
level of market concentration).
Starting with equations (1)-(5) and setting the model to, α = β = γ = 0,5, D0 = 100, b = 10, r =
15%1 e w =10, we see a rise in social welfare when the situation changes from a monopoly to a
duopoly (n=1 para n=2). As can be seen in Figure 1, this is accompanied by the use of larger
amounts of the natural resource (m):
1 We consider here 15% which is the Internal Rate of Return for new firm risky private investments –
approximately, 4% of interest without risk within a 8 year amortization period.
Junho '06 / (72/82)
76
77
Figure 1 – Relationship between the level of social welfare, number of producers and use of
the natural resource
Welfare
n=2
250 200 150 n=1
100 50 00
2
4
6
8
m
However, it is possible to see from the same figure that even if the consumption level for the
natural resource remains steady (i.e. veers from the vertical), the transition from monopoly to
duopoly increases social welfare. This is due to the fact that even though there is no increase in
the consumption of the natural resource, there will be an increase in production through the
greater use of labour and capital, as the next figure shows.
Figure 2 – Relationship between the use of labour and capital, number of producers and use
of the natural resource
Capital
Labour
400 6n=2
300 -
n=2
3200 n=1
00
2
4
6
n=1
8
m
100 0
2
4
6
8
m
It is possible to observe from Figure 1 that, with a given number of producers in the market,
there is an optimum level for consumption of the natural resource. Restricting ourselves to these
optimum points, in Figure 3 we can see the evolution of social welfare according to the number
of producers operating in the market. In concrete terms, the existence of a certain amount of
competition favours social welfare. In our simulation, the evolution of the level of welfare
together with the number of producers reaches a maximum at n = 2. At up to n =10, social
welfare is higher than in a monopoly (n=1). However, the existence of economies of scale in the
production process means that the number of competitors has to be limited (n≤10) so that
technological inefficiency is not superimposed on the gains created by the existence of
competition.
Pedro Cosme Costa Vieira;
Aurora A. C. Teixeira
Human Capital and Corruption: A microeconomic model
of the bribes market with democratic contestability
Figure 3 – Relationship between social welfare and number of producers
Welfare
250 -
200 -
150 1
2
3
4
5
6
7
8
9
n
Another important issue that our model enables us to analyse is whether, as an alternative to
maintaining a fixed level for the use of the natural resource, it would be in society’s interests for
the government to set a price for the use of the natural resource (internalise the impact) and to
use this money to compensate for the environmental damage caused, whilst making the
producers responsible for setting the criteria for the amount used. In this case, the cost of the
natural factor has to be added to the profit function:
π = y • (D0 – D+ – y) l b – k • r – l • w – m • pa
(6)
In the simulation it can be seen that when social damage is incorporated into the optimization
model for producers, consumption of the natural resource falls slightly and is partially replaced by
labour and capital. However, in terms of social welfare, the policies are identical.
To conclude, the best policy for a government is to set reasonable limits on the levels of use of the
natural resource and to distribute the rights to more than one producer (at least two but less than
ten, in the case of our settings), or else to set the price of the natural resource as environmental
damage and let the producers decide on the best ratios for labour, capital and natural resource.
However, the producers must not be allowed to merge towards monopoly or create a cartel.
Given the theoretical equivalence of the two policies (imposing either a maximum level of use or
a price), in empirical terms it is to be expected that approximately 50% of governments would opt
for each of them. However, the vast majority of governments (and in the case of some resources,
all of them) opt to limit use. In our opinion, this is due to the fact that putting a price on use
reduces the potential gains for corrupt government officials.
From this micro-foundation model we illustrate how a policy which favours the existence of
corruption is unfavourable to social welfare. This being the case, in a second step we may, in
abstract terms, condense possible government policies into the variable c which has the value of
1 if the policy is optimum and 0 if it promotes the highest possible levels of corruption and lower
levels of social welfare.
3. Simulation of market behaviour
In this reduced model, the gains of government officials during the present period, B, are shown
as a decreasing function of government policy c, when social welfare, WF, rises:
Junho '06 / (72/82)
78
79
(7)
If the government policy veers away from the optimum (i.e. if the value of c veers from 1), the
likelihood of the government being replaced by the opposition increases. This happens because
the public reacts to the reduced level of welfare in relation to its optimum level WF*, increasing
the probability of the government falling as the distance between WF* – WF increases.
As the optimum value is difficult to observe (the information is not fully accurate), the likelihood of
a government defeat also increases in line with the level of political activity on the part of the
opposition (measured by the parameter ψ) and the receptivity of the public to opposition activities
(measured by the parameter ξ). This receptivity, in empirical terms, may be measured by the
average level of education of the electorate, since a more educated electorate tends to be able to
understand and discern the relevant information better than a less educated one (Gibbons and
Johnston, 1974). As Welch (1970: 42) argues, “… increased education may enhance a [person]’s
ability to acquire and decode information about costs and … characteristics of other inputs.”
The opposition incurs costs in informing the electorate (e.g. pamphlets, announcements and
speeches) which are derived from the unit price of creating opposition, po, multiplied by the
amount of opposition realized, po •ψ.
The government determines the value of c which maximizes its expected gains, VG, with ξ, ψ and
po given, whilst the opposition determines the level of political activity ψ which maximizes its
expected gains, VO, with ξ, χ and po given (assuming that the government does not influence po).
In this way, the expected gains from being in power, VG, and from being in opposition, VO, are
shown in the resolution of the following dynamic optimization problem:
(8)
(9)
This represents a symmetry in which all the agents (government and opposition) adopt the same
strategy – for the government, the policy is represented by χ and for the opposition, ψ.
Therefore, the level of good governance (as opposed to the level of corruption) will result from
the interaction between the government and the opposition in a similar way to the competition
that takes place between companies to win market leadership.
From the results shown below, the model demonstrates that the level of corruption in a
democracy is lower than in an autocracy and is very much dependent on the ability of the
opposition groups to captivate the electorate.
Human Capital and Corruption: A microeconomic model
of the bribes market with democratic contestability
Pedro Cosme Costa Vieira;
Aurora A. C. Teixeira
(10)
In an analysis of comparative statics,
(11)
the first optimization condition can be derived:
(12)
This demonstrates that when the price of creating opposition, po, is infinite we are faced with a
strong dictatorship and when po is reduced, the level of democracy rises.
When po is infinite, the government adopts the most corrupt policy possible. In the second
equation the level of opposition activity is zero:
(13)
meaning that the government remains in power regardless of its politics and government officials
adopt whatever maximizes their level of corruption:
Junho '06 / (72/82)
(14)
80
81
When the price of creating opposition, po, is zero, we are faced with a «perfect» democracy and
the government adopts a form of politics that only contains a certain level of corruption (no
government is incorruptible). In the second equation, there is a positive level of opposition which
makes it likely that the government will change and that it is worth creating an opposition.
(15)
Note that, if taken to absurd lengths, the level of opposition would be infinite and the government
would fall immediately, thus implying that there are no gains for government officials. Therefore it
would not be worth forming an opposition, since there would be no gains to be had from forming
a government. If the government implements optimum policies, the government officials remain
in power but still gain nothing, and so there are no incentives to form any opposition. However, if
the opposition is finite, the likelihood of the government officials who have maintained a certain
level of corruption losing office is lower when the units representing the gains to be had from
remaining in office and the gains to be had from creating an opposition are positive.
From these two limited cases, it may be concluded that when the cost of forming an opposition is
lower, the level of opposition is greater, as are the chances of government officials being
removed from office and their level of corruption being reduced.
(16)
Note that when opposition agents are subsidized, there are no longer incentives to become
government and government officials no longer concern themselves with re-election (as it is
equally optimal to be in the opposition), thus increasing the level of corruption (the incumbent
government does not care in pleasing the electorate). In addition, it may also be concluded that
when the level of “education” of a population, as reflected in the parameter ξ, is higher, the level
of opposition and of government corruption will be lower. In this sense, formal education may be
seen here as a means of tempering the discrepancy between the actual levels of corruption in
particular countries in relation to the optimum levels (Dewey, 1985; Parker, 2003). Perversely, it
may also justify a lack of investment, on the part of dictatorships, in policies to promote levels of
human capital in their respective populations, as was the case with the Salazar regime in
Portugal (Carreira, 1996).
5. Conclusion
Corruption tends to be a factor in economic inefficiency, since the economic incentives for
corruption only exist when governments do not commit themselves to optimum policies.
In our work, we have aimed to study, in theoretical terms, the implications of the existence of
opposition to a government (i.e. a democracy) in relation to the corruption level of government
officials and the social welfare of a nation. To this end, we have constructed a dynamic
theoretical model in which two groups alternate between the positions of government/opposition
with probability f. We assume that the probability of the government being thrown out rises in line
with the level of inefficiency (corruption), the level of opposition activity and the level of education
of the electorate.
Human Capital and Corruption: A microeconomic model
of the bribes market with democratic contestability
Pedro Cosme Costa Vieira;
Aurora A. C. Teixeira
Using computational methods and algebraic manipulation on a reduced model, we concluded
that the freedom to create opposition leads to a fall in the level of corruption amongst
government officials (and a rise in efficiency) without, however, totally eliminating it. In addition,
the level of education (the human capital) of the electorate equates with a fall in the cost of
creating opposition, thus contributing towards a reduction in the level of corruption and
consequently a rise in economic efficiency.
Our results therefore appear to accord with the empirical stylized facts, namely that in less
democratic countries people tend to be less educated (Parker, 2003), governments only loose
power when there are very high levels of opposition and the level of development and economic
growth tends to be lower than in more «democratic» countries (Barro, 1991; Repkine, 2003).
Conversely, as a rule, the autocratic government officials benefit from obviously higher levels of
welfare and wealth than the most of the population, as well as officials in the more democratic
countries (Barro, 1994).
Junho '06 / (72/82)
82
83
References
Ades, A.; Di Tella, R. (1997) The New Economics of Corruption: A Survey and Some New
Results, Political Studies, 45, 496-515.
Aidt, T.S. (2003) Economic Analysis of Corruption: A Survey, Economic Journal, 113,
F632-F652.
Bardhan, P. (1997) Corruption and Development: A Review of Issues, Journal of Economic
Literature, 35, 1320-1346.
Barreto, R.A. (2000) Endogenous corruption in a neoclassical growth model, European
Economic Review, 44, 35-60.
Barro, R.J. (1991) Economic Growth in a Cross Section of Countries, NBER Working Papers
3120, National Bureau of Economic Research, Inc.
Barro, R.J. (1994) Democracy & Growth, NBER Working Papers 4909, National Bureau of
Economic Research, Inc.
Carreira, H. M. (1996) As políticas sociais em Portugal, in Barreto, António (org.), A Situação
Social em Portugal, 1960-1995, Lisboa, ICS-UL.
Dewey, J. (1985) Democracy and education, Carbondale, Southern Illinois University Press.
Original work published in 1916.
Fisman, R.; Gatti, R. (2002) Decentralization and Corruption: Evidence Across Countries, Journal
of Public Economics, 83, 325-345.
Fisman. R.; Svensson, J. (2002) Are Corruption and Taxation Really Harmful to Growth? Firm
Level Evidence, working paper, Columbia University.
Gibbons, M.; Johnston, R. (1974) The roles of science in technological innovation, Research
Policy, 3, 220-242.
Goel. R.K.; Nelson, M.A. (2005) Economic freedom versus political freedom: cross-country
influences on corruption, Australian Economic Papers, June, 121-133.
Jain, A.K. (2001) Corruption: A Review, Journal of Economic Surveys, 15, 71-121.
Parker, W.C. (2003) Schools Are Not Private Places Like Our Homes: Diversity, Democracy, and
Education, New Horizons for Learning, in
http://www.newhorizons.org/strategies/multicultural/parker.htm.
Repkine, A. (2003) Turkmenistan: economic autocracy and recent growth performance,
Economic Education and Research Consortium (EERC), Russian Federation.
Rose-Ackerman, S. (2002) ‘Grand’ Corruption and the Ethics of Global Business, Journal of
Banking and Finance, 26, 1889-1918.
Welch, F. (1970) Education in production, Journal of Political Economy, 78, 35-59.
Xin, X.; Rudel, T. (2004) The Context for Political Corruption: A Cross-National Analysis, Social
Science Quarterly, 85, 2, 294-309.
Baixar