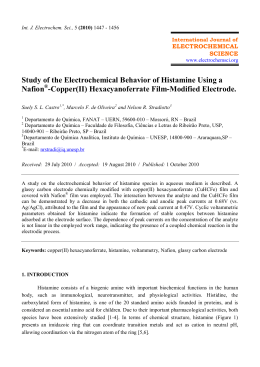
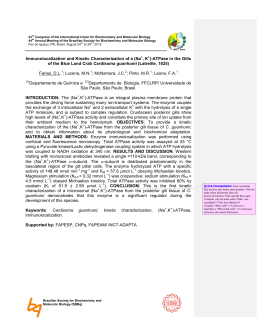
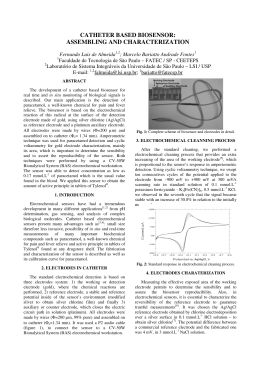
Int. J. Electrochem. Sci., 8 (2013) 658 - 669 International Journal of ELECTROCHEMICAL SCIENCE www.electrochemsci.org Determination of Mg (II) in Biodiesel by Adsorptive Stripping Voltammetry at a Mercury Film Electrode in the Presence of Sodium Thiopentone Tina R. C. Zezza, Leonardo L. Paim*, and Nelson R. Stradiotto Analytical Chemistry Department, Chemistry Institute, Universidade Estadual Paulista (UNESP), PO Box 355, 14801-970 Araraquara, SP, Brazil. * E-mail: [email protected] Received: 27 October 2012 / Accepted: 28 November 2012 / Published: 1 January 2013 A mercury film electrode was used to determine Mg (II) in biodiesel by adsorptive stripping voltammetry in presence of sodium thiopentone. A linear response was obtained for Mg (II) in the concentration range of 6.0 × 10⁻⁷ to 7.0 × 10⁻⁶ mol L-1 for SWAdSV and 8.0 × 10⁻⁷ to 9.0 × 10⁻⁶ mol L-1 for DPAdSV with detection limits of the 2.9 × 10⁻⁷ mol L-1 and 3.1 × 10⁻⁷ mol L-1, respectively. The method was applied successfully to biodiesel samples and presented goods results of accuracy with recoveries close to 100.0 % for SWAdSV and DPAdSV. Keywords: Biodiesel; Mg (II) Determination; Sodium Thiopentone; Adsorptive Stripping Voltammetry; Mercury Film Electrode 1. INTRODUCTION The substitution of diesel with biodiesel is justified mainly for environmental reasons. Fossil fuels have sulfur in their composition and when they are burned occurs the formation of sulfur oxides (SOx), which react with atmospheric oxygen (O2) and water to form sulfuric acid (H2SO4), causing the acid rain [1]. Since the biodiesel is substantially free of sulfur in its composition, its physical properties are close to fossil diesel [2] and its use is associated with the replacement of fossil fuels without the need for any modifications in diesel engines [2,3] and reduces the environmental impact of the use of internal combustion engines [2]. Biodiesel can be defined as a mono-alkyl ester of fatty acids derived from renewable sources like vegetable oils and animal fats [2,4-6] obtained through a process of transesterification, which occurs in the transformation of triglycerides in smaller molecules of fatty acid esters. Biodiesel is Int. J. Electrochem. Sci., Vol. 8, 2013 659 registered as fuel and fuel additive and can be used 100% pure (B100), mixed with diesel oil (B20), or a low proportion as an additive 1-5% [7,8]. Hardly any chemical reaction, including the transesterification, can be complete and so usually the reaction products (alkyl esters) are contaminated with other components. Some ions, such as, calcium (Ca2+) and magnesium (Mg2+), may be present in samples of biodiesel [9], due to the manufacturing process or by supplies used; the catalyst; through the wash water during the purification process of the fuel or incomplete removal of soap. Ca2+ and Mg2+ can cause corrosion, clogging motors, formation of ash in the combustion chamber and cause risk to human health and the environment, so monitoring of these elements in the fuel is of fundamental importance. The standard specifications for B100 to be mixed with petroleum diesel are established by national agencies (NAs) [4], such as ASTM D6751 (U.S.) and EN 14214 (European Union). Other countries have defined their own specifications, a specific example is that of Brazil where the standards are established by the National Petroleum Agency, Natural Gas and Biofuels (ANP), through Resolution 4/2010 [10]. A maximum level of 5 mg kg-1 of calcium and magnesium (Ca + Mg) in biodiesel has been established by ASTM and others NAs. According to literature, the spectrometric methods (emission or absorption) are the majority for analysis of alkaline and alkaline-earth metals in biodiesel, such as, optical emission spectrometry inductively coupled plasma [11-14], spectrometry atomic absorption [15-17] and atomic emission spectrometry with flame [18]. Santos [14] developed a method for determination of calcium, phosphorus, magnesium, potassium and sodium in biodiesel using the technique of optical emission spectrometry with inductively coupled plasma. The limits of detection obtained in μg g-1 were 0.03 for Ca, 0.5 for P, 0.005 for Mg, 0.3 for K and 0.1 for Na. All recoveries were in the range of 82-114% for all analytes. Due to the increasing need for analytical tests simple, fast and inexpensive for determination of important biological and chemical components in very low concentrations, the biofuels electrochemical sensors have been highlighted in recent years [19]. Some studies described the determination in biodiesel samples, such as, potassium by direct potentiometry [20,21], phosphorus by cyclic voltammetry [22,23], Cu2+ by potentiometric stripping [24], simultaneous determination of Cu2+ and Pb2+ by anodic stripping voltammetry [25], free/total glycerol by amperometry-enzymatic [26], glycerol [27] and tert-butylhydroquinone [28] by linear sweep voltammetry. However, not found any paper in the literature about the determination of Ca and Mg in biodiesel samples by electrochemical techniques. Among the others electroanalytical methods for determination of calcium and magnesium in others sample matrices [29,30] may be mentioned the method described by Zheng et al. [29] that use an ionic liquid (1-pentyl-3-methylimidazolehexafluorophosphate) in carbon paste electrode to determine calcium in capsule and urine samples. The electrochemical responses of calcium were investigated in a carbon paste electrode with ionic liquid (IL-CPE) and the traditional electrode carbon paste (CPE-T). The results showed the superiority of IL-CPE in terms of greater sensitivity, faster and better reversibility of electron transfer. The dependence of peak current was linear in the range of 8.0 × 10⁻⁷ to 1.0 × 10⁻⁴ mol L-1 with a detection limit of 4.0 × 10⁻⁷ mol L-1 by voltammetric differential pulse. Int. J. Electrochem. Sci., Vol. 8, 2013 660 Farghaly [30] used the adsorptive stripping voltammetry of square wave for indirect determination of magnesium with sodium thiopentone (TPS) in carbon paste electrode with mercury film in urine and tap water samples. TPS in alkaline medium is classified as an electroactive ligand for indirect determination of some metal ions using carbon paste electrode with mercury film. It is observed that increasing the cathodic peak current in alkaline condition was linear with increasing concentration of magnesium with a detection limit of 0.14 ppb. The mercury film electrode consists of a very thin layer of mercury electrodeposited on a conventional solid electrode, like gold, platinum, graphite or glassy carbon [25,31]. This type of electrode offers some advantages over the MDE (mercury drop electrode) like a high ratio of surface area/volume, providing a higher concentration of metal in the mixture during the deposition step, with a high sensitivity. In addition, this type of electrode may undergo vigorous stirring and coupling with flow systems, increasing its applicability in trace analysis. Given the importance of biodiesel as alternative fuel and considering that the presence of inorganic contaminants, such as magnesium, cause blockages in engines and cause risks to the environment, allied to the need to develop an alternative method to ensure a better quality of biofuels, the scope of this paper was develop a selective method using mercury film electrodes for the determination of magnesium in biodiesel using sodium thiopentone (TPS). 2. MATERIAL AND METHODS 2.1 Reagents Mercuric nitrate, potassium nitrate and sodium thiopentone (TPS) (C11H17N2NaO2S) purchased from the Merck and all other chemicals used in electrochemical experiments were of analytical-reagent grade. Milli-Q water was used to prepare all solutions. The mercury film deposited on the surface of a carbon paste electrode was obtained from a solution of 1.0 x 10⁻³ mol L-1 mercuric nitrate (II) dissolved in 0.1 mol L-1 of potassium nitrate and 0.01 mol L -1 nitric acid. The solution of TPS 1.0 x 10⁻² mol L-1 was prepared daily, just before the experiments, by dissolving 0.0132 g sodium thiopentone in Milli-Q water. Phosphate buffer solution (Na2HPO4, NaH2PO4) was prepared with final concentration of 0.05 mol L-1 and the pH of this solution was adjusted to 10.7 with NaOH 0.5 mol L-1. Standard stock solutions of magnesium and calcium 1000 mg L-1, previously standardized with EDTA and Eriochrome Black T indicator for magnesium and EDTA and Calcon indicator for calcium, were prepared by dissolving MgCl 2.6H20 and CaCl2.2H2O in MilliQ water, respectively. 2.2 Apparatus All electrochemical experiments were carried out using an Autolab PGSTAT-30 potentiostat/galvanostat controlled with the General Purpose Electrochemical System (GPES) software (Eco Chemie B.V.) equipped with a conventional three-electrode cell (25.0 mL) at room temperature. Int. J. Electrochem. Sci., Vol. 8, 2013 661 A carbon paste electrode of 3.0 mm internal diameter, Ag/AgCl electrode (Metrohm; KCl 3.0 mol L-1) and platinum wire were used as working, reference and auxiliary electrodes, respectively. 2.3 Electrode modification The carbon paste was prepared by a powder mixture of graphite (Aldrich Chemical Company) with mineral oil (Sigma-Aldrich). The slurry was homogenized (0.5 g graphite with 0.2 mL of mineral oil) and introduced into the working electrode, a copper wire was used to electrical contact. The surface of carbon paste electrode was mechanically renewed every measure. Initially, a mercury film electrode was produced on the carbon paste using conventional procedures described in literature [32] being added to the electrochemical cell 25.0 mL of mercuric nitrate in medium of 0.1 mol L-1 KNO3 and 0.01 mol L-1 of HNO3, yielding a solution of 1.0 × 10⁻³ mol L-1 mercury ions. The solution was previously deoxygenated by nitrogen gas flow for 15 min. Subsequently, a potential of -0.8 V vs. Ag/AgCl was applied for 10 min and the resulting electrical current versus time was monitored by chronoamperometry. 2.4 Electrochemical measurements After electrode modification with mercury film, it was transferred to a phosphate buffer solution (0.05 mol L-1; pH 10.7) into an electrochemical cell of 25.0 mL. Posteriorly, 45 µL of TPS 1.0 × 10⁻² mol L-1 was added, the TPS final concentration stayed equal to 3.0 × 10⁻⁵ mol L-1. Then, the solution was deaerated with N2 for 15 min. Conventional studies involving magnesium are facing difficulties in its determination, this fact is due to its very negative reduction potential (around of -2.40 V). Ali et al. [33] used techniques of adsorptive stripping voltammetry (AdSV) and demonstrated an increase in cathodic peak current of TPS in the presence of magnesium. Noting this fact, the techniques of square wave adsorptive stripping voltammetry (SWAdSV) and differential pulse adsorptive stripping voltammetry (DPAdSV) were used to indirect determination of magnesium in the presence of TPS as electroactive ligand. Electrochemical studies of AdSV were performed by scanning in the potential range of 0.0 to -0.6 V. A new mercury film was made before each new measurement. The increase in the TPS peak current was described as: Ip = IpTPS/Mg - IpTPS (Eq. 1) where, IpTPS is the response of TPS peak current; IpTPS/Mg is the response of TPS peak current in presence of a Mg concentration and Ip is the difference between them [30]. 2.5 Biodiesel samples Analyses of Mg in biodiesel samples carried out after extractions in aqueous phase (0.10 mol L1 HCl) in soybean biodiesel samples that were washed three times with 4.0 mL of HCl solution. Int. J. Electrochem. Sci., Vol. 8, 2013 662 The aqueous extracts were used to determine Mg(II) concentration in solution with pH around of 10.7. 3. RESULTS AND DISCUSSION 3.1 Electrochemical behavior of mercury film electrode in presence of TPS and Mg Figure 1. SWAdSV (A) and DPAdSV (B) in 0.05 mol L-1 phosphate buffer solution (pH 10.7) solution containing: (---) 3.0 × 10⁻⁵ mol L-1 TPS and (─) 3.0 × 10⁻⁵ mol L-1 TPS + 1.0 × 10⁻⁶ mol L-1 Mg(II). The electrochemical behavior of mercury film electrode in presence of TPS and Mg was performed in 0.05 mol L-1 phosphate buffer solution (pH 10.7) by SWAdSV (Figure 1A) and DPAdSV (Figure 1B). Figure 1A and 1B shows an increase of cathodic peak current of TPS with addition of magnesium, in a potential around of -0.31 and -0.29 V, respectively. This behavior can be attributed to the fact that the carbon paste electrode with mercury film adsorbs Mg(II)-TPS complex more strongly than the TPS [30,33]. According to literature [33], the compounds react with mercury ions generated from the mercury film electrode, to form mercury Mg-TPS complex (Eq. 2 and 3). The cathodic peak current (around -0.30 V) can be attributed to the complex reduction process accumulated onto the electrode Int. J. Electrochem. Sci., Vol. 8, 2013 663 surface. Similarly, as Ali and co-workers described [33], the bonds between mercury ions and Mg-TPS occurred through the sulfur atoms. Therefore, the determination of Mg was carried out indirectly by AdSV where the cathodic current in the stripping step corresponding to the reduction process of the Mg-TPS mercury complex (Eq. 4). Thus, the mechanism reactions can be described as: (Eq. 2) (Eq. 3) (Eq. 4) 3.2 Ca interference Figure 2. SWAdSV (A) and DPAdSV (B) in 0.05 mol L-1 phosphate buffer solution (pH 10.7) solution containing: (---) 3.0 × 10⁻⁵ mol L-1 TPS and (─) 3.0 × 10⁻⁵ mol L-1 TPS + 1.0 × 10⁻⁶ mol L-1 Ca(II). Int. J. Electrochem. Sci., Vol. 8, 2013 664 Studies the behavior of the mercury film electrode in presence of Ca(II) in the presence of the TPS were performed. The measurements were carried out in 0.05 mol L-1 phosphate buffer solution in presence of 3.0 × 10⁻⁵ mol L-1 TPS and 1.0 × 10⁻⁶ mol L-1 Ca(II) with pH 10.7. Figures 2A and 2B show the voltammograms obtained by SWAdSV and DPAdSV, respectively. As seen in Figure 2, there was no significant response in the cathodic peak current in the presence of calcium, indicating that the complex formation of Ca(II)-TPS not occurred. These results indicate the possibility of the selective determination of Mg(II) in samples of biodiesel by mercury film electrode in the presence of TPS. 3.3 Optimization of the voltammetric techniques The behavior of the mercury film in the presence of TPS and Mg(II) was studied by the technique of SWAdSV and DPAdSV. Before applying the mercury film for the study of Mg(II) determination were optimized the parameters of SWAdSV and DPAdSV for the film in 0.05 mol L-1 phosphate buffer solution (pH 10.7) in presence of 3.0 × 10⁻⁵ mol L-1 TPS and 1.0 × 10⁻⁶ mol L-1 Mg(II). Prior to analytical studies using the SWAdSV, the first parameter optimized was the frequency of application of potential pulses (f), the optimization being performed varying this parameter in the range of 20 to 100 Hz for the response of the cathodic peak current for the Mg-TPS complex. The ratio of cathodic peak current in the function of f showed a low variation of peak current for f above 60 Hz. The relationship f according to the width of half height (W1/2) showed that for f above 60 Hz there was almost no change in peak potential. Thus, a f equal to 60 Hz was chosen because it has a high value of Ip and a low value of W1/2. After the optimization step of f other parameter optimized was the pulse amplitude of potential (ESW), which were obtained voltammograms at different values of ESW in the range of 25 to 100 mV. The peak current increased with increasing of the ESW, until 50 mV, but for values above this, there was an increase in the peak width. Analyzing the voltammograms (not showed) at different values of ESW and considering the intensity of the current signal with a W1/2 the amplitude of 50 mV was chosen for further studies. Prior to analytical studies using the DPAdSV, the parameters optimized were Esw and scan rate (ν). The Esw optimization was performed in the range of 25 to 100 mV and evaluated according to the cathodic peak current and W1/2. A linear relationship between Esw and cathodic peak current was observed in the range of 25 to 75 mV, but, above values of 50 mV was observed a W1/2 increase. Therefore, Esw of 50 mV was chosen because this Esw established a good relationship between the parameters. In relation to scan rate, an increase of cathodic peak current until 10 mV s -1 was observed and from this value there is a decrease in signal intensity with an accentuated increase of W 1/2. So, the Esw and scan rate of 50 mV and 10 mV s-1, respectively, were used to the continuation of the measurements. Int. J. Electrochem. Sci., Vol. 8, 2013 665 3.4 pH behavior After optimization of the voltammetric techniques, the behavior of the mercury film electrode was studied for determination of Mg(II) in the presence of the TPS. The study of pH behavior was carried out in 0.05 mol L-1 phosphate buffer solution in presence of 3.0 × 10⁻⁵ mol L-1 TPS and 1.0 × 10⁻⁶ mol L-1 Mg(II) with pH values between 2.0 and 13.5. A low and stable electrochemical response of cathodic peak current was observed in acid solutions in the region of pH 2.0 to 6.0, above pH 6.0 the intensity of current gradually increased to pH 9.5 and then increases markedly with a maximum current at a pH of 10.7. In alkaline solutions (pH > 10.7) observed a slight decay of the current intensity, probably attributed Mg(OH)2 formation [34]. These results were consistent with the literature [30,33], which showed that different pH values of phosphate buffer solution (support electrolyte) influences the distribution of species in the medium [30]. The study showed that the pH has a significant effect on the indirect determination of magnesium, so according to the study of the pH behavior a phosphate buffer pH 10.7 was chosen for further study. 3.5 Time and potential accumulation The effect of accumulation time (tac) in the intensities of the cathodic peak current of the complex Mg(II)-TPS was studied in the range 25-300 s, using a concentration of 1.0 × 10⁻⁶ mol L-1 Mg(II) and 3.0 × 10⁻⁵ mol L-1 TPS in 0.05 mol L-1 phosphate buffer solution, pH 10.7 and an accumulation potential of 0.1 V. The intensity of the peak current increases with the accumulation time until 200 s, showing that, with a higher accumulation time a greater amount of complex adsorbs on the electrode surface and hence increases the signal obtained of current. After accumulation time of 200 s, the peak current tends to stay constant, showing that the surface area of the electrode was completely covered by the complex formed. Consequently, 200 s was used as accumulation time, since after this time, there is a saturation of the electrode surface. The influence of the accumulation potential (Eac) in the current intensities of the complex cathodic peaks was investigated in a range of -0.2 to 0.2 V. The effect of accumulation time was studied using a concentration of 1.0 × 10⁻⁶ mol L-1 Mg(II) and 3.0 × 10⁻⁵ mol L-1 TPS in 0.05 mol L-1 phosphate buffer solution, pH 10.7 and an accumulation time of 200 s. It was observed that the cathodic peaks current exhibits higher signal intensity on accumulation potential of 0.1 V, which was chosen for the other studies. 3.6 Mg concentration influence After optimized experimental conditions to formation of the Mg(II)-TPS onto surface of the mercury film electrode, the operational parameters of SWAdSV and DPAdSV and using an E ac = 0.1V and tac = 200 s, analytical curves were constructed in the range of different Mg(II) concentrations in Int. J. Electrochem. Sci., Vol. 8, 2013 666 0.05 mol L-1 phosphate buffer solution (pH 10.7) in presence of 3.0 × 10⁻⁵ mol L-1 TPS and the measurements were performed in triplicate by SWAdSV and DPAdSV. Figure 3 shows the voltammograms of mercury film electrode in different concentrations of Mg(II). Analytical curves showed a linear increase in the cathodic peak current of reduction with increasing concentration of Mg(II) in the concentration range of 6.0 × 10⁻⁷ to 7.0 × 10⁻⁶ mol L-1 for SWAdSV (Figure 3A) and 8.0 × 10⁻⁷ to 9.0 × 10⁻⁶ mol L-1 for DPAdSV (Figure 3B). Figure 3. Voltammograms of mercury film electrode in 0.05 mol L-1 phosphate buffer solution (pH 10.7) in presence of 3.0 × 10⁻⁵ mol L-1 TPS obtained by: A – SWAdSV and Mg(II) concentrations of a) 6.0 × 10⁻⁷; b) 1.0 × 10⁻⁶; c) 3.0 × 10⁻⁶ and d) 7.0 × 10⁻⁶ mol L-1. B – DPAdSV and Mg(II) concentrations of a) 8.0 × 10⁻⁷; b) 1.0 × 10⁻⁶; c) 3.0 × 10⁻⁶; d) 7.0 × 10⁻⁶ mol L-1 and e) 9.0 × 10⁻⁶ mol L-1. For SWAdSV the linear correlation between ΔIp and Mg(II) concentration follows the equation ΔIp (μA) = 1.27 × 10⁻⁷ + 1.52 × [Mg(II)] (where, [Mg(II)] = μmol L-1) with correlation coefficient of 0.9986 (n=6), amperometric sensitivity (S) of 1.52 A L mol-1 and limit of detection (LOD) of 2.9 × 10⁷ mol L-1. For DPAdSV the linear correlation between ΔIp and Mg(II) concentration follows the equation ΔIp (μA) = 1.90 × 10⁻⁷ + 1.32 × [Mg(II)] (where, [Mg(II)] = μmol L-1) with correlation coefficient of 0.9985 (n=7), amperometric sensitivity (S) of 1.32 A L mol-1 and limit of detection of 3.1 × 10⁻⁷ mol L-1. Int. J. Electrochem. Sci., Vol. 8, 2013 667 The results presented by developed electroanalytical method at this work show a satisfactory limit of detection when compared with others methods presented in literature like as spectrometric methods in biodiesel samples [11-18] and electroanalytical methods in others sample matrices [29,30]. 3.7 Biodiesel samples Figure 4. Mg (II) determination in biodiesel sample using mercury film electrode in 0.05 mol L-1 phosphate buffer solution (pH 10.7) in the presence of 3.0 × 10⁻⁵ mol L-1 TPS. A - SWAdSV and B - DPAdSV in: a) biodiesel sample; b) 0.7 and c) 1.0 µmol L-1 Mg (II). Among the methods used for the extraction of magnesium biodiesel in the literature, it is common to use an extractor solvent [22]. This enables formation of two phases, one organic and another aqueous, and magnesium is miscible in the aqueous phase. For Mg(II) analyses in biodiesel samples, extractions in aqueous phase were performed with 0.10 mol L-1 HCl, where 12.0 mL of soybean biodiesel were washed three times with 4.0 mL of HCl. The aqueous extracts were used to determine Mg(II) concentration in solution with pH around of 10.7. Int. J. Electrochem. Sci., Vol. 8, 2013 668 Figure 4 shows the determination of the concentration of magnesium present in the samples of soybean biodiesel by standard addition method using mercury film electrode in 0.05 mol L-1 phosphate buffer solution (pH 10.7) in the presence of 3.0 × 10⁻⁵ mol L-1 TPS. For SWAdSV (Figure 4A) the linear correlation between ΔIp and Mg(II) concentration follows the equation ΔIp (μA) = 4.70 × 10⁻⁷ + 3.09 × [Mg(II)] (where, [Mg(II)] = μmol L-1) with correlation coefficient of 0.9999 (n=3) and Mg(II) concentration of biodiesel in the sample analyzed was (0.152±0.001) mg.kg-1 by extrapolation of the equation from linear regression. For DPAdSV (Figure 4B) the linear correlation between ΔIp and Mg(II) concentration follows the equation ΔIp (μA) = 1.91 × 10⁻⁷ + 1.27 × [Mg(II)] (where, [Mg(II)] = μmol L-1) with correlation coefficient of 0.9998 (n=3) and Mg(II) concentration of biodiesel in the sample analyzed was (0.155±0.002) mg.kg-1 by extrapolation of the equation from linear regression. Recovery test was carried out with a biodiesel sample fortified with Mg(II) and the values found were close to 100.0 % for SWAdSV and DPAdSV (Table 1). According to the results, the proposed method was successfully applied for determination of Mg(II) in biodiesel samples. Table 1. Recovery tests for Mg (II) (n = 3). Determination in biodiesel samples. SWAdSV DPAdSV [Mg (II)]added mg L-1 0.70 1.00 0.70 1.00 [Mg (II)]found mg L-1 0.696 ± 0.058 1.003 ± 0.065 0.694 ± 0.072 1.002 ± 0.053 Recovery % 99.4 ± 8.4 100.3 ± 6.5 99.2 ± 10.4 100.2 ± 5.3 4 CONCLUSIONS A mercury film electrode was developed and applied to Mg(II) determination in presence of TPS, according to the results obtained by SWAdSV and DPAdSV the proposed method presented satisfactory values for accuracy and precision and the procedure was successfully employed in biodiesel samples. The official method of ANP, establishing maximum concentration limits, determines an amount of 5 mg.kg-1 for calcium and magnesium combined. As the concentration of Mg(II) determined by proposed method was below threshold, then the biodiesel sample showed concentration of Mg(II) satisfactory by the standard of the ANP. ACKNOWLEDGEMENTS The authors acknowledge financial support from the Fundação de Amparo à Pesquisa do Estado de São Paulo – FAPESP (Proc. 08/56980-5 and 07/07700-7) and Conselho Nacional de Desenvolvimento Científico e Tecnológico - CNPq. References 1. J.T. Cohen, Energ. Policy 33 (2005) 1709. Int. J. Electrochem. Sci., Vol. 8, 2013 669 2. M.R. Monteiro, A.R.P. Ambrozin, L.M. Lião, A.G. Ferreira, Talanta 77 (2008) 593. 3. Y.F. Lue, Y.Y. Yeh, C.H. Wu, J. Environ. Sci. Heal. A 36 (2001) 845. 4. S.K. Hoekman, A. Broch, C. Robbins, E. Ceniceros, M. Natarajan, Renew. Sust. Energ. Rev. 16 (2012) 143. 5. A. Monyem, J.H. van Gerpen, Biomass Bioenerg. 20 (2001) 317. 6. G. Knothe, J. Am. Oil Chem. Soc. 83 (2006) 823. 7. ASTM, Report n.º D6751-11b (2011). DOI: 10.1520/D6751-11B. 8. ASTM, Report n.º D7467-10 (2010). DOI: 10.1520/D7467-10. 9. CVMA – Canadian Vehicle Manufacturers' Association, March (2009). Available at: http://www.cvma.ca/eng/publications/B100_Guideline_final_26Mar09.pdf 10. ANP – National Agency of Pretroleum, Natural Gas and Biofuels. Resolution n.º 4 (02.02.2010). DOU (ISSN 1677-7042) Sect. 1, p.99 (02.03.2010). 11. E.S. Chaves, M.T.C. de Loos-Vollebregt, A.J. Curtius, F. Vanhaecke, Spectrochim. Acta B 66 (2011) 733. 12. J.R. de Souza, E.F. dos Santos, C.B. Duyck, T.D. Saint'Pierre, Spectrochim. Acta B 66 (2011) 356. 13. E.S. Chaves, E.J. dos Santos, R.G.O. Araujo, J.V. Oliveira, V.L.A. Frescura, A.J. Curtius, Microchem. J. 96 (2010) 71. 14. E.J. Santos, J. Anal. Atom. Spectrom. 22 (2007) 1300. 15. R.S. Amais, E.E. Garcia, M.R. Monteiro, J.A. Nóbrega, Fuel 93 (2012) 167. 16. F.H. Lyra, M.T.W.D. Carneiro, G.P. Brandão, H.M. Pessoa, E.V. de Castro, Microchem. J. 96 (2010) 180. 17. A. Jesus, M.M. Silva, M.G.R. Vale, Talanta 74 (2008) 1378–1384. 18. A.P. OLIVEIRA, Fuel 88 (2009) 764. 19. A.L. SANTOS, R.M. Takeuchi, P.G. Fenga, N.R. Stradiotto, in: O. Ivanov. (Ed.), Applications and Experiences of Quality Control, InTech, Rijeka (2011) 451. 20. M.S. Castilho, N.R. Stradiotto, Talanta 74 (2008) 1630. 21. P. Rapta, J. Paligova, H. Rotheneder, J. Cvengros, Chem. Pap. 61 (2007) 337. 22. T.R.C. Zezza, M.S. Castilho, N.R. Stradiotto, Fuel 95 (2012) 15. 23. L. Torrezani, A.A. Saczk, M.F. de Oliveira, N.R. Stradiotto, L.L. Okumura, Electroanal. 23 (2011) 2456. 24. E.S. Almeida, M.A.N.A. Monteiro, R.H.O. Montes, R. Mosquetta, N.M.M. Coelho, E.M. Richter, R.A.A. Muñoz, Electroanal. 22 (2010) 1846. 25. L.C. Martiniano, V.R. Abrantes, S.Y. Neto, E.P. Marques, T.C.O. Fonseca, L.L. Paim, A.G. Souza, N.R. Stradiotto, R.Q. Aucélio, G.H.R. Cavalcante, A.L.B. Marques, Fuel (2012), in press, DOI: 10.1016/j.fuel.2012.07.002. 26. T. Luetkmeyer, R.M. Santos, A.B. Silva, R.S. Amado, E.C. Vieira, E. D´Elia, Electroanal. 22 (2010) 995. 27. L.M. Lourenço, N.R. Stradiotto, Talanta 79 (2009) 92. 28. T.A. Araújo, A.M.J. Barbosa, L.H. Viana, V.S. Ferreira, Colloid. Surface. B 79 (2010) 409. 29. J. Zheng, Y. Zhang, P. Yang, Talanta 73 (2007) 920. 30. O.A. Farghaly, Talanta 63 (2004) 497. 31. N. Maleki, G. Absalan, A. Safavi, E. Farjami, Anal. Chim. Acta 581 (2007) 37. 32. A.D. Jorgensen, J.R. Stetter, Anal. Chem. 54 (1982) 381. 33. A.M.M. Ali, O.A. Farghaly, M.A. Ghandour, Anal. Chim. Acta 412 (2000) 99. 34. M.J.N. Pourbaix, Atlas of Electrochemical Equilibria in Aqueous Solutions, 2nd Edition, National Association of Corrosion Engineers, Houston (1974) 141. © 2013 by ESG (www.electrochemsci.org)
Baixar