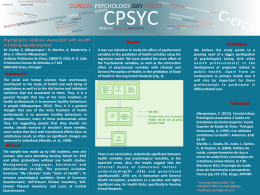
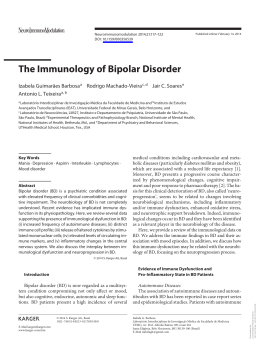
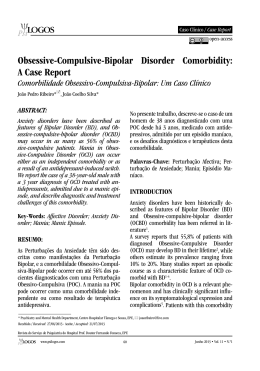
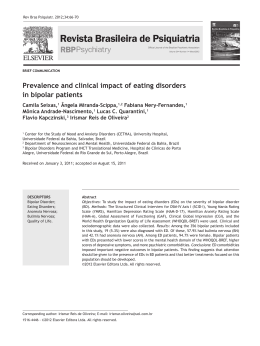
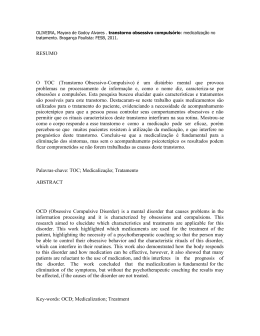
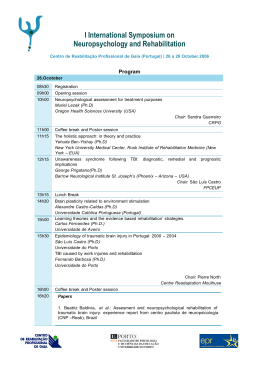
Acta Psychiatr Scand 2013: 128: 149–162
All rights reserved
DOI: 10.1111/acps.12133
© 2013 John Wiley & Sons A/S. Published by John Wiley & Sons Ltd
ACTA PSYCHIATRICA SCANDINAVICA
Meta-analysis
Neuropsychological testing of cognitive
impairment in euthymic bipolar disorder: an
individual patient data meta-analysis
€ Balanz
Bourne C, Aydemir O,
a-Martı́nez V, Bora E, Brissos S,
Cavanagh JTO, Clark L, Cubukcuoglu Z, Videira Dias V, Dittmann S,
Ferrier IN, Fleck DE, Frangou S, Gallagher P, Jones L, Kiesepp€a T,
Martı́nez-Aran A, Melle I, Moore PB, Mur M, Pfennig A, Raust A,
Senturk V, Simonsen C, Smith DJ, Bio DS, Soeiro-de-Souza MG,
Stoddart SDR, Sundet K, Sz€
oke A, Thompson JM, Torrent C, Zalla T,
Craddock N, Andreassen OA, Leboyer M, Vieta E, Bauer M,
Worhunsky PD, Tzagarakis C, Rogers RD, Geddes JR, Goodwin GM.
Neuropsychological testing of cognitive impairment in euthymic bipolar
disorder: an individual patient data meta-analysis.
Objective: An association between bipolar disorder and cognitive
impairment has repeatedly been described, even for euthymic patients.
Findings are inconsistent both across primary studies and previous
meta-analyses. This study reanalysed 31 primary data sets as a single
large sample (N = 2876) to provide a more definitive view.
Method: Individual patient and control data were obtained from
original authors for 11 measures from four common
neuropsychological tests: California or Rey Verbal Learning Task
(VLT), Trail Making Test (TMT), Digit Span and/or Wisconsin Card
Sorting Task.
Results: Impairments were found for all 11 test-measures in the bipolar
group after controlling for age, IQ and gender (Ps 0.001,
E.S. = 0.26–0.63). Residual mood symptoms confound this result but
cannot account for the effect sizes found. Impairments also seem
unrelated to drug treatment. Some test-measures were weakly
correlated with illness severity measures suggesting that some
impairments may track illness progression.
Conclusion: This reanalysis supports VLT, Digit Span and TMT as
robust measures of cognitive impairments in bipolar disorder patients.
The heterogeneity of some test results explains previous differences in
meta-analyses. Better controlling for confounds suggests deficits may be
smaller than previously reported but should be tracked longitudinally
across illness progression and treatment.
€ Aydemir3, V.
C. Bourne1,2,*, O.
Balanzá-Martínez4, E. Bora5,
S. Brissos6,7, J. T. O. Cavanagh8,
L. Clark9, Z. Cubukcuoglu10,
V. V. Dias11, S. Dittmann12,
I. N. Ferrier13, D. E. Fleck14,
S. Frangou15, P. Gallagher13,
L. Jones16, T. Kiesepp€a17,18,
A. Martínez-Aran19,*,
I. Melle20,21, P. B. Moore13,
M. Mur22, A. Pfennig23,*,
A. Raust24,*, V. Senturk25,
C. Simonsen20,26, D. J. Smith27,
D. S. Bio28, M. G. Soeiro-deSouza28, S. D. R. Stoddart16,
K. Sundet20,26, A. Sz€oke24,29,
J. M. Thompson13, C. Torrent19,*,
T. Zalla30, N. Craddock27,
O. A. Andreassen20,21,*,
M. Leboyer24,29,*, E. Vieta19,*,
M. Bauer23,*, P. D. Worhunsky1,
C. Tzagarakis1, R. D. Rogers1, J.
R. Geddes1,*, G. M. Goodwin1,*
Key words: bipolar disorder; cognitive impairment;
review; neuropsychological tests
Corin Bourne, Department of Psychiatry, University of
Oxford, Warneford Hospital, Oxford OX3 7JX, UK. Email: [email protected]
*European Network of Bipolar Research Expert Centres.
Accepted for publication March 1, 2013
Summations
• Cognitive
•
deficits are present in euthymic bipolar patients, and although some confounds may
explain part of the previously reported effect sizes, they cannot entirely explain the impairments.
Individual patient data meta-analysis has important advantages over the use of published summary
data for systematic review especially with regard to controlling for confounds.
149
Bourne et al.
Considerations
• The
•
relative lack of drug effects on neuropsychological test performance should be treated with
caution as this mega-analysis could not take into account duration or dosage of each drug treatment.
Similarly, the correlational analysis suggesting that some impairments may track illness progression
should also be treated with caution until longitudinal data supports the causality of this relationship.
1
Department of Psychiatry, University of Oxford, Oxford, 2Department of Psychology & Counselling, Newman University, Birmingham, UK, 3Department of Psychiatry, Celal Bayar
University, Manisa, Turkey, 4Service of Psychiatry, University Hospital Doctor Peset, University of Valencia, CIBERSAM, Valencia, Spain, 5Department of Psychiatry, University of
Melbourne, Melbourne, Vic., Australia, 6Lisbon’s Psychiatric Hospitalar Centre, Lisbon, Portugal, 7Janssen Pharmaceutical, Queluz de Baixo, Portugal, 8Department of
Psychological Medicine, University of Glasgow, Glasgow, 9Department of Psychology, University of Cambridge, Cambridge, UK, 10Department of Child and Adolescent Psychiatry,
LVR-Kliniken Bedburg-Hau, Bedburg-Hau, Germany, 11Bipolar Disorder Research Program, Faculty of Medicine, Hospital Santa Maria, University of Lisbon (FMUL), Lisbon,
Portugal, 12Department of Psychiatry, Ludwig-Maximilians-Universität, Munich, Germany, 13Institute of Neuroscience, Newcastle University, Newcastle upon Tyne, UK,
14
Department of Psychiatry and Behavioral Neuroscience, University of Cincinnati Academic Health Center, Cincinnati, OH, USA, 15Mount Sinai School of Medicine, NY, USA,
16
Department of Psychiatry, School of Clinical & Experimental Medicine, University of Birmingham, Birmingham, UK, 17Department of Mental Health and Substance Abuse
Services, National Institute for Health and Welfare, Helsinki, 18Department of Psychiatry, Peijas Hospital, Helsinki University Central Hospital, Vantaa, Finland, 19Institute of
Neurosciences, Hospital Clinic, University of Barcelona, IDIBAPS, CIBERSAM, Barcelona, Catalonia, Spain, 20Division of Mental Health and Addiction, Oslo University Hospital,
Ulleval, Oslo, 21Institute of Clinical Medicine, University of Oslo, Oslo, Norway, 22Psychiatry Service, Santa Maria Hospital, University of Lleida, IRBLleida, Lleida, Spain,
23
Department of Psychiatry and Psychotherapy, University Hospital Carl Gustav Carus, Technische Universität Dresden, Dresden, Germany, 24AP-HP, Service de psychiatrie,
Hôpital H. Mondor – A. Chenevier, Creteil, France, 25Department of Psychiatry, Ankara University School of Medicine, Ankara, Turkey, 26Department of Psychology, University of
Oslo, Oslo, Norway, 27Department of Psychological Medicine and Neurology, Cardiff University School of Medicine, Cardiff, UK, 28Mood Disorders Unit (GRUDA), School of
Medicine, University of Sao Paulo (HC-FMUSP), Sao Paulo, Brazil, 29Inserm, U955, Equipe 15, Creteil and 30Institut Jean Nicod? CNRS, Ecole Normale Supérieure, Paris, France
Introduction
Bipolar disorder has been associated with cognitive
impairment even in euthymia (1–4). Specific
domains of impairments include the following:
executive control (verbal and category fluency,
mental manipulation, set shifting, response inhibition), verbal learning and memory, visual memory
and attention (5–12). A subset of such deficits may
also be present in first-degree relatives of bipolar
patients indicating a possible endophenotype for
bipolar disorder (6, 7) and a starting point for
further genetic understanding of the disorder.
Some studies (10) have reported a correlation
between a subset of cognitive decrements and illness history, suggesting the competing possibility
that clinical episodes may cause impairments in the
neuronal function relevant to these domains. Such
acquired effects might be more amenable to
improved treatment. Given the important potential
implications for the neurobiology of bipolar disorder and its treatment, it is disappointing that these
claims rest on studies of modest size that allow little confidence in their individual conclusions. Replication is confused by the adoption of a too wide
range of different neuropsychological tests with
varying sensitivity to and specificity for particular
cognitive domain impairments and their neural
substrates.
Between 2006 and 2010, four papers have conducted meta-analyses on the cognitive deficits associated with bipolar disorder in purely euthymic
150
patients: Arts et al. (6); Bora et al. (7); Robinson
et al. (8) and Torres et al. (9). A fifth paper, Robinson and Ferrier (10), provided a narrative review
of studies that considered the relationship between
illness variables and cognitive deficits. Surprisingly, despite the similar aims, similar search terms
and overlapping databases used across the five
papers, they demonstrate wide variation in the primary studies chosen for inclusion and in their specific conclusions. An additional meta-analysis was
published in 2011: Mann-Wrobel et al. (12). This
paper differed from three of the earlier meta-analyses (6, 8, 9) by not supporting a differential impairment in verbal memory and executive function.
Kurtz & Gerraty (13) provided a further metaanalysis although they considered clinical groups
other than purely euthymic patients. If this study is
restricted to euthymic patients, then their metaanalysis had similar sample sizes and effect size
range to the meta-analyses reviewed in more detail
here (see Table 1). However, the authors also suggested a greater impairment was present for verbal
memory but also for non-verbal delayed memory
in contrast to other meta-analyses (6, 7).
The present study provides an independent individual patient data meta-analysis (IPDMA) of the
data from the most comparable studies included in
the previous reviews, given the authors could provide original data for pooling. IPDMA has not
been widely used in psychiatry although it is
increasingly used in medical genetics (14–16) where
it is often termed ‘mega-analysis’. It has important
Euthymic bipolar cognition: IPDMA
advantages over the use of published summary
data for systematic review (17). In particular, IPDMA allows the primary study effect sizes to be
adjusted for confounding factors (i.e. factors such
as age, education and IQ) prior to meta-analysis
and for a large data set to be analysed for drug and
illness severity effects. The latter having been previously restricted to primary studies of modest
sample size or narrative review. The adjustment
for confounding factors is especially valuable
because, although some of the primary studies
were very tightly matched case–control studies
focusing on one or two neuropsychological tests,
other included studies were more opportunistic
samples running large neuropsychological test batteries with more sample variation. In a standard
meta-analysis, the results from these two types of
study are combined without adjustment.
Aims of the study
The main aim of the study was to synthesize data
demonstrating cognitive deficits in euthymic bipolar patients in such a way as to be able to adjust
for confounding factors to provide a more definitive estimate for effects sizes than in prior metaanalyses. A secondary aim was to create a large
data set to provide a more definitive view of drug
and illness severity effects on cognitive impairments than has been possible in relative small sample primary studies. We chose to include tests that
had appeared consistently in the meta-analyses as
showing impairment and for which data were actually available for the majority of individual
patients.
Material and methods
Table 1 shows the results from the four existing
meta-analyses as the rank of the neuropsychological tests showing the largest effects in each review.
Effect sizes appear to be relatively large, but it is
striking that sample numbers vary considerably
due to the differences in criteria for study inclusion. The relative order of neuropsychological tests
when ranked by effect size is variable from analysis
to analysis partly due to the variation in study
inclusion and probably partly due to noise.
Primary data were sought that tested both euthymic bipolar patients and healthy controls (aged
18–65) on at least one of four key neuropsychological tasks identified in Table 1: i) a verbal learning
and memory task, that is, California Verbal Learning Task (CVLT) (18) or Rey Verbal Learning
Task (RAVLT) (19); ii) the Trail Making Test
(TMT) (20) as a measure of set shifting and pro-
cessing speed; iii) Digit Span [from WAIS-R Digit
Span (21)] as a non-word working memory span
task and iv) Wisconsin Card Sorting Task (WCST)
(22) as a measure of set shifting and rule discovery.
Verbal Learning Task (VLT), TMT and WCST all
appear in the International Society for Bipolar
Disorders recently recommended battery for neuropsychological assessment (23).
From the four selected neuropsychological tests,
we focused on 11 specific outcome measures: VLT
total score on trials 1–5 (Total1–5), VLT score on
Short Delay (ShortDelay), VLT score on Long
Delay (LongDelay), VLT score on Recognition
(Recognition), VLT score for Recognition minus
score for False Positives (Recog-FP); time to complete Trail Making Test A (TMTA), time to complete Trail Making Test B (TMTB); score on
Forward Digit Span (FDS), score on Reverse Digit
Span (RDS); number of categories achieved on
Wisconsin Card Sorting Task (WCSTCats.) and
number of perseverations on Wisconsin Card
Sorting Task (WCSTPersev.).
Where possible, demographic and clinical variables were also collected for each primary data
set including i) age; ii) IQ; iii) current mood; iv)
age at onset; v) number of prior manic and
depressed episodes; vi) number of prior manic
and depressed hospitalizations and vii) drug
treatment history.
Search strategy
Given the existence of five recent prior reviews in
this area (each with similar but different search
terms and inclusion/exclusion criteria), this study
did not conduct an additional full systematic
search under PRISMA (24) rules. Rather, in an
attempt to include all the primary studies that had
been in the prior reviews, all first authors of studies
appearing in the five review papers that contained
data on at least one of the four required neuropsychological tests were contacted. In addition, PsychInfo and PubMed databases were searched with
the key concepts of bipolar disorder, euthymia and
cognitive impairment to find any additional primary studies that met our criteria. These searches
were restricted to articles published between 1 January 2007 and 30 June 2010 in English language
peer-reviewed journals. In total, 45 primary studies
were identified from 41 different authors (see
Table S1). This number is smaller than may have
first appeared from the literature search as some
studies incorporated data sets used in other published studies and therefore did not constitute
mutually exclusive data sets. Of the 45 eligible published studies, full data were provided by primary
151
Bourne et al.
Table 1. Summary of the effect sizes found for neuropsychological performance of bipolar patients relative to healthy controls. Top seven effect sizes in the meta-analysis by (a)
Arts et al. (6), (b) Bora et al. (7), (c) Robinson et al. (8) and (d) Torres et al. (9)
Neuropsychological test
(a)
1
2
3
4
5
6
7
(b)
1
2
3
4
5
6
7
(c)
1
2
3
4
5
6
7
(d)
1
2
3
4
5
6
7
Cognitive domain
N (bipolar)
N (control)
Effect size
P
RDS
TMTB
WCST (Perseveration)
Category Fluency
Rey/CVLT (Delayed Recall)
Digit Symbol Subtest
Rey/CVLT (Total Recall)
Executive
Executive
Resp. Inhib
Executive
Verb. L + M
Attention
Verb. L + M
222
309
268
178
269
202
369
205
306
288
178
282
249
382
1.02
0.99
0.88
0.87
0.85
0.84
0.82
<0.0001
<0.0001
<0.0001
<0.0001
<0.0001
<0.0001
<0.0001
TMTB
Rey/CVLT (Learning)
CPT Omission
Rey/CVLT (Delayed Recall)
Stroop
Digit Symbol Subtest
RDS
Executive
Verb. L + M
Attention
Verb. L + M
Resp. Inhib
Attention
Executive
793
619
303
578
746
381
375
626
632
279
612
707
479
487
0.86
0.85
0.83
0.77
0.76
0.75
0.75
<0.0001
<0.0001
<0.0001
<0.0001
<0.0001
<0.0001
<0.0001
Category Fluency
RDS
Rey/CVLT (Total Recall)
TMTB
WCST (Perseveration)
Rey/CVLT (Short Free Recall)
Rey/CVLT (Long Free Recall)
Executive
Executive
Verb. L + M
Executive
Resp. Inhib
Verb. L + M
Verb. L + M
149
222
344
418
195
345
365
135
209
347
355
216
349
368
1.09
0.98
0.90
0.78
0.76
0.73
0.71
<0.0001
0.0031
<0.0001
<0.0001
<0.0001
<0.0001
<0.0001
Rey/CVLT (Total Recall)
Digit Symbol Subtest
Rey/CVLT (Short Delay)
CPT Hits
Rey/CVLT (Long Delay)
Stroop
WCST (Perseveration)
Verb. L + M
Attention
Verb. L + M
Attention
Verb. L + M
Resp. Inhib
Resp. Inhib
381
222
315
188
361
346
244
439
310
307
208
441
329
229
0.81
0.79
0.74
0.74
0.72
0.71
0.69
<0.0001
<0.0001
<0.0001
<0.0001
<0.0001
<0.0001
<0.0001
CPT, continuous performance task; CVLT, California Verbal Learning Task; RDS, Reverse Digit Span; Resp. Inhib, Response Inhibition; TMTB, Trail Making Test B; Verb. L + M,
Verbal Learning and Memory; WCST, Wisconsin Card Sorting Task.
authors in relation to 25 published papers (4,
25–48) with the data from the remaining 20 eligible
studies unavailable and therefore not included in
this reanalysis. Additionally, new primary data
that met our criteria were also provided in relation
to six unpublished data sets (49, 50) (A. Macritche,
manuscript in preparation; A. Varma, manuscript
in preparation; A. Pfennig, M. Alda, T. Young,
G. MacQueen, J. Rybakowski, A. Suwalska,
C. Simhandl, B. König, T. Hajek, C. O‘Donovan,
S. von Quillfeldt, D. Wittekind, J. Ploch, C. Sauer,
M. Bauer, manuscript in preparation; M.G. Soeirode-Souza & D. Soares-Bio, manuscript in
preparation), giving a total of 31 primary data sets
for this reanalysis as shown in Table 2.
Where mood scores were available, euthymia
was defined as 8 on Hamilton Depression Rating Scale (HDRS) (51) or 15 on Montgomery–
Asberg Depression Rating Scale (MADRS) (52) or
11 on Inventory of Depressive Symptomatology
(Clinician Rating; IDS-C) (53) and 8 on Young
Mania Rating Scale (YMRS) (54) or 8 on Clini152
cian Administered Rating Scale for Mania Factor
1 CARS-M(F1) (55) or 20 on Manic State Rating Scale (MSRS) (56). If no mood ratings were
available, then euthymia had been assessed by a
qualified psychiatrist only.
The total sample size for the reanalysis was
therefore 2876 participants: 1276 euthymic bipolar
patients (54.7% female) and 1609 healthy controls
(53.5% female). The bipolar patients were 83.5%
Bipolar I, 12.3% Bipolar II, 2.7% Bipolar NOS,
1.4% Schizoaffective Disorder.
Statistical analyses
Parametric statistical tests were used to compare a
variety of demographic variables between bipolar
patients and healthy controls. Where appropriate,
homogeneity of variance was checked using
Levene’s test. All continuous measures (including
depression and mania scores) were converted to
standardized z-scores within each study sample
(patients plus controls) before further analysis.
Euthymic bipolar cognition: IPDMA
Group effect size of cognitive deficits. To investigate
group (patient vs. control) effects on neuropsychological performance, group, age, IQ and gender
were regressed on to each of the 11 neuropsychological test outcome measures within each of the
31 studies. For the eight studies that did not use an
explicit measure of IQ, years of education was used
as a proxy (rp = 0.50, P < 0.001). The regression
coefficient and standard error for group within
each study were then entered for meta-analysis for
each outcome variable. Thus, the meta-analysis
was effectively performed on study group effect
sizes adjusted a priori for the confounds of age, IQ
and gender. The meta-analyses were conducted on
both fixed and random effects assumptions, but
results did not differ materially. This analysis did
not use the more standard IPDMA technique of
mixed model regression (with fixed and random
effects) as the between-study heterogeneity for
group effect size was considered too high for at
least some of the outcome measures (see Table 4).
Residual mood effects. Residual mood symptoms
(both depression and mania) could not be added to
the above analysis because they were confounded
with group. However, in an attempt to understand
how much of the group effect on performance
might be attributable to residual confounding by
mood, two further analyses were conducted. The
first approach used meta-regression, with each of
the studies ascribed a factor relating to the relative
level of residual mood symptoms in the patient
group. The second method considered mood
effects within the patient group only using mixed
model regression with data collapsed across studies. Depression scores and mania scores along with
age, IQ, gender (all fixed effects) and study (random effect) were regressed on to each of the 11
neuropsychological test outcome measures.
Drug effects within patient group. To investigate
potential drug effects within the patient group,
mixed model linear regression was used. Patients
were coded for five binary (yes/no) drug status
variables: lithium, anticonvulsants, antipsychotics,
antidepressants and drug free. Each drug status
variable (fixed effect) together with age, IQ, gender
(fixed effects) and study (random effect) was
regressed on to each of the 11 neuropsychological
test outcome measures.
Relationship between illness variables and cognitive
deficits. Mixed model linear regression was also
used to investigate potential relationships between
illness severity measures and neuropsychological
test performance within the patient group. Num-
Table 2. List of studies in reanalysis data set
Study
1
2
3
4
5
6
7
8
9
10
11
12
13
14
15
16
17
18
19
20
21
22
23
24
25
26
27
28
29
30
31
Balanza-Martinez
et al. (26)
Bora et al. (27)
Cavanagh et al. (28)
Clark et al. (29)
Cubukcuoglu &
Aydemir (49)
Dias et al. (46)
Dittmann et al. (30)
El-Badri et al. (31)
Fleck et al. (32)
Fleck et al. (33)
Frangou et al. (34)
Goswami et al. (35)
Hellvin et al. (50)*
Kaya et al. (48)
Kieseppa et al. (36)
A. Macritche
(manuscript in
preparation)
Martinez-Aran et al. (4)
Martinez-Aran et al. (37)
Mur et al. (38)
A. Pfennig, M. Alda,
T. Young, et al.
(manuscript in preparation)
Senturk et al. (39)
Simonsen et al. (25)
Simonsen et al. (47)†
Smith et al. (40)
M.G. Soeiro-de-Souza &
D. Soares-Bio
(manuscript in preparation)
Stoddart et al. (41)
Szoke et al. (42)
Thompson et al. (43)
Torrent et al. (44)
A. Varma
(manuscript in preparation)
Zalla et al. (45)
Grand total
Nbp
Ncont
41
15
26
95
39
60
101
65
19
30
51
30
20
30
50
115
116
57
51
70
86
74
228
62
140
56
65
74
30
11
22
42
37
63
43
26
28
50
42
27
40
48
44
37
165
19
114
28
69
112
89
54
39
77
43
33
30
35
46
21
56
146
204
54
134
27
29
31
21
38
29
117
173
33
96
59
145
126
73
106
19
97
63
38
53
40
48
63
35
53
58
38
20
2876
1267
1609
N
*Data set reduced from that published to exclude participants already included in
Simonsen et al. (25, 47).
†Data set reduced from that published to exclude participants already included in
Simonsen et al. (25).
ber of depressed episodes, number of manic episodes, total number of episodes, number of
depressed hospitalizations, number of manic hospitalizations, total number of hospitalizations and
illness duration were each fitted separately into the
regression model with age, IQ and gender as universal confounders (fixed effect) and study (random effect) for each of the 11 neuropsychological
test outcome measures.
Statistical analysis was conducted in R 2.12.2
(The R Foundation for Statistical Computing,
Vienna, Austria) except for the meta-analysis
which was conducted in STATA IC Version 11
(StataCorp LP., College Station, TX, USA). All
statistical tests were two-tailed.
153
Bourne et al.
Results
Table 3 shows the demographic profile of the
patient and control groups. Overall, the groups
were well matched for gender (v21 = 0.71, P = 0.40)
but showed a significant difference in age
(t2866 = 5.51, P < 0.001, d = 0.21; 95% CI,
1.57–3.30) with bipolar patients being, on average,
2.4 years older. The bipolar group also had, on
average, 0.6 fewer years of education (t2714 = 5.14,
P < 0.001, d = 0.20; 95% CI, 0.88 to 0.40) and
showed a difference in premorbid IQ on the two
IQ measures with substantial sample sizes:
National Adult Reading Test (NART) (57)/WAISR (21) (t985 = 3.87, P < 0.001, d = 0.25; 95% CI,
3.86 to 1.26) and Wechsler Abbreviated Scale
of Intelligence (WASI) (58) (t959 = 6.99, P < 0.001,
d = 0.48; 95% CI, 6.61 to 3.71). The groups
did not differ on IQ for those studies that used the
WAIS Vocabulary Subtest (18) (t179 = 1.2,
P = 0.23; 95% CI, 6.65 to 1.66) or WAIS Information Subtest (21): t54 = 1.7, P = 0.10; 95% CI,
4.41 to 0.41). One study used the Wechsler Memory Scale (WMS-R) (59) as an IQ measure which
showed a group difference (t98 = 2.31, P = 0.02,
d = 0.46; 95% CI, 14.1 to 1.1) but as this is a
memory measure and not a measure of premorbid
IQ, this difference is not surprising. It should be
noted that the last three measures were only used
in relatively small sample subsets. Overall, the data
set showed significant group differences in a range
of confounding variables reinforcing the need to
covary for these factors in any combined analysis.
This can only be done convincingly using IPDMA.
Group effect size of cognitive deficits
The patient group had large reductions in performance on all 11 outcome variables relative to controls when controlling for the effect of age, IQ and
gender. The overall effect size for group varied
between 0.63 on TMTB to 0.26 on WCSTCats.
(Table 4). The sample sizes (n in Table 4) were
substantially larger than for the meta-analyses in
Table 1a,c,d and comparable to or larger than
Table 1b. Figures 1–3 show forest plots for the
meta-analysis of the confound-adjusted group
effect sizes associated with VLT, TMT and WCST
neuropsychological tests.
The studies showed a wide range of betweenstudy heterogeneity across the 11 outcome measures, ranging from 0% to 84% (Table 4). The I2
measure of heterogeneity provides an indication of
the proportion of total variation in effect size estimates attributable to between-study heterogeneity.
I2 values of 8% for TMTA, 12% for WCSTCats.
154
Table 3. Demographics of patient and control groups
N = 2876
Age (n = 2868)
Male
Female
Years of education (n = 2716)
IQ measures
NART/WAIS (n = 1103)
WASI (n = 961)
WMS-R (n = 100)
WAIS Vocab. Subtest (n = 181)
WAIS Info. Subtest (n = 56)
Patients (N = 1267)
M (SD)
Controls (N = 1609)
M (SD)
38.8 (11.7)
569
698
12.9 (3.4)
36.4 (11.8)
748
861
13.6 (3.0)
112.4 (11.6)
107.5 (10.5)
97.4 (17.8)
44.6 (11.5)
19.4 (5.0)
114.7 (10.6)
112.6 (10.8)
105.0 (14.8)
47.1 (12.0)
21.4 (3.9)
NART, National Adult Reading Test; WAIS, Wechsler Adult Intelligence Scale;
WASI, Wechsler Abbreviated Scale of Intelligence; WMS-R, Wechsler Memory
Scale.
and 15% for VLT Recog-FP can be considered
minor; values of 39% (VLT ShortDelay), 42%
(VLTLlongDelay FDS) and 45% (WCSTPersev.)
can be considered moderate; whilst between-study
heterogeneity on VLT Total1–5 (Fig. 1), TMTB
(Fig. 2) and both FDS and RDS with I2 = 61%,
69%, 71% and 84%, respectively, was substantial
(60). Magnitude of effect size was associated with
increased heterogeneity.
Residual mood effects
The meta-regression showed that the factor relating to a study’s ability to minimize residual mood
within the patient group significantly explained the
between-study heterogeneity for two of the 11 outcome variables: TMTA regression coefficient =
0.05 (t = 2.18, P = 0.047, Adj.R2 = 100%, 95%
CI, 0.10 to 0.001) and WCSTCats. regression
coefficient = 0.07
(t =
2.78,
P = 0.018,
Adj.R2 = 100%, 95% CI, 0.12 to 0.02). None
of the other nine outcome variables were associated with significant meta-regression coefficients
(VLT Total1–5: t = 0.70, P = 0.50, 95% CI, 0.08
to 0.04; VLT ShortDelay: t = 1.10, P = 0.29, 95%
CI, 0.07 to 0.02; VLT LongDelay: t = 0.82,
P = 0.42, 95% CI, 0.07 to 0.03; VLT Recognition: t = 0.18, P = 0.86, 95% CI, 0.04 to 0.05;
VLT Recog-FP: t = 1.43, P = 0.19, 95% CI, 0.08
to 0.02; TMTB: t = 0.72, P = 0.48, 95% CI, 0.12
to 0.06; FDS: t = 0.07, P = 0.94, 95% CI, 0.09 to
0.08; RDS: t = 0.20, P = 0.84, 95% CI, 0.89 to
0.11; WCSTPersev.: t = 1.56, P = 0.15, 95% CI,
0.02 to 0.13).
The second approach to understand residual
mood effects was to consider the effect of depression score and mania score on neuropsychological
performance within the patient group only.
Depression score showed an overall main effect on
Euthymic bipolar cognition: IPDMA
Table 4. Overall effect size of group for the 11 outcome variables
Test
VLT
VLT
VLT
VLT
VLT
TMT
TMT
Digit Span
Digit Span
WCST
WCST
Outcome
variable
N (bipolar)
N (control)
Total1–5
Short Delay
Long Delay
Recognition
Recog-FP
A
B
Forward
Reverse
Categories
Perseverations
624
667
667
576
333
879
903
533
533
605
606
661
680
680
590
404
752
778
650
650
639
639
Overall effect
size (95% CI)
0.51 (0.42–0.60)
0.48 (0.39–0.57)
0.55 (0.47–0.64)
0.46 (0.36–0.57)
0.38 (0.26–0.50)
0.49 ( 0.58 to 0.40)
0.63 ( 0.72 to 0.55)
0.30 (0.20–0.40)
0.60 (0.51–0.69)
0.26 (0.15–0.37)
0.29 ( 0.40 to 0.17)
P
<0.001
<0.001
<0.001
<0.001
<0.001
<0.001
<0.001
<0.001
<0.001
<0.001
<0.001
I2 (%)
61
39
42
0
15
8
69
71
84
12
45
Recog-FP, recognition minus false positives; TMT, Trail Making Test; VLT, Verbal Learning Task; WCST, Wisconsin Card Sorting Task.
just three of 11 outcome measures (when accounting for the effect of mania, age, IQ and gender),
typically on measures of memory, speed and executive function: VLT Total1–5 effect size = 0.09,
t652 = 2.68, P = 0.008, 95% CI, 0.16 to 0.03;
VLT Recognition effect size = 0.13, t605 = 3.32,
P = 0.001, 95% CI, 0.02 to 0.05; and TMTA
effect size = 0.09, t682 = 2.62, P = 0.009, 95% CI,
0.02–0.16. Higher depression scores were related to
worse cognitive performance but the effect size was
considerably smaller than the relevant effect size
for group (see Table 4). There was no overall main
effect of mania score on any of the 11 outcome
measures (when accounting for the effect of depression, age, IQ and gender).
Drug effects within patient group
Within the patient sample, there was full information on drug treatment for 952 patients (75%) and
information on lithium status for 1122 (89%).
Thus, for comparative analysis, 652 patients were
on lithium with 470 lithium free, 337 were on anticonvulsants with 409 anticonvulsant free, 209 were
on antidepressants with 537 antidepressant free,
209 were on antipsychotics with 537 antipsychotic
free and 72 were drug free compared to 880 on at
least one drug type. The mixed model regression
analysis within the patient group suggested that
neither lithium (given effects of study, age, IQ and
gender) nor antidepressants (given effects of study,
age, IQ and gender) affected performance on any
of the 11 outcome measures (Ps > 0.1 for all effect
sizes of lithium or antidepressant status). Similarly,
anticonvulsants showed no effect on performance
(given effects of study, age, IQ and gender) on any
of the 11 outcome measures (Ps > 0.1 for all effect
sizes of anticonvulsants except for WCST Cats.
with P = 0.08). Antipsychotics (given effects of
study, age, IQ and gender) showed a reduced performance on VLT Total1–5 only (effect
size = 0.29, P = 0.006, 95% CI, 0.49 to 0.08)
of the 11 outcome measures (Ps > 0.1 for all other
effect sizes of antipsychotic status except for VLT
ShortDelay and VLT LongDelay both with
P = 0.08 and WCSTPersev. with P = 0.09). Being
drug free improved performance (given effects of
study, age, IQ and gender) relative to any drug on
two of the 11 outcome measures: VLT Total1–5
(effect size = 0.39, P = 0.010, 95% CI, 0.69 to
0.09) and VLT LongDelay (effect size = 0.35,
P = 0.017, 95% CI, 0.64 to 0.06; Ps > 0.1 for
all other effect sizes of drug-free status).
Relationship between illness variables and cognitive deficits
Table 5 shows the illness characteristics of the
patient sample. The mixed model regression analysis within the patient group suggested that some of
these illness variables correlated at better than
chance with some of the 11 outcome variables
(eight out of 66) but effects were generally small.
Thus, number of manic episodes affected performance on three of the outcome measures (given
effects of study, age, IQ and gender): VLT ShortDelay (effect size = 0.07, P = 0.03, 95% CI,
0.14 to
0.01); VLT LongDelay (effect
size = 0.09, P = 0.007, 95% CI, 0.16 to 0.03);
and TMTA (effect size = 0.09, P = 0.03, 95% CI,
0.01–0.17). Number of total episodes only affected
performance on TMTA (effect size = 0.08,
P = 0.03, 95% CI, 0.01–0.15). Number of depressive episodes had no main effects. Number of
depressive hospitalizations also only affected performance on TMTA (effect size = 0.26, P = 0.003,
95% CI, 0.09–0.42) whilst number of total hospitalizations affected performance on TMTA (effect
size = 0.12, P = 0.008, 95% CI, 0.03–0.21), TMTB
(effect size = 0.13, P = 0.005, 95% CI, 0.04–0.21)
and WCSTCats. (effect size = 0.12, P = 0.01,
95% CI, 0.21 to 0.03). Number of manic hospitalizations had no main effects. Thus, of the four
155
Bourne et al.
(a) VLT Total1-5
(b) VLT ShortDelay
Study
ID
ES (95% CI)
%
Weight
Study
ID
ES (95% CI)
%
Weight
6.29
Bora et al 2007
0.48 (0.14, 0.82)
6.83
Bora et al 2007
0.62 (0.27, 0.97)
Cavanagh et al 2002
0.90 (0.36, 1.44)
2.69
Cavanagh et al 2002
0.80 (0.22, 1.39)
2.31
0.58 (0.13, 1.02)
3.92
Clark et al 2002
0.75 (0.29, 1.21)
3.74
Clark et al 2002
Cubukcuoglu & Aydemir
0.62 (0.27, 0.96)
6.53
Cubukcuoglu & Aydemir
0.54 (0.19, 0.88)
Fleck et al 2003
0.98 (0.40, 1.57)
2.30
Goswami et al 2006
0.76 (0.36, 1.16)
4.87
Hellvin et al
0.05 (–0.23, 0.34)
9.86
Kieseppa et al 2005
0.43 (0.06, 0.81)
5.55
Martinez-Aran et al 2004
0.58 (0.16, 0.99)
4.64
Martinez-Aran et al 2007
0.56 (0.20, 0.93)
5.85
Mur et al 2007
0.06 (–0.34, 0.46)
4.87
6.66
Fleck et al 2003
0.76 (0.15, 1.37)
2.12
Goswami et al 2006
0.39 (–0.04, 0.82)
4.21
Hellvin et al
0.22 (–0.07, 0.51)
9.43
3.34
Kaya et al 2007
0.98 (0.49, 1.46)
Kieseppa et al 2005
0.44 (0.04, 0.84)
Martinez-Aran et al 2004
0.47 (0.07, 0.88)
4.76
Martinez-Aran et al 2007
0.34 (–0.02, 0.69)
6.22
Mur et al 2007
–0.05 (–0.46, 0.35) 4.76
Pfenning et al
0.18 (–0.37, 0.72)
Simonsen et al 2008
0.11 (–0.28, 0.50)
5.15
Simonsen et al 2011
0.39 (0.05, 0.72)
7.05
4.85
Pfenning et al
–0.14 (–0.64, 0.36) 3.15
Simonsen et al 2008
0.02 (–0.35, 0.39)
5.73
Simonsen et al 2011
0.55 (0.22, 0.89)
6.91
Smith et al 2006
1.00 (0.50, 1.50)
3.15
Smith et al 2006
0.88 (0.36, 1.39)
2.95
Stoddart et al 2007
0.80 (0.24, 1.35)
2.52
Stoddart et al 2007
0.86 (0.33, 1.40)
2.78
Thompson et al 2005
0.58 (0.28, 0.87)
8.85
Thompson et al 2005
0.53 (0.22, 0.84)
8.06
Torrent et al 2006
0.75 (0.36, 1.14)
5.06
Torrent et al 2006
0.52 (0.15, 0.88)
5.77
Varma et al
0.85 (0.51, 1.19)
6.91
Varma et al
0.84 (0.50, 1.18)
6.73
Overall (I-squared = 61.1%, p = 0.000)
0.51 (0.42, 0.60)
100.00
Overall (I-squared = 39.1%, p = 0.038)
0.48 (0.39, 0.57)
100.00
–1.57
0
–1.46
1.57
0
2.64
1.46
(d) VLT Recognition
(c) VLT LongDelay
Study
ID
ES (95% CI)
%
Weight
Bora et al 2007
Study
ID
ES (95% CI)
%
Weight
0.50 (0.16, 0.84)
6.65
Cavanagh et al 2002
0.91 (0.32, 1.49)
2.25
Bora et al 2007
0.45 (0.07, 0.82)
7.95
Clark et al 2002
0.28 (–0.18, 0.75) 3.59
Cavanagh et al 2002
0.61 (0.02, 1.20)
3.19
Cubukcuoglu & Aydemir
0.68 (0.35, 1.01)
7.22
Clark et al 2002
0.36 (–0.10, 0.82)
5.26
Fleck et al 2003
0.66 (0.02, 1.30)
1.88
Cubukcuoglu & Aydemir
0.36 (–0.01, 0.73)
8.21
Goswami et al 2006
0.49 (0.07, 0.92)
4.24
Fleck et al 2003
–0.39 (–1.08, 0.31)
2.35
Hellvin et al
0.17 (–0.12, 0.47) 8.95
Kaya et al 2007
0.62 (0.14, 1.11)
4.84
Kaya et al 2007
1.16 (0.72, 1.60)
3.98
Kieseppa et al 2005
0.64 (0.24, 1.03)
4.89
Kieseppa et al 2005
0.31 (–0.13, 0.74)
6.00
Martinez-Aran et al 2004
0.62 (0.21, 1.02)
4.70
Martinez-Aran et al 2004
0.55 (0.09, 1.01)
5.31
Martinez-Aran et al 2007
0.57 (0.21, 0.92)
6.15
Martinez-Aran et al 2007
0.50 (0.11, 0.90)
7.11
Mur et al 2007
0.29 (–0.10, 0.69) 4.94
Mur et al 2007
0.26 (–0.19, 0.71)
5.59
Pfenning et al
0.02 (–0.53, 0.56) 2.59
Pfenning et al
0.32 (–0.34, 0.97)
2.64
Simonsen et al 2008
0.17 (–0.21, 0.56) 5.14
Simonsen et al 2008
0.25 (–0.15, 0.65)
6.98
Simonsen et al 2011
0.67 (0.35, 0.99)
7.58
Simonsen et al 2011
0.50 (0.16, 0.85)
9.57
Smith et al 2006
0.80 (0.27, 1.32)
2.83
Smith et al 2006
0.72 (0.21, 1.23)
4.34
Stoddart et al 2007
1.06 (0.51, 1.61)
2.57
Thompson et al 2005
0.52 (0.21, 0.84)
7.97
Torrent et al 2006
0.71 (0.34, 1.09)
5.58
Varma et al
0.70 (0.35, 1.06)
6.29
Overall (I-squared = 41.9%, p = 0.026)
0.55 (0.47, 0.64)
100.00
–1.61
0
Stoddart et al 2007
0.71 (0.13, 1.28)
3.37
Thompson et al 2005
0.57 (0.25, 0.90)
10.64
Torrent et al 2006
0.72 (0.31, 1.13)
6.65
Overall (I-squared = 0.0%, p = 0.651)
0.46 (0.35, 0.57)
100.00
–1.28
1.61
0
1.28
(e) VLT Recog–FP
%
Study
ID
ES (95% CI)
Weight
Bora et al 2007
0.43 (0.06, 0.79)
10.13
Cavanagh et al 2002
0.68 (0.08, 1.28)
3.68
Cubukcuoglu & Aydemir
0.36 (0.01, 0.71)
10.70
Fleck et al 2003
0.09 (–0.57, 0.75)
3.03
Hellvin et al
0.14 (–0.16, 0.44)
15.00
Kieseppa et al 2005
0.46 (0.04, 0.87)
7.79
Mur et al 2007
0.51 (0.09, 0.93)
7.50
Pfenning et al
–0.04 (–0.67, 0.59)
3.36
Simonsen et al 2008
0.11 (–0.29, 0.50)
8.58
Simonsen et al 2011
0.48 (0.15, 0.81)
12.28
Smith et al 2006
0.89 (0.37, 1.40)
5.05
Thompson et al 2005
0.49 (0.17, 0.82)
12.89
Overall (I-squared = 14.6%, p = 0.301)
0.38 (0.26, 0.50)
100.00
–1.4
0
1.4
Fig. 1. Forest plots showing the main effect of group (accounting for effect of age, IQ and gender) for the five outcome variables
associated with Verbal Learning Task (VLT).
156
Euthymic bipolar cognition: IPDMA
(a) TMTA
(b) TMTB
Study
ID
ES (95% CI)
%
Weight
Study
ID
ES (95% CI)
%
Weight
Balanza-Martinez et al 2005
–0.41 (–1.11, 0.29)
1.69
Balanza-Martinez et al 2005
–0.71 (–1.39, –0.03)
1.57
Bora et al 2007
–0.56 (–0.90, –0.21)
6.89
Bora et al 2007
–0.69 (–1.02, –0.36)
6.78
Cubukcuoglu & Aydemir
–0.08 (–0.47, 0.32)
5.45
Cubukcuoglu & Aydemir
–0.32 (–0.69, 0.04)
Dias et al 2009
–0.42 (–0.76, –0.09)
7.30
Dias et al 2009
–0.56 (–0.90, –0.23)
6.62
Dittman et al 2007
–0.30 (–0.59, –0.01)
8.63
El-Badri et al 2001
–0.60 (–1.12, –0.09)
Goswami et al 2006
–1.42 (–1.69, –1.15)
9.65
Macritchie et al
–0.54 (–0.96, –0.12)
4.05
Martinez-Aran et al 2004
–0.49 (–0.90, –0.07)
4.13
Martinez-Aran et al 2007
–0.43 (–0.79, –0.06)
5.53
Mur et al 2007
–0.49 (–0.79, –0.19)
8.08
Smith et al 2006
–1.27 (–1.71, –0.83)
3.77
Soeiro-de-Souza & Soares-Bio
–0.42 (–0.83, –0.01)
4.33
Stoddart et al 2007
–0.67 (–1.16, –0.18)
3.05
Szoke et al 2006
–0.64 (–0.98, –0.31)
6.47
5.41
Dittman et al 2007
–0.26 (–0.58, 0.05)
8.33
Goswami et al 2006
–0.49 (–0.89, –0.09)
5.14
Macritchie et al
–0.05 (–0.59, 0.49)
2.85
Martinez-Aran et al 2004
–0.84 (–1.22, –0.47)
5.92
Martinez-Aran et al 2007
–0.68 (–1.03, –0.32)
6.66
Mur et al 2007
–0.44 (–0.77, –0.12)
7.83
Smith et al 2006
–0.17 (–0.73, 0.39)
2.66
Soeiro-de-Souza & Soares-Bio
–0.37 (–0.75, 0.02)
5.56
Stoddart et al 2007
–0.52 (–1.02, –0.02)
3.32
Szoke et al 2006
–0.68 (–1.00, –0.36)
8.12
Thompson et al 2005
–0.50 (–0.82, –0.18)
8.02
Thompson et al 2005
–0.32 (–0.64, 0.01)
6.95
Torrent et al 2006
–0.71 (–1.10, –0.33)
5.62
Torrent et al 2006
–0.50 (–0.91, –0.09)
4.33
Varma et al
–0.61 (–0.95, –0.27)
7.30
Varma et al
–0.82 (–1.15, –0.49)
6.62
2.71
Zalla et al 2004
–0.46 (–1.24, 0.33)
1.34
Zalla et al 2004
–0.78 (–1.52, –0.04)
1.33
Overall (I-squared = 8.4%, p = 0.355)
–0.49 (–0.58, –0.40)
100.00
Overall (I-squared = 68.6%, p = 0.000)
–0.63 (–0.72, –0.55)
100.00
–1.24
0
1.24
–1.71
0
1.71
Fig. 2. Forest plots showing the main effect of group (accounting for effect of age, IQ and gender) for the two outcome variables
associated with Trail Making Test (TMTA and TMTB).
(a) WCSTCats.
(b) WCSTPersev
Study
ID
ES (95% CI)
3.33
Balanza-Martinez et al 2005
–0.72 (–1.27, –0.17) 4.04
8.25
Bora et al 2007
–0.47 (–0.86, –0.08) 8.02
8.42
Cubukcuoglu & Aydemir
Study
ID
ES (95% CI)
%
Weight
Balanza-Martinez et al 2005
0.71 (0.10, 1.32)
Bora et al 2007
0.54 (0.15, 0.93)
Cubukcuoglu & Aydemir
0.40 (0.01, 0.78)
%
Weight
–0.23 (–0.62, 0.17)
8.02
Fleck et al 2008
0.17 (–0.32, 0.67)
4.96
Fleck et al 2008
–0.18 (–0.69, 0.34)
4.61
Frangou et al 2005
0.64 (0.19, 1.09)
5.95
Frangou et al 2005
–0.20 (–0.69, 0.29)
5.22
Kieseppa et al 2005
0.12 (–0.33, 0.57)
6.11
Kieseppa et al 2005
–0.31 (–0.75, 0.13)
6.28
Martinez-Aran et al 2004
0.16 (–0.29, 0.62)
5.90
Martinez-Aran et al 2004
–0.51 (–0.95, –0.06) 6.23
Martinez-Aran et al 2007
0.07 (–0.30, 0.44)
8.97
Martinez-Aran et al 2007
–0.41 (–0.77, –0.04) 9.28
Melle et al
0.17 (–0.30, 0.63)
5.75
Melle et al
0.04 (–0.41, 0.50)
6.02
Mur et al 2007
0.24 (–0.17, 0.66)
7.19
Mur et al 2007
–0.27 (–0.69, 0.15)
6.94
Senturk et al 2007
0.36 (–0.13, 0.85)
5.12
Senturk et al 2007
–0.48 (–0.95, –0.01) 5.62
Simonsen et al 2011
–0.16 (–0.86, 0.54)
2.50
Simonsen et al 2011
0.10 (–0.62, 0.82)
2.38
Soeiro-de-Souza & Soares-Bio
–0.18 (–0.57, 0.20)
8.34
Soeiro-de-Souza & Soares-Bio
0.52 (0.12, 0.92)
7.71
Szoke et al 2006
0.37 (0.03, 0.72)
10.22
Szoke et al 2006
–0.42 (–0.76, –0.08) 10.48
Torrent et al 2006
0.13 (–0.30, 0.56)
6.68
Torrent et al 2006
Zalla et al 2004
0.51 (–0.22, 1.25)
2.29
Zalla et al 2004
–0.70 (–1.46, 0.06)
Overall (I-squared = 11.7%, p = 0.319)
0.26 (0.15, 0.37)
100.00
Overall (I-squared = 44.7%, p = 0.028)
–0.29 (–0.40, –0.17) 100.00
–1.32
0
1.32
–0.48 (–0.90, –0.06) 7.01
–1.46
0
2.13
1.46
Fig. 3. Forest plots showing the main effect of group (accounting for effect of age, IQ and gender) for the two outcome variables
associated with Wisconsin Card Sorting Task (WCSTCats. and WCSTPersev.).
illness variables that affected cognitive performance, TMTA was affected by all four.
Discussion
This analysis of individual patient data across the
31 studies provides further evidence that euthymic
bipolar patients exhibit moderate cognitive impairments on a range of standard neuropsychological
tests. Cognitive deficits remain significant even
after controlling for key baseline factors such as
age, IQ and gender that are known to affect neuropsychological test performance. The current level
of minor depressive symptoms and the effects of
some drug treatments may contribute to these
effects but cannot explain them. Thus, there is significant residual cognitive impairment associated
Table 5. Clinical indices of the patient group
Age at onset (n = 1129)
Illness duration (n = 1104)
No. of depressive episodes (n = 992)
No. of manic episodes (n = 989)
Total no. of episodes (n = 1115)
No. of depressive hospitals (n = 271)
No. of manic hospitals (n = 271)
Total no. of hospitalisations (n = 806)
Patients
M (SD)
Range
25.0 (8.7)
13.8 (9.9)
5.6 (10.7)
3.4 (4.5)
11.6 (19.8)
0.6 (1.4)
1.4 (2.3)
2.9 (3.8)
6–60
0–51
0–100
0–88
0–200
0–10
0–15
0–40
with bipolar disorder over and above the known
confounding factors.
The effect sizes for such deficits were lower
(0.26–0.63) than those reported in prior meta-anal157
Bourne et al.
yses (6–8, 10) (ds = 0.5–1.0). This reduction in
observed effect sizes is in part due to controlling
better for the effect of age, IQ and gender. However, we were also able to include unpublished
studies which often had the lowest effect sizes [e.g.
Hellvin et al. (50) and A. Pfennig, M. Alda, T.
Young, et al. (manuscript in preparation) for VLT
Total1–5, LongDelay and Recog-FP; Cubukcuoglu & Aydemir (49) and A. Macritche (manuscript
in preparation) for TMTA and TMTB; A. Varma
(manuscript in preparation) for FDS and RDS;
M.G. Soeiro-de-Souza & D. Soares-Bio (manuscript in preparation) for WCSTCats.; and Hellvin
et al. (50) and M.G. Soeiro-de-Souza & D. SoaresBio (manuscript in preparation) for WCSTPersev.]. This suggests the field has had some
impact from publication bias, which perhaps is
unsurprising.
Specifically, the following effect sizes were found
(compared to prior studies) in the following cognitive domains: i) verbal memory – Total Score effect
size = 0.51 (prior studies = 0.90–0.81), Short
Delay effect size = 0.48 (prior studies = 0.85–0.73),
Long Delay effect size = 0.55 (prior studies = 0.85–0.71), Recognition effect size = 0.46
(prior study = 0.43), Recog-FP effect size = 0.38;
ii) visual scanning speed – TMTA effect size = 0.49
(prior studies = 0.82–0.60); iii) working memory
capacity – FDS effect size = 0.30 (prior studies = 0.47–0.37); iv) executive function – TMTB
effect size = 0.63 (prior studies = 0.99–0.55), RDS
effect size = 0.60 (prior studies = 1.02–0.54),
WCSTCats. effect size = 0.26 (prior studies = 0.69–0.52); v) response inhibition = WCSTPersev. = 0.29 (prior studies = 0.88–0.70).
The high heterogeneity of some tests appears
to underlie the differences in the results of prior
meta-analyses. The variation in effect sizes
between the previously published meta-analysis
(Table 1) is likely to have been due to variations
in the studies included. In turn, the range of
effect sizes produced by including a different subset of studies can be directly explained by the relatively high level of heterogeneity revealed in this
sample by our analysis (typically 39–84%; see
Table 4) especially for some tests. The test with
the most heterogeneity in this analysis was
TMTB. TMTB is known to have considerable
variability across test sites (61), thus there
appears to be a strong case for trying to refine
the operationalization of TMTB as well as VLT
(encoding and short term recall) and Digit Span
(Forward and Reverse). Each test taps domains
of function markedly impaired in bipolar patients
as shown by the large average effect sizes. One
important possibility would be to present them in
158
more standardized computerized formats locally
or even on line.
Nevertheless, the group effect sizes allow confidence that a substantial average effect is present
for the domains of attention/working memory,
verbal memory, speed and executive function. It is
somewhat easier to say what cannot explain these
effects, than to say what can. Residual mood
symptoms within the patient group were understandably confounded with group. However, our
analysis suggests that residual symptom scores in
the patient group cannot explain much of the difference found between the groups across the various tests. Cognitive deficits are also not simply
explained as side-effects of drug therapy. This has
previously been the subject of debate; some studies
suggesting that antipsychotic drugs may cause
some cognitive impairment (62, 63) and others suggesting no drug effect on cognitive performance
(64). The present analysis suggests that most neuropsychological tests do not exhibit any significant
effect attributable to drug treatment. The only possible exception is on measures of verbal memory
with antipsychotics having an impairing effect on
VLT Total1–5 and drug-free status being associated with improved performance on VLT Total1–5
and LongDelay (relative to any drug). However,
any potential implied drug effects must be treated
with caution due to the potential for confounding
by indication. For example, a history of psychosis
may be related to specific working memory impairments (65–67), and those with a history of psychosis are also likely to be those currently taking
antipsychotics (68). We could not analyse the effect
of polypharmacy, which is common in clinical
samples, but not in these research samples. It is
likely that there was a deliberate effort to exclude
symptomatic and heavily medicated patients from
these studies given the intention was usually to
reduce the confounds between the patient and
control groups.
If illness course had had a negative impact on
cognition, it would potentially be a key finding; it
could imply that neuropsychological outcome
measures are sensitive to treatment. In a partial
support of this hypothesis, some of the neuropsychological measures correlated with illness intensity variables, for example number of manic
episodes appears to affect performance on certain
VLT measures, whilst TMTA appears to be especially sensitive to potential illness progression
effects. However, the magnitude of these associations may be unreliable for various reasons. First,
the impact of illness may not be simply cumulative,
and the largest effects may occur early in the illness
course, as appears likely in schizophrenia (69).
Euthymic bipolar cognition: IPDMA
Second, measures of illness severity that depend on
counting episodes in mature samples of patients
are of uncertain validity. Quantifying depressive
episodes when so much of the depressive burden of
bipolar disorder is chronic, subsyndromal and
poorly recalled is questionable; indeed, we found
no associations with number of depressive episodes. Positive findings for more memorable
events, like manic episodes and numbers of hospitalizations, appear more likely to be valid and did
produce some significant results in this analysis.
The hypothesis that much of the apparent cognitive impairment of bipolar disorder is attributable
to the accumulated impact of the illness course
remains plausible but not proven by the present
study. Only adequately powered prospective
studies in early stages of illness will establish the
effect beyond doubt.
Although the range in effect sizes reported here
appears to support previous suggestions that executive function and memory may be especially
affected in bipolar disorder (6, 8, 9), it is also notable that all of the effect sizes reported here could be
considered to be small to medium (70) in magnitude across all the cognitive domains investigated.
Our results could therefore also be interpreted as
being consistent with the notion of cognitive
impairment in bipolar disorder being a relatively
non-specific effect on multiple functional brain networks. This can be related to similarly non-specific
imaging findings suggesting lateral ventricle
enlargement (effect size = 0.39) and increased rates
of deep white matter hyperintensities without grey
matter volume decrements (71) in the many imaging studies conducted in bipolar patients.
Although these structural abnormalities can be
greater in older patients they are also found in
samples of similar mean age as the sample in this
study (71). The evolving evidence for widely distributed disturbances in white matter structure
from diffusion tensor imaging is also supportive of
an underlying functional neuropathology (72).
Although its aetiology remains poorly understood,
a contribution from intracellular mechanisms regulating oxidative stress is one hypothesis that is
assuming increasing importance (73). Given the
putative neuroprotective effects of lithium (74, 75),
an improved cognitive performance for those
patients taking lithium relative to those lithium
free might have been expected. However, no such
effect was found; either because lithium does not
enhance cognitive performance or because any
neuroprotective effect is dependent upon factors,
such as chronic use, which could not be estimated
in this dataset. In support of the former ‘ineffective
hypothesis’, two recent longitudinal cohort studies
indicate that deficits are stable despite long-term
lithium therapy (76, 77).
As with all analyses of neuropsychological performance, this study’s findings and conclusions are
limited by the reliability, validity and psychometric
properties of the individual neuropsychological
tests. The high levels of heterogeneity found in this
study and the previous standard meta-analyses
(6–9, 12, 13) for some measures highlight the need
for standardization in test presentation to try and
meet this limitation. Indeed, the high levels of heterogeneity consistently found for some measures
raises the question as to whether it is meaningful to
combine them in a meta-analysis at all. This study
is also limited by the response bias of authors allowing access to their primary data sets. Furthermore,
it is acknowledged that this study considered outcome measures from a relatively small number of
neuropsychological tests. However, despite being
limited to those primary studies that consented to
provide data, and partly because the analysis was
limited to the most frequently used neuropsychological tests, this study contained sample sizes substantially greater than many of the prior standard
meta-analyses and thus represents a major data
synthesis. Furthermore, by using IPDMA (rather
than standard meta-analysis) this study was both
able to i) provide the least confounded estimates of
the effect size relating to cognitive impairment in
euthymic bipolar patients and ii) provide the first
analysis of potential medication and illness severity
effects on neuropsychological performance in a
statistically valuable sample size.
In summary, this reanalysis provides further
evidence that euthymic bipolar patients exhibit
significant cognitive impairment on a range of
neuropsychological tests. These impairments
remain substantial but less than previous work
(including previous meta-analyses) has suggested
(1–4, 6–10). The advantage of IPDMA in controlling for a greater range of confounding factors
and the inclusion of unpublished studies accounts
for this. The impairment effect appears largely
independent of drug treatment. Performance on
some neuropsychological tests appears to have
deteriorated further as illness progressed (i.e.
number of episodes increased) but longitudinal
data from earlier in the illness course are needed
to show that the relationship is causal and clinically important. Finally, this review and reanalysis
has highlighted the variability and heterogeneity
between individual primary studies. This means
the field remains polarized between the certainty
that cognitive impairment is a feature of bipolar
disorder and uncertainty, for example about its
heritability, specificity or the impact of illness
159
Bourne et al.
intensity. Specific and correct findings on the latter
may be reasonably based on studies that are well
conducted but too small for confidence and too
subtle to be replicated in cohorts of convenience.
On the other hand, small studies can always generate false positives findings, and this is too often
forgotten in the field (78). The present result, from
a study sample larger than the samples reported in
three of the previous meta-analyses of published
data sets, may well be giving us the true picture. A
clear goal for future research is operationally to
refine all test procedures and variables being measured to reduce heterogeneity and combine data
prospectively across centres to obtain the necessary
power essential to statistical confidence.
Acknowledgements
This paper was partially supported by a Seventh Framework
Programme grant from the European Union to the European
Network of Bipolar Research Expert Centres (ENBREC),
Grant No. Health-F2-2009-223102.
Declaration of interest
Drs. Bora, Bourne, Craddock, Cubukcuoglu, Dittmann, Fleck,
Gallagher, Geddes, Jones, Kiesepp€
a, Leboyer, Martınez-Aran,
Melle, Moore, Mur, Raust, Rogers, Senturk, Simonsen, Soares-Bio, Smith, Soeiro-de-Souza, Sundet, Sz€
oke, Thompson,
Torrent, Tzagarakis, Worhunsky and Zalla declare that they
have no conflicts of interest over the past 2 years. Dr. Andreassen has received speakers’s honorarium from Lilly, Lundbeck
and GSK. Dr. Clark is a consultant for Cambridge Cognition
Ltd. Dr. Aydemir has participated in a clinical trial sponsored
by AstraZeneca, received speaker honoraria from Lundbeck,
AstraZeneca, Janssen-Cilag and Pfizer and consultant for Servier. Dr Balanz
a-Martınez has received grants and served as
consultant, advisor or CME speaker from Angelini, AstraZeneca, Bristol-Myers-Squibb, Grunenthal, Janssen, Juste, the
Spanish Ministry of Science and Innovation (CIBERSAM)
and ′Fundaci
on Alicia Koplowitz′. Dr. Bauer has received
grant/research support from The Stanley Medical Research
Institute, NARSAD, Deutsche Forschungsgemeinschaft and
the European Commission (FP7). He is a consultant for
Alkermes, AstraZeneca, BristolMyers Squibb, Ferrer Internacional, Janssen, Lilly, Lundbeck, Otsuka, Servier, Takeda. Dr.
Bauer has received speaker honoraria from AstraZeneca,
BristolMyers Squibb, GlaxoSmithKline, Lilly, Lundbeck,
Otsuka. Pfizer. Dr. Brissos has been working full time as
Medical Affairs Manager for Janssen Pharmaceutical. Dr.
Cavanagh has received investigator-originated research grant
funding from Pfizer and Biogen IDEC. Dr. Dias is consultant
for Angelini Pharmaceutical, Portugal and has received educational grants from Lundbeck, Sanofi-Aventis, AstraZeneca
and Bristol-Myers Squibb. Dr. Ferrier has received speaker
honoraria for lectures given at educational meetings sponsored
by Astra Zeneca and Organon. Dr. Frangou has participated
in advisory boards for Janssen-Cilag and Ferrer Grupo
and has been a speaker for Janssen-Cilag. Dr. Goodwin
has received grants/research support, consulting fees and
honoraria from AstraZeneca, Bristol-Myers Squibb, Eisai,
Eli Lilly, Lundbeck, P1Vital, Servier, Takeda and Teva. Dr.
Pfennig has received research support and speaker honoraria
160
from AstraZeneca. Dr. Stoddart currently works for a consultancy firm that has pharmaceutical companies among its clients. Dr. Vieta has received grants and served as consultant,
advisor or CME speaker for the following entities: Adamed,
Alexza, Almirall, AstraZeneca, Bial, Bristol-Myers Squibb,
Elan, Eli Lilly, Ferrer, Forest Research Institute, Gedeon
Richter, Glaxo-Smith-Kline, Janssen-Cilag, Jazz, Johnson &
Johnson, Lundbeck, Merck, Novartis, Organon, Otsuka,
Pfizer, Pierre-Fabre, Qualigen, Roche, Sanofi-Aventis, Servier,
Shering-Plough, Shire, Solvay, Sunovion, Takeda, Teva, the
Spanish Ministry of Science and Innovation (CIBERSAM),
the Seventh European Framework Programme (ENBREC),
the Stanley Medical Research Institute, United Biosource
Corporation and Wyeth.
References
1. Bearden CE, Hoffman KM, Cannon TD. The neuropsychology and neuroanatomy of bipolar affective disorder:
A critical review. Bipolar Disord 2001;3:106–150.
2. Quraishi S, Frangou S. Neurospychology of bipolar disorder. J Affect Disord 2002;72:209–226.
3. Savitz J, Solms M, Ramesar RS. Neuropsychological dysfunction in bipolar affective disorder: a critical opinion.
Bipolar Disord 2005;7:216–235.
4. Martinez-Aran A, Vieta E, Reinares M et al. Cognitive
function across manic or hypomanic, depressed, and
euthymic states in bipolar disorder. Am J Psychiatry
2004;161:262–270.
5. Goodwin GM, Anderson I, Arango C et al. ECNP consensus meeting. Bipolar depression. Nice, March 2007. Eur
Neuropsychopharmacol 2008;18:535–549.
6. Arts B, Jabben N, Krabbendam L, van Os J. Meta-analyses
of cognitive functioning in euthymic bipolar patients and
their first-degree relatives. Psychol Med 2007;38:771–785.
7. Bora E, Yucel M, Pantelis C. Cognitive endophenotypes
of bipolar disorder: a meta-analysis of neuropsychological
deficits in euthymic patients and their first-degree relatives.
J Affect Disord 2009;113:1–20.
8. Robinson LJ, Thompson JM, Gallagher P et al. A metaanalysis of cognitive deficits in euthymic patients with
bipolar disorder. J Affect Disord 2006;93:105–115.
9. Torres IJ, Boudreau VG, Yatham LN. Neuropsychological
functioning in euthymic bipolar disorder: a meta-analysis.
Acta Psychiatr Scand 2007;116:17–26.
10. Robinson LJ, Ferrier IN. Evolution of cognitive impairment in bipolar disorder: a systematic review of crosssectional evidence. Bipolar Disord 2006;8:103–116.
11. Krabbendam L, Arts B, van Os J, Aleman A. Cognitive
functioning in patients with schizophrenia and bipolar disorder: a quantitative review. Schizophr Res 2005;80:
137–149.
12. Mann-Wrobel MC, Carreno JT, Dickinson D. Meta-analysis of neuropsychological functioning in euthymic bipolar
disorder: an update and investigation of moderator variables. Bipolar Disord 2011;13:334–342.
13. Kurtz MM, Gerraty RT. A meta-analytic investigation of
neurocognitive deficits in bipolar illness: profile and effects
of clinical state. Neuropsychology 2009;5:551–562.
14. The Psychiatric GWAS Consortium Steering Committee.
A framework for interpreting genome-wide association
studies of psychiatric disorders. Mol Psychiatry 2009;14:
10–17.
15. Rivas MA, Beaudoin M, Gardet A et al. Deep resequencing
of GWAS loci identifies independent rare variants associated with inflammatory bowel disease. Nat Genet
2011;43:1066–1075.
Euthymic bipolar cognition: IPDMA
16. Belmonte Mahon P, Pirooznia M, Goes FS et al. Genomewide association analysis of age at onset and psychotic
symptoms in bipolar disorder. Am J Med Genet B Neuropsychiatr Genet 2011;156:370–378.
17. Clarke MJ. Individual patient data meta-analyses. Best
Pract Res Clin Obstet Gynaecol 2005;19:47–55.
18. Delis DC, Kramer JH, Kaplan E, Ober BA. California verbal learning test: adult version. San Antonio, TX: The
Psychological Corporation, 1987.
19. Rey A. L’examen clinique en psychologie. Paris: Presses
Universitaires de France, 1964.
20. Reitan RM. Validity of trail making test as an indication
of organic brain disease. Percept Mot Skills 1958;8:
271–276.
21. Wechsler D. Wechsler adult intelligence scale – revised:
manual. New York: Psychological Corporation, 1981.
22. Heaton RK. Wisconsin card sorting test manual. Odessa,
FL: Psychological Assessment Resources Inc., 1981.
23. Yatham LN, Torres IJ, Malhi GS et al. The International
Society for Bipolar Disorders – battery for assessment of
neurocognition (ISBD-BANC). Bipolar Disord 2010;12:
351–363.
24. Moher D, Liberati A, Tetzlaff J, Altman DG, Group TP.
Preferred reporting items for systematic reviews and metaanalyses: the PRISMA statement. J Clin Epidemiol
2009;62:1006–1012.
25. Simonsen C, Sundet K, Vaskinn A et al. Neurocognitive
profiles in bipolar I and bipolar II disorder: differences in
pattern and magnitude of dysfunction. Bipolar Disord
2008;10:245–255.
26. Balanza-Martinez V, Tabares-Seisdedos R, Selva-Vera G
et al. Persistent cognitive dysfunctions in bipolar I disorder and schizophrenic patients: a 3-year follow-up study.
Psychother Psychosom 2005;74:113–119.
27. Bora E, Vahip S, Akdeniz F et al. The effect of previous
psychotic mood episodes on cognitive impairment in
euthymic bipolar patients. Bipolar Disord 2007;9:468–477.
28. Cavanagh JTO, van Beck M, Muir M, Blackwood DHR.
Case-control study of neurocognitive function in euthymic
patients with bipolar disorder: an association with mania.
Br J Psychiatry 2002;180:320–326.
29. Clark L, Iversen SD, Goodwin GM. Sustained attention
deficit in bipolar disorder. Br J Psychiatry 2002;180: 313–319.
30. Dittmann S, Seemuller F, Schwarz MJ et al. Association of
cognitive deficits with elevated homocysteine levels in euthymic bipolar patients and its impact on psychosocial
functioning: preliminary results. Bipolar Disord
2007;9:63–70.
31. El-Badri SM, Ashton CH, Moore PB, Marsh VR, Ferrier
IN. Electrophysiological and cognitive function in young
euthymic patients with bipolar affective disorder. Bipolar
Disord 2001;3:79–87.
32. Fleck DE, Shear PK, Zimmerman ME et al. Verbal memory
in mania: effects of clinical state and task requirements.
Bipolar Disord 2003;5:375–380.
33. Fleck DE, Shear PK, Madore M, Strakowski SM. Wisconsin card sorting test performance in bipolar disorder:
effects of mood state and early course. Bipolar Disord
2008;10:539–545.
34. Frangou S, Donaldson S, Hadjulis M, Landau S, Goldstein
LH. The Maudsley bipolar disorder project: executive dysfunction in bipolar I disorder and its clinical correlates.
Biol Psychiatry 2005;58:859–864.
35. Goswami U, Sharma A, Khastigir U et al. Neuropsychological dysfunction, soft neurological signs and social disability in euthymic patients with bipolar disorder. Br J
Psychiatry 2006;188:366–373.
36. Kieseppa T, Tuulio-Henriksson A, Haukka J et al. Memory
and verbal learning functions in twins with bipolar-I disorder and the role of information-processing speed. Psychol
Med 2005;35:205–215.
37. Martinez-Aran A, Vieta E, Torrent C et al. Functional
outcome in bipolar disorder: the role of clinical and cognitive factors. Bipolar Disord 2007;9:103–113.
38. Mur M, Portella MJ, Martinez-Aran A, Pifarre J, Vieta
E. Persistant neuropsychological deficit in euthymic bipolar patients: executive function as a core deficit. J Clin Psychiatry 2007;68:1078–1086.
39. Senturk V, Goker C, Bilgic A et al. Impaired verbal memory and otherwise spared cognition in remitted bipolar
patients on monotherapy with lithium or valproate. Bipolar Disord 2007;9:136–144.
40. Smith DJ, Muir WJ, Blackwood DHR. Neurocognitive
impairment in euthymic young adults with bipolar spectrum disorder and recurrent major depressive disorder.
Bipolar Disord 2006;8:40–46.
41. Stoddart SDR, Craddock NJ, Jones LA. Differentiation of
executive function and attention impairments in affective
illness. Psychol Med 2007;37:1613–1623.
42. Szoke A, Schurhoff F, Golmard J et al. Familial resemblance for executive functions in families of schizophrenic and bipolar patients. Psychiatry Res 2006;144:
131–138.
43. Thompson JM, Gallagher P, Hughes JH et al. Neurocognitive impairment in euthymic patients with bipolar affective
disorder. Br J Psychiatry 2005;186:32–40.
44. Torrent C, Martinez-Aran A, Daban C et al. Cognitive
impairment in bipolar II disorder. Br J Psychiatry
2006;189:254–259.
45. Zalla T, Joyce C, Szoke A et al. Executive dysfunctions
as potential markers of familial vulnerability to bipolar
disorder and schizophrenia. Psychiatry Res 2004;121:
207–217.
46. Dias VV, Brissos S, Frey BN, Andreazza AC, Cardoso C,
Kapczinski F. Cognitive function and serum levels of brainderived neurotrophic factor in patients with bipolar disorder. Bipolar Disord 2009;11:663–671.
47. Simonsen C, Sundet K, Vaskinn A et al. Neurocognitive
dysfunction in bipolar and schizophrenia spectrum disorders depends on history of psychosis rather than diagnostic group. Schizophr Bull 2011;37:73–83.
48. Kaya E, Aydemir O, Selcuki D. Residual symptoms in
bipolar disorder: the effect of the last episode after remission. Prog Neuropsychopharmacol Biol Psychiatry
2007;31:1387–1392.
49. Cubukcuoglu Z, Aydemir O. Specifity and sensitivity of
neurocognitive tests in bipolar disorder: A comparative
study. Unpublished thesis, 2011.
50. Hellvin T, Sundet K, Simonsen C et al. Neurocognitive
functioning in patients recently diagnosed with bipolar
disorder. Bipolar Disord 2012;14:227–238.
51. Hamilton M. A rating scale for depression. J Neurol
1960;23:55–62.
52. Montgomery SA, Asberg M. A new depression scale
designed to be sensitive to change. Br J Psychiatry
1979;134:382–389.
53. Rush AJ, Carmody T, Reimitz PE. The inventory of depressive sympotmatology (IDS): clinician (IDS-C) and selfreport (IDS-SR) ratings of depressive symptoms. Int J
Methods Psychiatr Res 2000;9:45–59.
54. Young RC, Briggs JT, Ziegler VE, Meyer DA. A rating
scale for mania: reliability, validity, and sensitivity. Br J
Psychiatry 1978;133:429–435.
161
Bourne et al.
55. Altman EG, Hedeker DR, Janicak PG, Peterson JL, Davis
JM. The clinician-administered rating scale for mania
(CARS-M): development, reliability, and validity. Biol
Psychiatry 1994;36:124–134.
56. Bech P, Boewig TG, Dein E, Jacobsen O, Gram LF. Quantitative rating of manic states. Acta Psychiatr Scand
1975;59:1–6.
57. Nelson HE, Willison J. National adult reading test manual. 2nd ed. Windsor: NFER-Nelson, 1991.
58. Wechsler D. Wechsler abbreviated scale of intelligence
(WASI). San Antonio, TX: Harcourt Assessment, 1999.
59. Wechsler D. Wechsler memory scale – revised. New York:
Psychological Corporation, 1987.
60. Higgins JPT, Thompson SG. Quantifying heterogeneity in a
meta-analysis. Stat Med 2002;21:1539–1558.
61. Nuechterlein KH, Green MF, Kern RS et al. The
MATRICS consensus cognitive battery, part 1: test selection, reliability, and validity. Am J Psychiatry 2008;165:
203–213.
62. Donaldson S, Goldstein LH, Landau S, Raymont V, Frangou S. The Maudsley Bipolar Disorder Project: the effect
of medication, family history, and duration of illness on
IQ and memory in bipolar I disorder. J Clin Psychiatry
2003;64:86–93.
63. Jamrozinski K, Gruber O, Kemmer C, Falkai P, Scherk H.
Neurocognitive functions in euthymic bipolar patients.
Acta Psychiatr Scand 2009;119:365–374.
64. Goswami U, Sharma A, Varma A et al. The neurocognitive performance of drug-free and medicated euthymic
patients do not differ. Acta Psychiatr Scand 2009;120:
456–463.
65. Glahn DC, Bearden CE, Barguil M et al. The neurocognitive signature of psychotic bipolar disorder. Biol Psychiatry 2007;62:910–916.
66. Glahn DC, Therman S, Manninen M et al. Spatial working
memory as an endophenotype for schizophrenia. Biol Psychiatry 2003;53:624–626.
67. Glahn DC, Bearden CE, Cakira S et al. Differential working memory impairment in bipolar disorder and schizophrenia: effects of lifetime history of psychosis. Bipolar
Disord 2006;8:117–123.
68. Torrent C, Martinez-Ar
an A, Daban C et al. Effects of
atypical antipsychotics on neurocognition in euthymic
bipolar patients. Compr Psychiatry 2011;52:203–213.
162
69. Mohamed S, Paulsen JS, O’leary D, Arndt S, Andreasen N.
Generalized cognitive deficits in schizophrenia: a study
of first-episode patients. Arch Gen Psychiatry 1999;56:
749–754.
70. Cohen JW. Statistical power analysis for the behavioural
sciences. 2nd ed. Hillsdale NJ: Lawrence Erlbaum
Associates, 1988.
71. Kempton MJ, Geddes J, Ettinger U, Williams SCR, Grasby
PM. Meta-analysis, database, and meta-regression of 98
structural imaging studies in bipolar disorder. Arch Gen
Psychiatry 2008;65:1017–1032.
72. Vederine FE, Wessa M, Leboyer M, Houenou J. A metaanalysis of whole-brain diffusion tensor imaging studies in
bipolar disorder. Prog Neuropsychopharmacol Biol Psychiatry 2011;35:1820–1826.
73. Andreazza AC, Kauer-Sant’anna M, Frey BN et al. Oxidative stress markers in bipolar disorder: a meta-analysis. J
Affect Disord 2008;111:135–144.
74. Shao L, Young LT, Wang J. Chronic treatment with mood
stabilizers lithium and valproate prevents excitotoxicity by
inhibiting oxidative stress in rat cerebral cortical cells. Biol
Psychiatry 2005;58:879–884.
75. Tan H, Young LT, Shao L, Che Y, Honer WG, Wang J.
Mood stabilizer lithium inhibits amphetamine-increased
4-hydroxynonenal-protein adducts in rat frontal cortex.
Int J Neuropsychopharmacol 2012;15:1275–1285.
76. Mora E, Portella MJ, Forcada I, Vieta E, Mur M. Persistence of cognitive impairment and its negative impact on
psychosocial functioning in lithium-treated, euthymic
bipolar patients: a 6-year follow-up study. Psychol Med
2013;43:1187–1196.
77. Torrent C, Martinez-Aran A, del Mar Bonnin C et al.
Long-term outcome of cognitive impairment in bipolar
disorder. J Clin Psychiatry 2012;73:e899–e905.
78. Ioannidis JPA. Why most published research findings are
false. PLoS Med 2005;2:e124.
Supporting information
Additional Supporting information may be found in the online
version of this article:
Table S1. List of 45 identified eligible studies.
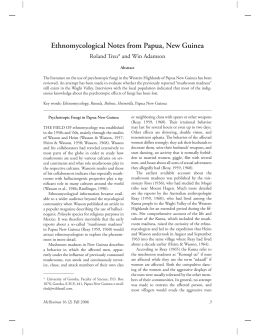
Baixar