Articles | Winter 2008
UNEMPLOYMENT DURATION IN THE PORTUGUESE
LABOUR MARKET*
Pedro Portugal**
“O saber sem inteireza é uã roda de vento”
D. Francisco de Portugal, 1º Conde de Vimioso
1. INTRODUCTION
This article provides a short summary of the empirical literature relating to the effects on unemployment duration in Portugal stemming from the act of receiving unemployment benefit. In this reassessment, there will be a systematic analysis of the individual records from the National Statistical Office
(INE) Employment Survey (Inquérito ao Emprego), using statistical techniques duration analysis .
There are many studies analysing the effect of unemployment benefits on the rate of transition to employment. Job search theory leads to clear theoretical predictions, and these are generally confirmed
by empirical studies. One of the expectations that has been confirmed by the data is that more generous unemployment benefit regimes lead to longer spells of unemployment. This hypothesis will be
analysed later, in accordance with various identification schemes.
One clear feature of the Portuguese labour market is the extremely high mean duration of unemployment. The low intensity of flows between states of employment and unemployment has led some authors to name Portugal as an extreme case of “eurosclerosis”. It is possible, therefore, that labour
market stagnation has been a cause of legislation in favour of potentially very long periods for the provision of unemployment benefits. In this context, a very revealing picture can be gained from the characterisation of the impact unemployment benefit system in the definition of the profile of
unemployment duration distribution.
2. JOB SEARCH
In the simplest formulation of job search theory, the optimal solution for the unemployed worker looking
for a job is the definition of a reserve salary, x , so that
x=b +
l
p
t
ò x ( w - x )dF ( w )
where b is the value of the unemployment benefit net of the costs of looking for a job, p is the discount
rate, F ( w ) is the distribution of available wages and l represents the rate at which job offers arrive.1
*
I would like to thank Nuno Alves, António Antunes, Ana Cristina Leal, José António Ferreira Machado, Carlos Robalo Marques, Pedro Martins and Paulo
Rodrigues for their comments and suggestions. This article comes in the wake of countless discussions with successive generations of students in Labour
Economics and Microeconometrics in the Economics Faculty of the Universidad Nova de Lisboa. The author also owes a great debt of gratitude to to
Lucena Vieira for her computer work, always impeccably carried out. The opinions expressed in the article are the responsibility of the author and do not
necessary coincide with those of the Banco de Portugal or the Eurosystem.
**
Banco de Portugal, Economics and Research Department.
(1) This can also include the intensity of the job search.
1
Economic Bulletin | Banco de Portugal
55
Winter 2008 | Articles
This equation provides an implicit (positive) relationship between the unemployment benefit and the
reservation wage and a (negative) relationship between the amount of the subsidy and the hazard
rate, defined as:
q = l( 1 - F ( x ))
or, expressed in terms of average unemployment duration:
Tu =
1
l( 1 - F ( x ))
Basically, an increase in the unemployment benefit b raises the reservation wage x (and/or reduces the
intensity of the job search). This translates into a reduction in the likelihood of a job offer being accepted, 1- F ( x ) leading to a fall in the hazard rate and therefore to an increase in the unemployment
duration.2,3
3. HOW MUCH DOES AN UNEMPLOYED PERSON RECEIVE? FOR HOW
LONG?
Unemployment insurance as a system to protect the unemployed was only introduced into Portugal in
1985, and even then somewhat in a muted way. It was only broadened significantly in 1989. The structure of the system is relatively simple. Unemployment benefits are only available after a minimum period of contributions to social security (currently 450 days in the last 24 months). It is 65 per cent of the
value of remuneration prior to unemployment (known as the reference wage), unless this figure is less
than the Social Support Indexation (IAS) or more than three times the IAS. In the first case, the benefit
is made up to one IAS and in the second is brought down to three. The maximum duration for receiving
the benefit depends fundamentally on the age of the unemployed worker and, marginally, on the period
during which contributions were made. Duration varies between 270 and 1140 days. Once the allowable number of days has been reached, there is also, for those on very low salaries, an additional
period of half the maximum potential duration standard subsidy.
4. METHODOLOGY
Duration analysis is used to look into phenomena where the main interest resides in the counting of
time until a certain event takes place or, in more rigorous terms, up to terminal event. In other words,
duration analysis is the statistical modelling of the occurrence of transitions between different states.
Unemployment duration can thus be seen in terms of the transition between the state of unemployment and the state of employment. The empirical studies reviewed in this article are based fundamentally on notions of duration analysis, described in brief in the following section.
4.1. The loxodrome of human life
Lets define T as a continuous non-negative random variable which represents the duration of a given
state (the duration of the unemployment spell). Let f ( t ) be the corresponding probability density function and F ( t ) the cumulative distribution function, which will be given by
(2) See Addison et al. (2009a), for an empirical analysis of this stylistic model, with international comparisons.
(3) See, however, Coelho (2003) for a revealing insight based on the stock-flow theory.
56
Banco de Portugal | Economic Bulletin
3
2
Articles | Winter 2008
t
F ( t ) = P ( T £ t ) = ò f ( v ) dv
0
The probability of an individual remaining in this state until t is therefore given by the survival function
S ( t ) = P ( T ñ t ) = 1- F ( t )
The fundamental concept in duration analysis is the hazard function, defined as
h ( t ) = lim
Dt ®0
P ( t £ T £ t + Dt | T ³ t )
Dt
measuring the instantaneous rate of exit (from unemployment) at moment t, given that the individual
survived in the state (remained unemployed) until t.4 The cumulative hazard function, associated with
the hazard function, is defined as follows
t
L( t ) = ò h ( v ) dv
0
This is used above all in specification analysis. The temporal evolution of the hazard function is
dh ( t )
characterised by
, which defines the important notion of duration dependence.
dt
Another interesting function in duration analysis is the residual duration
e(s ) = ò
¥
s
t f ( t ) dt
S(s )
=s+ ò
¥
s
S ( t ) dt
S(s )
which makes it possible to deduce the expression of mean duration as the integral of the survival function.
¥
e ( 0 ) = E ( T ) = ò S ( t ) dt
0
However, in the empirical analysis of unemployment, duration cannot be measured in continuous time.
In the case of the INE Employment Survey, the information on unemployment is grouped in months.
For these data, it is convenient to bear in mind the discrete nature of the duration. Let time be divided
into K intervals
[c 0 , c 1 ) , [c 1, c 2 )...[c k -1 , ¥ ).
The investigator observes the discrete time
T Î {1,..., k } where T = t represents an exit (fault) within the interval [c t -1, c t
). The discrete hazard
rate is given as
t=1,...,k-1,
h ( t ) = P ( T = t | T ³ t ),
The discrete survival function is defined as
t
S ( t ) = P ( T > t ) = Õ [1- h ( j ) ]
j =1
and the unconditional likelihood of fault is given by
f ( t ) = P ( T = t ) = h ( t )S ( t )
(4) According to Tiago de Oliveira, “the concept of hazard rate, seen from the point of view of life force (demography) was created in 1757 by Soares de Barros e
Vasconcelos. It is not a Portuguese expression. It was used in an article entitled “Loxodromia da Vida Humana”, Mem. Real Academia de Sciencias de
Lisboa, 1ª série, I, 1759. He uses the expression life force correctly. It should be noted that this is an important instrument in the statistics of extremes. The
concept was rediscovered later by Gompertz (1825) and Makeham (1860). In Probabilidades e Estatística vol. I, 1990, page 158.
4
Economic Bulletin | Banco de Portugal
57
Winter 2008 | Articles
4.2. Incomplete durations
There are many times when the observations on the duration of a given episode are not exact. They
are frequently incomplete, either because it is only known that the duration goes beyond a given value
(in this case they are right censored), or because it is known that the exact count of the duration was
started after some time had elapsed (in this case they are left censored). It is also possible to have
these two cases simultaneously, giving rise to interval censored observations.
Let T * be a random variable representing duration in the absence of any censoring and C the censoring time. Observed duration will then be T = min( T * , C ). In these circumstances it is convenient to introduce the censor indicator for the individual i
ìï 0 ,
di =í
ïî 1,
seT i * > C i ;
seT i * £ C i
The likelihood function for a pair sample ( t i , d i ) of size n, where the censoring time gives no information as to the duration distribution parameters, can be simplified to:
n
L = Õ f ( t i ) d i S ( t i ) 1- d i
i =1
4.3. Semi-parametric estimation
The use of flexible specifications for the hazard functions through the segmentation of duration in an
adequate number of time intervals5 provides a procedure that establishes a compromise solution between a strictly non-parametric approach, which frequently introduces an undesirable noise level in the
presentation of the empirical survival function, and a parametric approach, which contains the risk of
imposing too much structure on the empirical data. A specific hazard function associated with each
time interval can be specified. The piecewise constant hazard function solution was adopted because
of its convenience as a computation tool:
ì q 1,
ïq
ï 2,
ïq
h ( t ) = í 3,
ï.
ï.
ï
îqM ,
se 0 £ t < c 1 ,
se c 1 £ t < c 2 ,
se c 2 £ t < c 3 ,
se c M -1 £ t < ¥
where M is the number of intervals.
4.4. Regression analysis
In the regression analysis of duration, it is important to consider the effects of covariates x (where x is a
vector of explicative variables) in the behaviour of f ( t | x ), h ( t | x ) and S ( t | x ). In the formulation of the
(5) In any case, see Addison and Portugal (1987) on the use of supermodels in the choice of duration distribution.
58
Banco de Portugal | Economic Bulletin
5
Articles | Winter 2008
proportional hazards model (Cox, 1972) it is taken that the regressors influence the hazard rate in a
proportional fashion.
h ( t | x ) = h 0 ( t )exp( x ' b )
where h 0 ( t ) represents h ( t ) when x = 0. Expressed in a different way, x has a linear effect on the log
of duration log [h ( t ) ] . In this specification, therefore, the ratio between the hazard rates of the two
sub-populations remains constant over time (taking x constant over time).
A natural way of adapting the Cox model in discrete time is through derivation of the hazard function,
allowing for the grouping of continuous durations in time intervals (Prentice and Gloeckler, 1978). In
the case of the proportional effects model, the hazard function will be
h ( t | x ) = 1- exp [ - exp( l t + x ' b ) ]
where l t condenses the hazard cumulative function value in the interval t.6
4.5. Multiple destinations
Assuming now that R Î {1,..., m } represents the different possible destinations (for example, permanent contract, fixed-term contract and self employment and that the investigator observes the discrete
time T Î {1,..., k } where T = t represents an exit in the interval t. The specific hazard function associated with the destination r is given by
h r ( t ) = P ( T = t ,R = r | T ³ t )
the aggregate hazard function is
m
h ( t ) = å h j ( t ) = P ( T = t |T ³ t )
j =1
the corresponding survival function is
t
S ( t ) = Õ [1- h ( j ) ]
j =1
and finally the probability function is
P ( T = t ) = h ( t ) S ( t - 1)
Again assuming a proportional hazards specification, the generalisation of this model to the consideration of multiple destinations will have a formulation that can be derived from the multinomial extension
of a type 1 extreme value duration distribution (Fahrmeir, 1991):
h r (t | x ) =
exp ( l t r + x ' b r ) ìï
é m
ù üï
1- exp ê - å exp ( l tj + x ' b j ) ú ý
í
m
ï
êë j =1
úû ïþ
exp ( l + x ' b ) î
å
tj
j
j =1
(6) Equivalently, this formulation could be obtained through the initial specification of the piecewise constant hazard function.
6
Economic Bulletin | Banco de Portugal
59
Winter 2008 | Articles
4.6. Sampling plans: the bus paradox
The procedure for generating duration samples observed by the investigator has decisive consequences on the way that the information is interpreted (for example, the notions of mean duration) and
therefore on the specification of the likelihood function. It is absolutely crucial in duration analysis to
characterise the sampling plan and assess the conditions for identification of parameters that are of interest. When looking into the experience of the unemployed, it is important to separate out three situations: flow sampling; stock sampling; and sampling over a fixed interval.
4.6.1. Flow sampling
The first point to bear in mind is that this sampling is directly linked to the duration distribution of the
population. In this way, a random sample, tracking individuals from the start of the episode, will be representative of the population. An example of the flow sampling is the information recorded (from the
first day) on the unemployment stay (registered unemployment) is the method used by the Instituto de
Emprego e Formação Profissional – IEFP. In the case of the flow sampling, the appropriate likelihood
function will be:
n
L = Õ f ( t i ) di S ( t i ) 1- d i
i =1
4.6.2. Stock sampling
In the case of stock sampling – that is elapsed duration point in a state for individuals who are still in
that state – it is necessary to bear in mind, on the one hand, that all the durations are incomplete and,
on the other hand (and more importantly) that samples collected in accordance with this sampling plan
tend towards systematic over-representation of longer durations. This is known in the literature as
length-bias sampling. A good example of length-bias sampling is the so-called bus paradox (Feller,
1966). Let us assume that in a given city, the buses run exactly to timetable at 60-minute intervals. A
passenger who arrives at a bus stop at a random time will on average wait 30 minutes for a bus. Let us
now suppose that the buses arrive at random, in accordance with a Poisson distribution, with one bus
on average arriving every 60 minutes. The result, paradoxically, is that this same passenger will now
wait, on average, 60 minutes for the bus, double the initial situation. A clear case of stock sampling is
the information collected by the Employment Survey carried out by the National Statistical Office (INE).
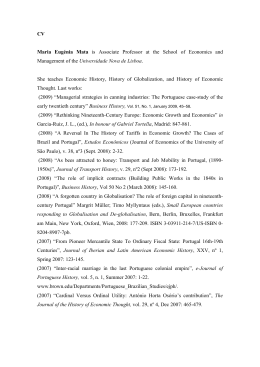
Chart 1 illustrates the effect of the sampling plan of the Employment Survey, where the information collected by the interviewer (the incomplete duration) is shown by the solid lines, in a situation where short
unemployment episodes tend to be under-represented.
In the case of stock sampling, the likelihood function is weighted by the probability of a given individual
being observed, which is proportionate to the mean duration of the unemployment. Assuming a constant entry flow, the expression of the verisimilitude function will be:
n
L=Õ
i =1
where m is the mean duration of the population.
60
Banco de Portugal | Economic Bulletin
S(t i )
m
Articles | Winter 2008
Chart 1
DIAGRAM OF THE SAMPLING PLAN FROM THE EMPLOYMENT SURVEY CARRIED
OUT BY INE (STOCK SAMPLING)
Date of survey
Time
4.6.3. Observation over a fixed interval
Even under stock sampling, the information on duration may be collected at two or more moments. In
the first, information is obtained on the elapsed duration and in subsequent periods, information is obtained on whether a transition has occurred or not. When, for example, the information on unemployment duration is crossed with the employment status in two successive surveys of the INE
Employment Survey, the sampling procedure is characterised as an observation over a fixed interval.
In this case, it is possible to condition the probability of transition in the elapsed duration and obtain the
parameters of the duration distribution function by maximising the function:
n
L = Õ p d i ( 1- p ) d i em que p =
i =1
S(t ) -S(t + h )
S(t )
where h denotes the observation period.
4.7 Unobserved individual heterogeneity: the tortoise and the hare
The problem of unobserved heterogeneity in duration analysis can be seen, as in the discussion of
random effects models, as a problem of incomplete specification. The presence of unobserved individual heterogeneity may derive from errors of measurement relating to duration or regressors, the omission of relevant variables, inadequate formulation of a functional form or of the hazard function. In most
situations, unobserved individual heterogeneity causes inconsistency in the estimators.
In particular, it is known that it causes a systematic bias in estimation, favouring negative duration dependence. The reason for this bias stems from the change in composition of this sample over time.
This happens because as time passes, the sample is increasingly made up of individuals who have un-
Economic Bulletin | Banco de Portugal
61
Winter 2008 | Articles
observed attributes which hinder their transition to another state. Let us suppose that in a given sample
there are hares and tortoises. The econometrician does not differentiate one from another. Once the
race starts, the hares (with higher hazards) tend to complete the route more quickly, and this means
that as time passes the samples become more and more laden with tortoises (with lower hazards) and
this gives the illusion of negative duration dependence.
A direct way to formalise this problem is through the incorporation of a random term of disturbance
which represents a specific individual effect, with density of probability function g ( v ). This being so,
the problem can be approached within the scope of mixturer of distributions. The unconditional
survival function is then
S ( t ) = E v [S ( t | v ) ] = ò g ( v ) S ( t | v ) dv
v
Two alternative approaches have been proposed to incorporate unobserved individual heterogeneity
in duration models. In the case of the parametric function g ( v ), it is explicit (assumed), making it possible to derive the unconditional survival function (parametric approach). The gamma distribution with
unit mean is frequently used because it allows (like the exponential family distributions) for a closed solution to S ( t ).7 As an alternative, non-parametric approaches have been proposed. In these cases, the
probability density function of non-observed heterogeneity is approximated through the estimation of a
discrete empirical function with a pre-determined number (or not) of support points (Heckman and
Singer, 1984). In this last case, it will be possible to estimate the proportion of individuals associated
with each group (for example, the fraction of hares and tortoises).
4.8. Defective risk: the tortoise’s egg
The presence of long-term survivors, that is, individuals where the probability of transition to another
state is zero, makes it necessary to specify unemployment duration distribution as a degenerate distribution. In epidemiology, situations of long-term survival can be generated by the presence of immune
or cured individuals. In the case of unemployment duration, it is assumed that a fraction of those unemployed will never make the transition to employment. One way of incorporating the presence of
long-term survivors is to consider a probability p of the unemployed individual making the transition to
employment and a probability ( 1- p ) of remaining always out of work. The unconditional survival
function can then be expressed as:
S ( t ) = ( 1- p ) + pS 2 ( t )
(1)
where S 2 ( t ) is the survival function conditioned to the possibility of transition to employment. An interesting feature of this model lies precisely in the possibility of estimating the proportion of long-term survivors ( 1- p ). Since the structure of the survival function is specified as a mixed distribution model, the
unconditional hazard function is defined as
h(t ) =
pf ( t )
( 1- p ) + pS 2 ( t )
(2)
Let us assume that the aim is to analyse the time it takes for tortoises to lay eggs using a sample of tortoises. Unfortunately, the sample includes male and female tortoises and the econometrician has no
way of differentiating between the two. The long-term survival model can estimate the proportion of
male tortoises and the distribution of time until the females lay eggs.
(7) See Addison and Portugal (1997) for a discussion on the choice of mixture distribution.
62
Banco de Portugal | Economic Bulletin
7
Articles | Winter 2008
5. WHAT IS THE MEAN DURATION OF UNEMPLOYMENT?
Standard statistical information on unemployment duration gives a very distorted picture of its distribution. On one side, there is the information collected by the INE, relating naturally to episodes of on-going unemployment and it therefore only records incomplete durations. On the other side, there is the
sampling plan of the Employment Survey, (stock sampling), corresponding to a classic example of a
snapshot, which means that the longer durations are over-represented relative to the complete number of unemployed. It is however possible, assuming a stationary flow of arrivals in unemployment, to
obtain estimates of average unemployment duration for the unemployed as a whole. 8 Using a strictly
parametric approach, the main difficulty resides in the choice of distribution function.9
Table 1 shows estimates of mean unemployment duration, corrected for length-bias. The figures are
based on exponential distribution and on two generalisations of this distribution: the Weibull and a mixture of two exponential distributions. A useful term of reference is provided by the arithmetic average of
elapsed unemployment durations, corresponding to the estimator of average unemployment duration
for the unemployed as a whole, using the exponential distribution hypothesis. Two interesting conclusions emerge from this picture: in the first place, a comparison between the estimates corresponding
to the exponential distribution (the conventional ones) and those supplied by the more general distributions makes it clear that the length-bias effect is very relevant;10 and in the second place, there is a very
significant recent rise in average unemployment duration among the unemployed as a whole, estimated as 443.5 days with the Weibull distribution and 435.7 days using the binomial-exponential
distribution.
Table 1
ESTIMATES OF THE MEAN UNEMPLOYMENT DURATION, IN DAYS
Sample
1998 I
From 1998 I to 2008 II
2008 I
Distribution function
Exponential (arithmetic average)
550.5
534.7
585.4
Weibull
Binomial-exponential
351.7
358.1
404.0
414.1
443.5
435.7
Source: Employment Survey.
6. WHO AMONG THE UNEMPLOYED HAVE MOST DIFFICULTY IN FINDING
AN ACCEPTABLE JOB?
Regression analysis allows us to accommodate the presence of observed heterogeneity among unemployed, and identify the features that have the most decisive influence on the rate of transition to a
state other than unemployment. In the context of statistical analysis of duration, the simplest approximation will be the specification of a Cox model of proportionate effects (see Section 4.4). In Table 2, the
(8) In Portugal (1996), the Weibull distribution is used for this effect.) Using a strictly parametric approach, the main difficulty resides in the choice of distribution
function.
8
(9) See Machado and Portugal (2008) for a semi-parametric approach based on the statistical notion of copulas.
9
(10) Note that when using the exponential distribution hypothesis, the estimate of average duration of the stock of unemployed is, trivially, the double of the
arithmetic average (that is, 1101, 1069.4 and 1170.8 days).
1010
Economic Bulletin | Banco de Portugal
63
Winter 2008 | Articles
Table 2
TRANSITIONS FROM UNEMPLOYMENT
Variable
Estimate of the regression coefficient
Receiving unemployment benefit
Age group
25-29
30-34
35-39
40-44
45-49
50-54
55+
Schooling (years)
Tenure
Number of jobs
Skilled worker
Married
Handicapped
First job
Collective dismissal
End of fixed-term contract
Unemployment rate
-0,550
(0,064)
-0,030
(0,075)
-0,190
(0,092)
-0,298
(0,112)
-0,143
(0,110)
-0,296
(0,125)
-0,377
(0,134)
-0,738
(0,137)
0,015
(0,008)
-0,010
(0,004)
0,021
(0,007)
-0,109
(0,074)
0,244
(0,071)
-0,665
(0,239)
-0,237
(0,085)
-0,087
(0,084)
0,079
(0,060)
-0,056
(0,026)
Regions
North
Centre
Lisbon
Algarve
Log-likelihood
-0,236
(0,080)
0,059
(0,098)
-0,229
(0,078)
-0,256
(0,107)
-4361,755
Source: Portugal and Addison 2008a.
results are shown of the estimation of the discrete version of the model of proportionate effects, using
the sampling plan hazard function, correcting the likelihood function piecewise-constant characterised
by the observation of a fixed interval (see Sections 4.3 and 4.6.3).
The results of this give us a first estimate of how the transition rate is affected by receipt of unemployment benefit. The unemployed who receive the benefit in quarter t make a transition in t + 1 at a rate of
64
Banco de Portugal | Economic Bulletin
Articles | Winter 2008
42.3 per cent (exp -0 . 550 - 1) lower than an unemployed person who does not receive any benefit.11 Another finding that stems from the estimate is that age is a powerful predictor of unemployment duration.
The hazard rate decreases visibly with age, possibly due to a fall in the rate of job offer arrival. Unemployment duration is less for those who are married, educated and have had various jobs. In terms of
the causes underlying the job search, the end of a term contract is associated with shorter durations
and looking for the first job brings longer durations. The Algarve is the region with longest unemployment duration, as opposed to the centre which has the shortest.12
7. WHAT ACTIONS GIVE A GREATER GUARANTEE OF SUCCESS IN THE
JOB SEARCH?
In order to be considered as unemployed, a person must search actively one effort to find a job in the
previous four weeks. This information makes it possible to characterise the choice of methods used in
the job search. As a complement to this, INE asks each worker what was the job finding method that
produced results. Table 3 summarises this information for the sample of unemployed workers. On average, the unemployed use around two methods in their job search.
The most popular methods are contact through a employment agency, use of friends and family contacts, and direct contact with an employer. In contrast to the relative frequency of the methods used,
the method most frequently cited by unemployed people who have found a job is (disproportionately)
the use of friends and family contacts. A closer analysis leads to the conclusion that contacts through
the employment agency translate into low probability of finding a job. Moreover, jobs found through
such centres offer wages significantly below what is expected and are on the whole of short duration
(Portugal and Addison, 2002). Two points should in any case be borne in mind: one is that employment
agencies may attract unemployed people with unobserved characteristics, making placement in a job
more difficult and generating a negative selectivity situation; and the other is the very nature of the
vacancies on offer.
Table 3
EFFECTIVENESS OF THE JOB SEARCH
Method used
Number of unemployed in t-1
Number of employed people in t
using the method
per type of method
Direct contact with the employer
7138
505
Friends and family contacts
7921
1067
Reply to adverts
5485
151
Contact through an employment agency
8325
154
Efforts to become self-employed
151
179
Interviews, exams and tests
2061
113
Other methods
924
116
Source: Addison and Portugal 2002.
(11) See Portugal and Addison (2008) for a more detailed analysis of these results.
11
(12) In all the studies referred to here, the same sample of unemployed workers was used, identified in the Employment Surveys between 1992 and 1996. Since
the unemployment benefit system has been fundamentally the same over recent decades, there is no reason to assume that the effects of unemployment
spells on unemployment duration have changed significantly over recent years. In fact, using an identical regression to that presented in Table 2, a
coefficient of -0.485 is obtained for the period 1998 to 2008.
1212
Economic Bulletin | Banco de Portugal
65
Winter 2008 | Articles
8. WHAT IS THE IMPACT OF RECEIVING UNEMPLOYMENT BENEFIT ON
TRANSITIONS INTO EMPLOYMENT?
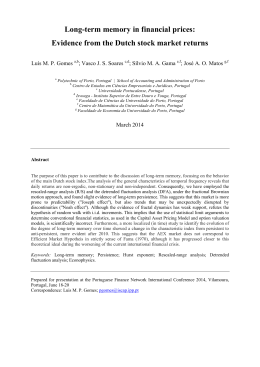
The difference in the transition rates between those who receive unemployment benefit and those who
do not is shown in Chart 2. Those who do not receive a benefit make the transition at a rate which is
close to double the rate observed in those who receive benefit. The table also suggests that duration
dependence is negative, meaning that the likelihood of moving out of unemployment in period t, given
that the person remained unemployed until t, diminishes with unemployment duration.
Chart 2
TRANSITION FROM UNEMPLOYMENT
0.4
Nonrecipients
Recipients
0.35
Quarterly rate of transition
0.3
0.25
0.2
0.15
0.1
0.05
0
-2
3
8
13
Unemployment duration (months)
18
Source: Portugal and Addison 2008.
8.1. Comparing those who receive unemployment benefit with those who do not
It is implicit in the comparison between those who receive a benefit and those who do not that the first
group would behave the same as the second group if they in their turn did not receive the benefit. This
means that identification of the effect of the benefit is reached by the contrast established between the
two groups. It is known that among those who do not receive a benefit are those unemployed who are
not eligible, those who are eligible but do not ask for it and those who received the benefit until the
end.13 Given the heterogeneity of the control group, it is important to use a control function that is as
complete as possible.
It is also important to consider the relative heterogeneity of the destination of the unemployed, who
may make the transition to unemployment or inactivity (see Section 4.5). It is worth noting that the re-
(13) Note that the analysis covers only those unemployed persons classified as such by INE.
66
Banco de Portugal | Economic Bulletin
13
Articles | Winter 2008
duction in the transition rate is of the same order for employment, at -43.8 per cent, as it is for inactivity,
at -43.4 per cent (Table 4).14
Table 4
TRANSITIONS FROM UNEMPLOYMENT: THE HAZARD FUNCTION WITH TWO DESTINATIONS
Transition to:
Employment
Receiving unemployment benefit
Inactivity
-0.576
(0.067)
-0.570
(0.156)
Source: Addison and Portugal 2003.
8.2. How the transition rate changes as the end of the subsidy period approaches
Job search models maintain that the transition rate into employment should increase as the end of the
benefit period approaches. Close to the end, the unemployed will increase their intensity in the job
search and/or will reduce their reservation wage. A convincing way of identifying the effect of unemployment benefit is the indication of the increase in the transition rate as a function of the closeness of
the maximum potential duration of the benefit. Table 5 presents evidence that suggests this effect, for a
specification of six distinct destinations which includes random effects with a gamma distribution for
UIH (see Sections 4.5 and 4.7).
It is easy to interpret the coefficients. So, for each month closer to the end of the benefit, the hazard
rate goes up, by 4.4 per cent in the case of transition to a permanent contract. Portugal and Addison
(2008) also consider various flexible alternatives to the use of the linear function.15
Table 5
SUMMARY OF THE EFFECTS OF RECEIVING UNEMPLOYMENT BENEFIT FOR MULTIPLE DESTINATIONS
Transition to:
Variable
Permanent
Fixed-Term
contract
contract
Receiving benefit
-0.652
(0.142)
-0.564
(0.113)
-1.910
(0.513)
-0.962
(0.314)
0.621
(0.324)
-0.605
(0.215)
Time until benefit runs out
(in months)
-0.044
(0.010)
-0.045
(0.008)
-0.086
(0.029)
-0.102
(0.024)
0.044
(0.027)
-0.048
(0.014)
part-time
Self-
Occupational
employment
programmes
Inactivity
Source: Portugal and Addison 2008.
8.3. Long-term unemployment
In a labour market where there is a very low rate of job offer arrivals, a significant fraction of the unemployed may never find a suitable job. In this case, there is said to be a defective risk and the unemployment duration distribution is degenerate, due to the presence of infinite durations (see Section 4.8). In
(14) See Bover et al. (2000) for a comparison with Spain.
14
(15) The use of variable instruments, such as, for example, the imputation of eligibility for receiving unemployment benefit also confirms the results already
found.
1515
Economic Bulletin | Banco de Portugal
67
Winter 2008 | Articles
the study by Addison and Portugal (2003), it is estimated that in fact there is an important fraction of the
unemployed who will never make the transition to employment. Two factors have a decisive influence
on the proportion of the long-term unemployed: age and the receipt of an unemployment benefit (Table
6). We can simulate that the fraction of unemployed who will never make the transition to employment
will be 9.4 per cent for 35-year-olds not receiving benefit and 63.2 per cent for 50-year-olds who receive benefit.16
Table 6
SIMULATION OF UNEMPLOYMENT DURATION: DEFECTIVE RISK MODEL
Age=20
Age=35
Age=50
SUB=0
SUB=1
SUB=0
SUB=1
SUB=0
SUB=1
3 months
0.629
0.792
0.672
0.841
0.79
0.92
12 months
0.257
0.466
0.321
0.574
0.474
0.723
36 months
0.05
0.14
0.092
0.25
0.218
0.435
Employment
0.029
0.081
0.094
0.231
0.371
0.632
Inactivity
0.39
0.483
0.287
0.37
0.173
0.234
5
11
7
16
11
28
7
14
7
21
24
na
Survival rate at the end of:
Defective risk:
Median of unemployment duration
(in months)
Two destinations
Until employment
Source: Addison and Portugal 2003.
8.4. An estimate based on matched pairs
The rules in Portugal governing the attribution of a maximum period of potential benefit depend in a deterministic way on the age of the unemployed person. During the period under review, those under 25
could receive the subsidy for 10 months. Those between 25 and 29 could receive for 12 months. This
rose to 15 months for those between 30 and 34, another 3 months for those between 35 and 39 and
then by another 3 months for each 5-year age range until those of 55 and over received 30 months.
This structure suggests a comparison between the transition rates of individuals of approximately the
same age but with different benefit periods. That is, the analysis would be carried out so as to establish
the differences between the likelihood of making the transition to work for the pairs 24 and 25, 29 and
30, 34 and 35, 39 and 40, 44 and 45, 49 and 50 and 54 and 55.
In this context, the regression analysis could be called discontinuity regression (Addison and Portugal,
2008b). The results of the estimation using a mixing distribution with two supporting points (see Sections 4.7 and 4.8) show that younger unemployed persons (less than one year and therefore a shorter
(16) The very high proportion of defective risks among 50-year-olds may be generated by the so-called “unemployment tunnel”, the possibility offered by social
security to the long-term unemployed to take early retirement with full pension.
16
68
Banco de Portugal | Economic Bulletin
Articles | Winter 2008
period of benefit) make the transition to employment at a rate of 86.8 per cent higher than their equals
(one year) older and the proportion of long-term unemployed is 44.4 per cent (Table 7).17
Table 7
TRANSITION FROM UNEMPLOYMENT, BINOMIAL MIXTURE MODEL
Variable
SUB*Youth
SUB
=1 1 if unemployment received
0.625
(0.230)
-0.833
(0.170)
Youth
=1 I if age = {24, 29, 34, 39, 44, 49 and 54}
-0.276
(0.118)
Unemployment duration (as a log)
-0.254
(0.046)
Yes
Control for age
Other control variables
Yes
Constant for type 1 individuals
-10.509
(0.177)
8.171
(0.165)
Changes in the constant for type 2 individuals
Probability of being a type 1 individual
0.444
(0.023)
Log-likelihood
-2061
Source: Addison and Portugal 2008.
9. THE SCLEROSIS PORTUGUESE LABOUR MARKET
The Portuguese labour market is disfunctional, with very weak flows between employment and unemployment.18 The explanation given by Blanchard and Portugal (2001) for this conspicuous characteristic labour mobility is that it stems from the strong protection of employment embedded in Portuguese
labour legislation, above all in terms of the legal framework for firings.19 Fundamentally, very long unemployment spells – a painful way of experiencing unemployment – are the counterpart of job protection. There is abundant empirical evidence that there is a greater prevalence of long unemployment
spells in countries with greater job protection (Blanchard and Portugal, 2001; OECD 2004. Fundamentally, the high costs of firings increase production costs, bringing down feasible wages wages (the
wage that guarantees nil profit). Job protection in turn increases workers’ bargaining power, and this
means higher bargaining wage (the wage to which the worker aspires). In this model, the equilibrium is
re-established by making unemployment more painful, that is, by reducing the arrival rate of job offers.
This brings down the transition rate from unemployment to employment, and pushes up the mean duration of unemployment. In this framework, guaranteed protection in the case of unemployment
through access to unemployment benefit will tend to cushion the cost of unemployment, and can
generate an ever steeper fall in the transition from unemployment to employment.
(17) See Centeno and Novo (2007) for an analysis of the change in the maximum potencial duration of unemployment benefit occurring in 1999, which affected
different age groups in various ways.
17
(18) See for example the chart detailing average quarterly flows between labour market states (Chart 3.16), published in the 2007 Banco de Portugal Annual
Report.
18
(19) In international rankings of labour legislation rigidity, Portugal is at or near the top. Fundamentally, very long unemployment spells – a painful way of living
through unemployment, are the counterpart of job protection. There is abundant empirical evidence that there is a greater prevalence of long unemployment
spells in countries with greater job protection (Blanchard and Portugal, 2001; OECD 2004).
19
Economic Bulletin | Banco de Portugal
69
Winter 2008 | Articles
There is direct and indirect evidence on the job arrivals rate in the European Household Panel, where
Portugal has the lowest arrival rate of job offers all the countries represented on the panel (Jolivet,
Postel-Vinay and Robin, 2006; Addison et al., 2009b). Franco and Torres (2008) calculated the probability of a worker leaving a job and finding a new one, using data from the Employment Survey. They
concluded that those probabilities are very low, and show that job separations are almost acyclical and
that the finding probabilities are strongly cyclical. In the work of Varejão and Portugal (2007) there is
documented evidence, based on the Structured Employment Survey, that in each quarter, only 25% of
enterprises change the composition of their work force. Ejarque and Portugal (2007) solve a dynamic
model of job search using relevant moments in the characterization of the Portuguese labour market
and show that the presence of adjustment costs (even though they are relatively small) can lead to a
significant reduction in the flow of jobs.20
In a labour market where the arrival job offers is a rare event, it is possible that the dissuasive effect of
unemployment benefit increases when the unemployed worker ceases to look for a job for a long period (reducing in the process his or her human capital), or is mitigated if the unemployed worker defines
a strategy based on accepting whatever job comes along. The distinction between the two possibilities
is, in essence, an empirical issue. The studies revisited here consistently indicate that receiving unemployment benefit has a very pronounced effect on unemployment duration.21
10.CONCLUSION
From this survey of studies on the way unemployment duration is impacted by unemployment benefits,
the various identification strategies and statistical procedures lead us to the conclusion that workers
who receive this benefit move into employment at a significantly lower rate than those who do not.
This effect is not unexpected, and to a certain extent it is desirable. The aim is for access to unemployment benefit to ease the unemployed worker from the pressure of accepting the first job offer and allow
for investment in a better match between his or her productive capacities and the features of the job
(job matching). The unemployment insurance system also has a crucial role in protecting workers during cyclical fluctuations in employment, avoiding excessive turbulence in consumption patterns. The
unemployment benefit system is clearly a valuable social support.
However, the doubling of unemployment duration associated with receiving unemployment benefit is
clearly excessive. The existing architecture of the unemployment system on the one hand amplifies
the effect of moral hazard in unemployment insurance and on the other weakens labour supply.
This author is of the opinion that a more adequate allocation of resources would be attained by defining
the maximum period for receiving unemployment benefit strictly as a function of the accumulation of
contributions to social security (and not age), as happened in the early years of the system.
It is also well known that the optimal architecture for unemployment insurance systems should include
penalties for enterprises which make more frequent use of firings so as to internalize the social costs
of this decision (experience rating). Along the same lines, it would be desirable for the amount of benefit to fall as duration increases, as happens in many other countries.
When redesigning labour market institutions, it should be borne in mind that there is a very strong interaction between the employment protection system (which, in the case of Portugal, favours very long
(20) The statistical information on stocks is of course consistent with the information on flows. The picture in Portugal is not only that the average duration of
unemployment is very high, but also the average number of jobs through an active life is low and the average duration of a specific employment is long.
20
(21) This point is in turn consistent with the results of Addison et al. (2009a), where there are for Portugal (compared with other countries in the European Union)
very high reservation wages and hazard rate elasticity relating to unemployment benefit.
21
70
Banco de Portugal | Economic Bulletin
Articles | Winter 2008
unemployment durations) and the unemployment protection system, which which tends to increase
workers’ bargaining powers.
REFERENCES
Addison, J. T., M. Centeno e P. Portugal (2009a) “Unemployment Benefits and Reservation Wages:
Key Elasticities from a Stripped-Down Job Search Approach,” Economica, no prelo.
Addison, J. T., M. Centeno e P. Portugal (2009b) “Do Reservation Wages Really Decline? Some
International Evidence on the Determinants of Reservation Wages,” Journal of Labor
Research, no prelo.
Addison, J. T. e P. Portugal (1987) “On the Distributional Shape of Unemployment Duration,” Review
of Economics and Statistics, 69.
Addison, J. T. e P. Portugal (1997) “Some Specification Issues on Unemployment Duration,” Labour
Economics, 5.
Addison, J. T. e P. Portugal P. (2002) “Job Search Methods and Outcomes,” Oxford Economic
Papers, 54.
Addison, J. T. e P. Portugal (2003) “Unemployment Duration: Competing and Defective Risks,”
Journal of Human Resources, 38.
Addison, J. T. e P. Portugal (2008) “How Do Different Entitlements to Unemployment Benefits Affect
the Transitions from Unemployment into Employment?” Economics Letters, 101, 2008.
Anderson, P., Borgan, Gill, R., Keiding, N.(1992) Statistical Models Based on Counting Processes,
Springer-Verlag, Heidelberg.
Blanchard, O. e P. Portugal, (2001) “What Hides behind an Unemployment Rate: Comparing
Portuguese and U. S. Labor Markets,” American Economic Review, 91.
Bover, O., P. Garcia-Perea e P. Portugal (2000) “Labour Market Outliers: Lessons from Portugal and
Spain,” Economic Policy, 31, 2000.
Centeno, M. e A. Novo (2007) “Identifying Unemployment Insurance Income Effects with a
Quasi-Natural Experiment,” Working paper do Banco de Portugal.
Coelho, J. M., (2003) “Duração do Desemprego e da Vagas de Emprego no Mercado de Trabalho
Português,” Boletim Económico do Banco de Portugal, Março de 2003.
Cox, D. (1972) “Regression Models and Life Tables,” Journal of the Royal Statistical Society, Series B,
34: 187-220.
Cox L. e V. Isham (1980) Point Processes, Chapman and Hall, London.
Ejarque, J. e P. Portugal (2006) “Labor Adjustment Costs in a Panel of Establishments: A Structural
Approach,” Working paper do Banco de Portugal.
Fahrmeir L. e G. Tutz, (1994) Multivariate Statistical Modelling Based on Generalized Linear Models,
Springer-Verlag, New York.
Feller (1966) An Introduction to Probability Theory and Its Applications Vol 2, Wiley, New York.
Franco, F. e S. Torres (2008) “The Cyclical Pattern of the Job Finding and Separation Rates:
Comparing the Portuguese and U.S. Labour Markets,” mimeo.
Economic Bulletin | Banco de Portugal
71
Winter 2008 | Articles
Han, A. e J. Hausman (1990) “Flexible Parametric Estimation of duration and Competing Risk
Models,” Journal of Applied Econometrics, 5.
Heckman, J. e B. Singer (1984) “A Method for Minimizing the Impact of Distributional Assumptions in
Econometric Models for Duration Data,” Econometrica, 52.
Jolivet, G. and F. Postel-Vinay e J.M. Robin, (2006) “The empirical content of the job search model:
Labor mobility and wage distributions in Europe and the US,” European Economic Review, 50.
Lancaster, T. (1990) The Econometric Analysis of Transition Data, Cambridge University Press, New
York.
Machado, J. A. e P. Portugal (2008) “Inferences about the Mean of Renewal Processes under Stock
Sampling,” mimeo.
OCDE (2004) Employment Outlook, Paris.
Oliveira, Tiago de (1990) Probabilidades e Estatística: Conceitos, Métodos e Aplicações, vol. I,
McGraw-Hill, Lisboa.
Portugal, D. Francisco de (1999) Poesias e Sentenças de D.Francisco de Portugal,1º Conde de
Vimioso, fixação do texto e notas por Valeria Tocco, Comissão Nacional para as
Comemorações dos Descobrimentos Portugueses, Lisboa.
Portugal, P. (1996) “Duração de uma Experiência Individual de Desemprego,” Boletim Económico do
Banco de Portugal, Junho.
Portugal, P. e J. T. Addison (2004) “Desincentive Effects of Unemployment Benefits on the Paths Out
of Unemployment,” CESifo Forum, 5.
Portugal, P. e J. T. Addison (2008) “Six Ways to Leave Unemployment,” Scottish Journal of Political
Economy, 55, 2008.
Prentice, R. e L. Gloeckler, L. (1978) “Regression Analysis of Grouped Survival Data with Applications
to Breast Cancer Data,” Biometrics, 34.
Ridder, G. (1984) “The Distribution of Single Spell Duration Data,” in G. Neumann e N.
Westgaard-Nielson eds, Studies in Labor Market Dynamics, Springer, Heidelberg.
Varejão, J. e P. Portugal (2007) “Employment Dynamics and the Structure of Labor Adjustment Costs,”
Journal of Labor Economics, 25.
72
Banco de Portugal | Economic Bulletin
Baixar