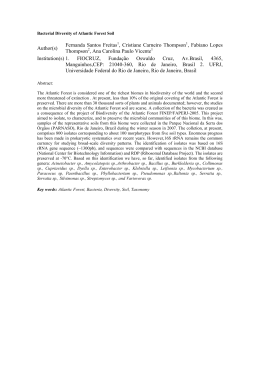
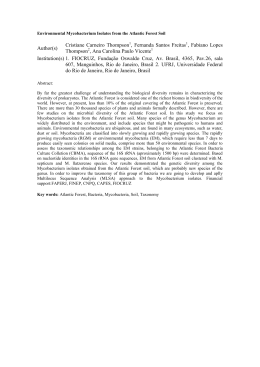
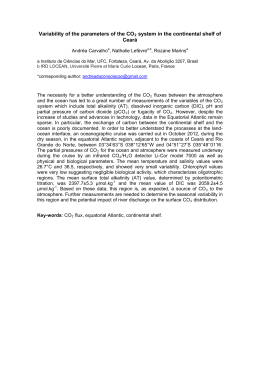
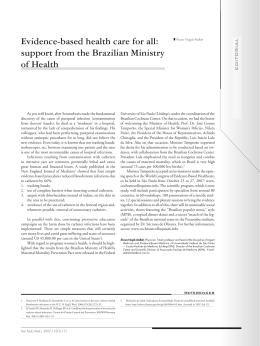
Functional Ecosystems and Communities ©2007 Global Science Books
Taxonomic Identification, Sampling Methods, and Minimum
Size of the Tree Sampled: Implications and Perspectives for
Studies in the Brazilian Atlantic Rainforest
Alessandra Nasser Caiafa1 • Fernando Roberto Martins2*
1 Plant Biology Graduate Course, Institute of Biology, State University of Campinas, Caixa postal 6109, Campinas 13083-970, SP, Brazil
2 Department of Botany, Institute of Biology, State University of Campinas, Caixa postal 6109, Campinas 13083-970, SP, Brazil
Corresponding author: * [email protected]
ABSTRACT
Our aim is to assess the main problems in the studies of tree communities in the Brazilian Atlantic Coastal Rainforest by analyzing
methods and sampling criteria used by different authors. We surveyed the literature and built a databank, which included 225 phytosociological tables obtained from 113 publications. Most publications are theses and papers published in non-indexed journals of restricted
circulation. The studies concentrate in the southeastern states, and there are large non-surveyed stretches, mainly in the northeastern states.
Botanical families with identification problems were always among the ten most abundant ones in every survey. The size of the smallest
individual sampled exerted more influence on the results than the sampling method (plots or point-centered quarters), thus making a
standardization necessary in future studies. Considering a similar sampling effort, the quarter method sampled a larger number of species
than the plot method. The number of individuals sampled was a better indicator of sampling effort than the area sampled. Considering our
present knowledge, there is still a great need to survey the Brazilian Atlantic Rainforest and publish the results in adequate journals.
However, each survey should obey a minimum set of criteria that yields reliable data. Analyzing the variation of community structure in
space and its relation to abiotic variables allows for hypothesis testing and provides key information for planning conservation of natural
areas and remediation of degraded vegetation.
_____________________________________________________________________________________________________________
Keywords: phytosociology, bibliography, sensu stricto Atlantic Forest, tree flora, survey protocol
INTRODUCTION
Originally, the Atlantic Rainforest sensu stricto (s.s.) or Atlantic Dense Ombrophilous Forest (Veloso 1992) continuously spread over the Brazilian coast since the Cape of São
Roque (07° S), in the state of Rio Grande do Norte, until the
municipality of Osório (29° S), in the state of Rio Grande
do Sul (Andrade-Lima 1966). Its original area has been estimated at 237,530 km2 (Câmara 2005), of which only 7.5%
presently remains (Myers et al. 2000). The remaining area
is scattered in many fragments, the largest ones occurring in
hardly accessible terrains on the Southern and Southeastern
coastal mountains (Hirota 2005). The Atlantic Rainforest s.s.
has a very heterogeneous tree flora, which is characterized
by the prevalence of species with low constancy and restricted geographic range (Scudeller et al. 2001). Many sites
present values of Shannon’s H’ diversity that are greater
than those estimated for the Amazonian Terra Firme Forest
(Silva and Leitão-Filho 1982; Martins 1989, 1991; Baitello
et al. 1993; Leitão-Filho 1994; Jesus and Rolim 2005), most
of them ranging from 3.71 nats.individual-1 in Teresópolis,
Rio de Janeiro state, to 5.04 nats.individual-1 in Linhares,
Espírito Santo state. Salomão and Lisboa (1988) calculated
values of Shannon’s H’ for many Amazonian forests and
found a range between 3.58 and 4.76 nats.individual-1 in
sites of Terra Firme forests. Due to its high conservation
value, Myers (1990) classified the Atlantic Rainforest s.s. as
one of the 18 diversity hotspots of the world. The diversity
hotspots are geographic areas sheltering almost 50,000
endemic plant species (about 20% of the world flora), but
comprising only 0.5% of the entire world land surface.
Myers et al. (2000) enlarged the number of world hotspots
from 18 to 25, confirmed the prominent position of the Brazilian Atlantic Rainforest, and emphasized the priority of its
Received: 28 September, 2007. Accepted: 30 October, 2007.
conservation.
Our knowledge of the Atlantic Rainforest s.s. is still incipient, especially considering: a) the nature (composition)
and the number (richness) of the species that co-exist and
constitute a local community, and how the composition and
the richness vary among communities; b) the distribution of
abundance among the species in a local community (equitability) and how equitability varies among different communities; c) the measurement of the local diversity (alphadiversity) and how the alpha-diversity varies in space and
time; and d) how the composition, richness, equitability,
and alpha-diversity can be influenced by environmental variables. Although still poorly known, these issues about the
Brazilian Atlantic Rainforest s.s. have been assessed with
the application of Phytosociology.
Phytosociology was firstly defined in 1896 in Jozef
Paczoski’s paper Zycie gromadne roslin (The social life of
plants) as the study of all the sociological relations among
plants in their groupings (Maycock 1967). As a subdiscipline of Plant Ecology, Phytosociology investigates the cooccurrence of plant species in communities (Ewald 2003).
Phytosociology may be defined as the study of the causes
and effects of the co-habitation of plants in a given environment, the assembling, constitution, and structure of the
plant groupings, and the processes that imply in the continuity or alteration of a plant grouping in time and space
(Martins 2004).
Phytosociology relies on a set of methods, theories, and
concepts that range: a) from the description of a local community to the detection of recurrent patterns in many communities over a large scale; b) from the analysis of the relation between an environmental variable and a species abundance in the space of a local community to the establishment of limiting conditions for species and communities in
Original Research Paper
Functional Ecosystems and Communities 1(2), 95-104 ©2007 Global Science Books
extent, the tree flora of the Seasonal Semideciduous Forest
is a subset of the Atlantic Rainforest, constituted by species
that are able to cope with a dry season. Scudeller et al.
(2001) considered binary and quantitative variables of tree
species occurring in the Atlantic Rainforest s.s of São Paulo
state to perform classification and ordination analyses. They
found a similarity decay with geographical distance and a
distribution of the tree species in complex gradients related
to the distance from the sea, climate, and altitude, and concluded that the tree flora of the Atlantic Rainforest s.s. is
very heterogeneous along the space, its species having
narrow ecological niches and being finely tuned to environmental conditions. These few studies based on banks of
metadata done so far in the Brazilian Atlantic forests are
enough to highlight the importance and the need to perform
field surveys and publish the results in good vehicles.
Martins (1989) divided the history of the Brazilian
forest Phytosociology into the initial phase and the diversification phase. In the initial phase, phytosociological studies
of trees in the Brazilian Atlantic Rainforest s.s. aimed to
gather the information necessary for fighting yellow fever
and malaria (Veloso 1945, 1946). After more than 60 years
from this first phytosociological study in the Atlantic Rainforest s.s., we think it is worthy having a look at the influence of the different methods and sampling criteria on the
results, as well as to make an appraisal of the taxonomical
difficulties, so as to provide elements to assess the results
attained so far and suggest possible paths toward future studies. Our aim is to make an appraisal of the phytosociological methods of studying tree taxa in the Atlantic Rainforest s.s., having the following questions as guidelines: 1)
Where are the phytosociological studies done so far in the
Brazilian Atlantic Rainforest s.s. published? 2) Are the surveys well distributed over the entire range occupied by this
biome? 3) Are there taxonomic identification problems, and
what are the most problematic taxa? 4) What was the influence of different sizes of the smallest individual sampled on
the results? 5) Is there a sampling method that yielded a
greater number of species in relation to the sample size? 6)
Considering the number of species, would it be possible to
indicate a minimal sampling effort? By answering these
questions, we intend to identify the main problems of data
surveying, facilitate the discussion of the methods used,
suggest a minimal protocol for future studies, and provide
the researcher with a fundamental literature.
their entire geographic range; c) from a description of the
instantaneous structure of a local community to the integration of its variation within a time interval; d) from the classification of local-scale vegetation stands to the detection of
relationships among entire phytogeographic formations
(Martins 2004). Due to its wide range, Phytosociology has
been divided into different fields of study (Braun-Blanquet
1979), each one equipped with a terminology and a set of
methods that are internationally recognized. The property
that is common to all these different fields is the quantification: the abundance of species and their relationships
are expressed in numerical terms, so as to allow mathematical treatments and statistical comparisons (Martins 2004).
An appraisal of publications by Brazilian authors who cited
Phytosociology as a key-word leads to the conclusion that,
in Brazil, Phytosociology is considered as the quantitative
description of taxocenoses and their relationships in space
and time. According to Hurlbert (1971), a taxocenose is a
set of individuals more or less related phylogenetically that
have similar forms and exploit similar resources in a similar
way.
A present-day tendency in phytosociological studies is
the analysis of metadata organized in electronic databanks.
The organization of biological information as electronic
databanks is important, since a databank centralizes information, reduces or eliminates the overlapping of efforts and
decreases the costs of a research (Scudeller and Martins
2003). Data from individualized surveys can, and should, be
systematized in order to gather sparse knowledge, allow the
construction of working hypotheses, and lead to future
researches, thus enlarging our scientific knowledge (Torres
et al. 1997). In Europe, the recent development of large
databanks has represented an objective way towards the
ecological analysis of species or communities over large
territories, thus improving the knowledge of vegetation
(Gégout et al. 2005).
In Brazil, vegetation studies based on databanks are few
and still have a regional bias. Silva and Shepherd (1986)
performed the first study based on metadata in Brazil,
which included Atlantic Rainforest s.s., Seasonal Semideciduous Forest, and Amazonian Terra Firme forests. Silva
and Shepherd (1986) made comparisons at the genus level
with Jaccard Similarity Index (Sneath and Sokal 1973) applied to binary (presence/absence) data, and concluded that:
a) climate, especially the occurrence of frost, was the main
conditioner of the floristic similarity among the forests
compared; b) the similarity of genera was very unevenly
distributed among sites of the Atlantic Rainforest, some of
which were similar to Amazonian Terra Firme forests,
others were similar to Seasonal Semideciduous forests, and
still others had a very low similarity with all the other sites.
Comparing tree species similarity by means of binary data,
Siqueira (1994) found that: a) most species had a very
restricted geographic range; b) the central region of the
entire latitudinal range of the Atlantic Rainforest s.s. had
the maximum number of species; and c) most species were
different at north and south from the center. She concluded
that the tree flora of the Atlantic Rainforest s.s. is very heterogeneously distributed along the space. Also using binary
data to compare species similarity, Ivanauskas (1997) found
differences between the tree communities on the Atlantic
Crystalline Plateau and sedimentary Coastal Province in
São Paulo state. Applying multivariate analyses to a databank considering the Atlantic Rainforest, Seasonal Semideciduous Forest, Amazonian forests, and Cerrado, OliveiraFilho and Fontes (2000) found a) a floristic differentiation
between rainforest and seasonal semideciduous forest associated to rainfall regime; b) a significant influence of latitude, longitude and altitude on species distribution; c) greater species similarity between the Atlantic Rainforest and
the Seasonal Semideciduous Forest than between any of
them with either Amazonian or Cerrado; and d) great similarity, especially at genus and family level, between the
Seasonal Semideciduous Forest and the Cerrado. OliveiraFilho and Fontes (2000) concluded that, to a considerable
MATERIALS AND METHODS
We used the FITOGEO databank system, which was developed in
Microsoft Access 97 to manage floristic and phytosociological information (Scudeller and Martins 2003). We considered as Atlantic
Rainforest s.s. the Phyto-Ecological Region mapped as Atlantic
Ombrophilous Dense Forest by IBGE (Veloso 1992). To update
the databank we considered all quantitative tree survey done within this Phyto-Ecological Region. We performed the update in two
steps. First, we filtered from the original databank all phytosociological tables referring to tree communities in the Atlantic Rainforest s.s. A phytosociological table is a single list of species with
their respective phytosociological descriptors. A phytosociological
table is analogous to a relevé (see Mueller-Dombois and Ellenberg
1974), but it is assembled with data collected by other methods
that are different from those of Braun-Blanquet (1979) school.
Each publication we gathered could have more than one phytosociological table referring to different sites, altitudes and soil types.
In the second step we fed this databank with new phytosociological tables coming from theses, books and articles published in
specialized periodicals. When a thesis was published as a scientific
paper, we considered only the published article. We took into
account only the periodicals that had an editorial board and ISSN,
and we did not consider reports, undergraduate monographs and
similar non-published studies. We considered only the references
published until the beginning of 2005 that informed the number of
individuals sampled in each species, the total sample size, and the
size of the smallest individual sampled. We discarded studies of
initial regeneration stages and those that did not sampled trees or
96
Tree phytosociology in the Brazilian Atlantic Rainforest. Caiafa and Martins
considered only a maximum height as the sampling criterion. We
regarded as trees the taxa considered as such by the authors of the
original studies, including arborescent ferns and palms. We then
confirmed the arboreous habit by consulting specialized taxonomic literature.
For the data analysis we used the commands provided by
Access for the use of simple or combined filters and for the generation of reports in order to quantify the number and percentage of
phytosociological tables at distinct sites, different sampling
methods, sample size, and the size of the smallest individual included in the sample, among other variables. To standardize the
data, the area sampled was converted into square meters, and the
PBH or CBH (trunk perimeter or circumference at breast height,
respectively) was transformed in DBH (trunk diameter at breast
height). We constructed the diagrams with Microsoft Excel 2003.
By pooling all phytosociological tables together in the databank we produced a preliminary species list. From this preliminary
list we excluded the taxa with dubious identification (cf. qualification), but kept the ones with the qualification aff. and the taxa not
identified to family, genus and species. Then we proceeded to taxon synonimization based on the specialized taxonomic literature
(floras, reviews, monographs, theses, etc.), so as to combine the
different synonymous of a same species in a single binome and
dispose the taxa according to APG system (Stevens 2006). Based
on this refined list we considered that the tree flora obtained from
the samples taken in the Brazilian Atlantic Forest s.s. would have a
number of species between a maximum and a minimum, as did
Castro et al. (1999) for the Brazilian Cerrados. The minimum
number considered that any non-identified taxon on any phytosociological table would be one of the already identified taxa on
another table: the minimum number of taxa would just be the
number of binomes, including those with the qualification aff. The
maximum number considered that any non-identified taxon on any
phytosociological table would be different from all identified taxa
on all the other tables.
To test for differences of the total number of species sampled
by the plot and the quarter methods in relation to the sample size
expressed as number of individuals (N), we performed a linear regression analysis and then applied the t-test to look for differences
between the slope coefficients (Zar 1999). To do this we considered only the phytosociological tables that sampled DBH 4.8
cm, so as to not have influence of any other variable but sample
size.
Considering only the samples taken with the plot method
including DBH 4.8 or 5.0 cm, we made scatter diagrams (Levine
et al. 2000) and performed regression analyses of the number of
species sampled (S) against the sample size in m2 (A) or the
number of individuals (N). We made goodness-of-fit tests for these
regression curves considering different regression models and
chose the best fit by considering the greatest coefficient of determination R2 with the software BioEstat 3.0 (Ayres et al. 2003).
Then we visually assessed the existence of an inflexion point on
the curves by considering a change in the tendency from an initially great increment ratio to smaller and smaller increments, although the curve could keep asymptotic.
Considering only the phytosociological tables with sampling
area from 7,000 to 10,200 m2, we used Spearman correlation tests
(Zar 1999) to evaluate the relationship between the size of the
smallest individual included in the sample and the total number of
individuals or species sampled. With these data we also constructed scatter diagrams (Levine 2000) to allow for a visual assessment of tendencies.
Fig. 1 Location of Brazil in South America. (A) Brazilian coast with
remnant fragments of the Atlantic rainforest s.s. in gray (adapted from
IBGE 2006). (B) The black points indicate the surveys used in our analysis. States: CE = Ceará, RN = Rio Grande do Norte, PB = Paraíba, PE =
Pernambuco, AL = Alagoas, SE = Sergipe, BA = Bahia, MG = Minas
Gerais, ES = Espírito Santo, RJ = Rio de Janeiro, SP = São Paulo, PR =
Paraná, SC = Santa Catarina, RS = Rio Grande do Sul.
Table 1 Families not identified to genus level with the respective number
of references (NR) to unknown 198 genera in 225 samples taken from the
Brazilian Atlantic rainforest.
Family
NR
Family
NR
Myrtaceae
52
Malvaceae
2
Lauraceae
20
Meliaceae
2
Fabaceae
18
Myrsinaceae
2
Rubiaceae
15
Nyctaginaceae
2
Euphorbiaceae
8
Rhamnaceae
2
Bignoniaceae
7
Sapindaceae
2
Moraceae
7
Verbenaceae
2
Sapotaceae
7
Violaceae
2
Annonaceae
6
Asteraceae
1
Apocynaceae
5
Clusiaceae
1
Salicaceae
5
Combretaceae
1
Arecaceae
3
Humyriaceae
1
Melastomataceae
3
Icacinaceae
1
Monimiaceae
3
Myristicaceae
1
Rutaceae
3
Olacaceae
1
Celastraceae
2
Polygonaceae
1
Chrysobalanaceae
2
Simaroubaceae
1
Lecythidaceae
2
Solanaceae
1
Malpighiaceae
2
Symplocaceae
1
RESULTS
Our databank on the Brazilian Atlantic Rainforest s.s. included 225 phytosociological tables obtained from 113 publications, of which 52% were master or doctorate theses, 46%
were papers in scientific periodicals and 2% were three
books and a further qualification (livre-docência) thesis.
The Atlantic Rainforest s.s. has not homogeneously been
sampled over its remnant area (Fig. 1). In the Northeastern
region, we gathered only 27 phytosociological tables: in the
state of Rio Grande do Norte – the northern limit of the
continuous biome range – we found only one publication in
a journal; in the state of Bahia we found 14 tables, of which
nine constituted Veloso’s (1946) pioneer study; in the state
of Pernambuco the publications are linked to the Plant
Biology Graduate Course of the Federal University and to
the Botanic Graduate Course of the Federal Rural University. In the Southern region, we found 89 phytosociological
tables, most represented by Veloso and Klein’s (1957,
97
Functional Ecosystems and Communities 1(2), 95-104 ©2007 Global Science Books
Table 2 Genera not identified to species level cited in more than 1% of the total number of references (NR) to 627 non-identified species in 225 samples
taken in the Brazilian Atlantic rainforest.
Genus
Family
NR
Genus
Family
NR
Ocotea
Lauraceae
40
Trichilia
Meliaceae
9
Eugenia
Myrtaceae
32
Casearia
Salicaceae
8
Calyptranthes
Myrtaceae
25
Chrysophyllum
Sapotaceae
7
Pouteria
Sapotaceae
20
Psidium
Myrtaceae
7
Myrcia
Myrtaceae
18
Alibertia
Rubiaceae
6
Cryptocarya
Lauraceae
13
Cinnamomum
Lauraceae
6
Miconia
Melastomataceae
12
Erythroxylum
Erythroxylaceae
6
Mollinedia
Monimiaceae
10
Faramea
Rubiaceae
6
Nectandra
Lauraceae
10
Ficus
Moraceae
6
Guatteria
Annonaceae
9
Guapira
Nyctaginaceae
6
Marlierea
Myrtaceae
9
Maytenus
Celastraceae
6
Psychotria
Rubiaceae
9
Myrceugenia
Myrtaceae
6
Fig. 2 Linear regression between the total number of species (S) and the total number of individuals sampled (N) with the quarter method (closed
circles and hatched line) or the plot method (open circles and full line) in the Brazilian Atlantic Rainforest s.s.
identification even to family level. Out of the remaining
825 citations to specific entities 198 were identified to family level and 627 to genus level. Out of the 198 citations
identified to family level Myrtaceae appeared in 26.3%,
Lauraceae in 10.1% and Fabaceae in 9% (Table 1). Out of
the 627 citations identified to genus, Ocotea appeared with
the greatest number (40) of non-identifications to species,
followed by Eugenia (32), Calyptranthes (25), Pouteria
(20) and Myrcia (18) (Table 2).
The minimum numbers of tree taxa we estimated for all
the phytosociological tables in the Atlantic Rainforest s.s.
were 98 families, 452 genera and 1,999 species; and the
maximum numbers were 164 families, 713 genera and
2,891 species. The upper limits represent an addition of
44.6% of species, 57.3% of genera and 66% of families in
relation to the lower limits.
The multiple plot sampling method (Daubenmire 1968)
was used in 91% of all the phytosociological tables, and the
quarter method (Cottam and Curtis 1956) was used in only
9%. The area sampled by the multiple plot method varied
1968a, 1968b) studies with small samples in many sites. In
the Southeastern region, we gathered 102 tables, 80 of
which refer to the state of São Paulo and 15 to the state of
Rio de Janeiro. Considering the importance of the Atlantic
Rainforest s.s. in the state of Espírito Santo (SE region), we
expected to find many surveys, but we gathered only five
phytosociological tables. In the state of Minas Gerais (also
SE region), we found only two tables, but in this state only
a small forest remnant occurs at the border with São Paulo
state.
In Brazil, the main difficulty in phytosociological studies is the species identification. Generally, most individuals are in a vegetative phase during sampling and can remain in this state for years, thus causing great difficulty in
their taxonomic identification. Out of the total 225 tables
we analyzed only 41 presented 100% identification to species level. In the other 184 tables, the proportion of identification to binomes varied between 48.8 to 99.2%.
We found 891 citations to non-identified species in the
totality of the tables, of which 66 citations did not have
98
Tree phytosociology in the Brazilian Atlantic Rainforest. Caiafa and Martins
Fig. 3 Regression between the number of species (S) and the total area (A) in m2 sampled with the plot method. The size of the smallest individual
included in the samples was DBH 4.8 or 5 cm.
Fig. 4 Regression between the number of species (S) and the total number of individuals (N) sampled with the plot method. The size of the smallest
individual included in the samples was DBH 4.8 or 5 cm.
99
Functional Ecosystems and Communities 1(2), 95-104 ©2007 Global Science Books
from 180 m2 to 400,000 m2, whereas the number of points
used in the quarter method varied from 24 to 266. Only
Negreiros et al. (1995) used the variable angle method (Bitterlich 1984).
The linear regression line between the number of species sampled and the total sample size in number of individuals was significant for the data set surveyed by both the
quarter method (R2 = 0.674; b = 0.149; P = 0.000; d.f. = 13;
Fig. 2) and the plot method (R2 = 0.304; b = 0.036; P =
0.000; d.f. = 96; Fig. 2). The slope differed significantly
between the two lines (t = 3.06**; d.f. = 109), thus indicating that a greater number of species were obtained by the
quarters than by the plots considering the same number of
individuals sampled.
Considering the plot method, we did not observe any inflexion point on the regression curve between the number of
species and the total area sampled, the best goodness of fit
being the linear equation (R2 = 0.376; Fig. 3). On the other
hand, we noticed a tendency towards an inflexion point on
the regression curve between the total number of species
and the total number of individuals sampled, the logarithmic equation being the best goodness of fit (R2 = 0.288; Fig.
4). The inflexion point on this curve was around 600 individuals, indicating that in sample sizes that were smaller than
600 individuals the number of species varied very much as
the number of individuals sampled enlarged, but larger samples presented less variation of the total number of species
sampled with the number of individuals. However, the low
value of R2 indicated that, although an inflexion point could
be present, the number of species sampled varied very
much among samples taken with the same number of individuals.
The criteria to decide about the size of the smallest individual included in the sample varied very much among the
phytosociological tables we compared. Some tables (2.2%)
considered a minimum height, some (3.1%) considered a
mixture of height and diameter, others (4.9%) considered
trunk diameter at soil level, still others (23.6%) considered
a range of the trunk diameter at breast height (DBH), but
most (66.2%) considered only DBH. The smallest individual included in the sample had a DBH ranging from 1.5
cm to 16 cm, but 79% of all phytosociological tables were
based on a DBH 4.8 cm.
Both the number of species (S, Fig. 5) and the number
of individuals (N, Fig. 6) sampled on a similar area tended
to diminish with the increase of the size of the smallest individual sampled. We found the highest correlation between
DBH and N (RS = 0.528; P = 0.001; N = 37) and only a
marginal significance between DBH and S (RS = 0323; P =
0.05; N = 37). Considering the same minimum DBH and a
similar sample area, both the number of species and the
number of individuals sampled varied very much, thus indicating that other variables, besides the size of the smallest
individual included in the sample, can influence the results
of the sampling.
DISCUSSION
Where are the phytosociological studies done so
far in the Brazilian Atlantic Rainforest s.s.
published?
We found a relatively large number (113) of publications
concerning quantitative studies of tree communities in
Atlantic Rainforest s.s. fragments spread over the Brazilian
coast, although they are not enough to provide a good basis
to understand the diversity and structure of this biome. Over
a half of these publications constitutes the so-called gray
literature, represented by theses and studies published in
non-indexed vehicles with restricted distribution (Scudeller
and Martins 2003). This fact prevents, or at least renders
very difficult, recovering information – the information becomes inaccessible to the scientific community, thus hindering other studies, actions or plans that need this kind of
information. An effort by researchers and thesis supervisors
is necessary for stimulating the publication of these studies
in indexed vehicles of wide distribution. However, since
these studies generally describe the structure of a natural
vegetation stand and are classified as descriptive case studies, they do not reach from editors the priority level that is
necessary to compete with studies in the deductive format,
which dispute the scanty publication space available in
Fig. 5 Scatter plot of the number of species (S) against the size (DBH) of the smallest individual included in samples taken in the Brazilian Atlantic rainforest s.s. The total sample area varied between 7,000 and 10,000 m2.
100
Tree phytosociology in the Brazilian Atlantic Rainforest. Caiafa and Martins
Fig. 6 Scatter plot of the number of individuals (N) against the size (DBH) of the smallest individual included in samples taken in the Brazilian Atlantic
rainforest s.s. The total sample area varied between 7,000 and 10,000 m2.
sample taken in the Southeastern region (Guedes-Bruni et
al. 1997; Pessoa et al. 1997; Guedes-Bruni 1998; Tabarelli
and Mantovani 1999; Scudeller et al. 2001; França and
Stehmann 2004; Jesus and Rolim 2005), Southern region
(Jarenkow 1994; Jaster 1995; Negrelle 2002) and Northeastern region (Lobão 1993; Tavares et al. 2000). These families have also the widest geographic ranges in the Atlantic
rainforest s.s. Siqueira (1994) found Lauraceae, Euphorbiaceae, Myrtaceae, Fabaceae and Rubiaceae as the most constant taxa in the samples, but the genera did not present the
same pattern: their geographic range is restricted, and those
having identification problems are different from one sample to another. Siqueira (1994) found that only 6% of a total
of 460 genera occurred in more than 50% of the total number of samples, and concluded that the floristic heterogeneity in the space of the Atlantic rainforest s.s. is very high.
We found phytosociological tables in which over 50% of
the taxa were not identified to the species level. The huge
proportion of taxa not identified to species points to the
need of intensifying floristic collecting in the field, improving herbarium collections and stimulating systematical and
taxonomical studies in the Atlantic rainforest s.s. (Scudeller
et al. 2001). Assessing the real number of tree taxa that occur in the Atlantic rainforest s.s. is very difficult, especially
considering that we included only quantitative surveys in
our analysis and disregarded studies concerning floristic
collecting. In a study aiming to evaluate the richness of the
woody flora of Brazilian cerrados, Castro et al. (1999) enumerated many factors that can enlarge or diminish the estimates. Our conjectures about both our estimates are implausible, mainly the upper limit, in which all non-identified
taxonomic entities would represent species, genera and families not previously identified. The lower limit seems to
provide a more reliable minimum estimate, but it is not
completely safe to assume that no unidentified taxon will be
added to a new sample taken from the Atlantic rainforest s.s.
In spite of these deficiencies, our estimate furnishes a way
to establish the probable upper and lower limits for the tree
species richness in this biome, especially in a scenario in
which the field surveys are unevenly distributed and have a
highly impacting vehicles. Just accepting as an established
fact that Brazil is the country of the megabiodiversity is not
enough: it is necessary to qualify the diversity (what are the
species? what is the richness?), to quantify it (what is the
abundance of each species? how does the abundance vary?
what is the numerical value of the diversity?), and to model
it (where is the diversity? how does it vary in the space? is
the diversity influenced by environmental variables?). The
only way to get this knowledge is by surveying the vegetation in the field and publishing the phytosociological tables,
so as to enable the construction of metadata banks.
Are the surveys well distributed over the entire
range occupied by the Atlantic Rainforest s.s.?
Our results showed that the distribution of studies over this
biome is not homogeneous, with gaps mainly in the Northeastern region (states of Bahia, Alagoas, Sergipe, Paraíba,
and Rio Grande do Norte) and also in the state of Espírito
Santo (Southeastern region). Considering the location of the
remaining areas (IBGE 2006) and samples we analyzed
(Fig. 1), it could be thought that the studies done so far encompassed almost all the largest fragments, but the mapping scale does not indicate the smaller fragments. Besides,
it is possible that some fragments had been extinct, such as,
for example, the forest described by Gandolfi (1991), which
gave place to the Guarulhos International Airport in the São
Paulo Metropolitan Region (São Paulo state). It is necessary
to survey other fragments, document their diversity and put
in practice the Brazilian laws concerning the conservation
of natural vegetation. Studies in the Northeastern region are
necessary especially to help establish the northern limits of
the Atlantic rainforest s.s.
Are there problems of taxonomic identification,
and what are the most problematic taxa in the
Atlantic rainforest s.s.?
We observed that the families with the greatest identification problems were always the most abundant ones in every
101
Functional Ecosystems and Communities 1(2), 95-104 ©2007 Global Science Books
ing geographic distance (Scudeller et al. 2001), that is the
tree flora is hugely heterogeneous in space. This means that
the species-area curve would keep its steep slope as the
sampling area enlarged, and even if the sample had a very
large area the number of species sampled would still enlarge
with enlarging sample area. The other aspect of “sufficiency” refers to the precision of the phytosociological descriptor estimates. Before starting sampling, we do not know
the number of species or their abundance in the community
to be studied; we come to know them only after the sample
is taken. This means that the sample always is a posteriori
stratified and, therefore, each stratum (species) will have
been sampled with a different sampling effort. Vieira and
Couto (2001) showed that the sizes and numbers of plots
would be very different to attain statistical sufficiency for
each species in the Atlantic rainforest s.s. and concluded
that it is very difficult to standardize the size and the number of plots, so that we should always keep in mind the
sample errors when we decide to use a unique plot size to
sample all the species in the community. Cielo-Filho (2001)
suggested that one hundred random plots summing up a
total area of one hectare would be a fairly sampling effort in
6.5-ha stands in the Seasonal Semideciduous Forest in the
interior of São Paulo state. However, considering the whole
range of occurrence of the Atlantic rainforest s.s. in Brazil,
it is not possible to recommend a fairly minimum sampling
area. Our results showed that the variation of the species
number was very high between samples, even if a sample
area about 10,000 m2 and a minimum tree size of DAP 5
cm were kept constant. This indicates that species richness
would not be strictly tied to the total area sampled. Hence,
we speculate that the environmental differentiations and
variations – which are known to occur in the Atlantic
rainforest (Oliveira-Filho and Fontes 2000; Scudeller et al.
2001) – would be more strongly associated with species
richness, which is a component of species diversity (Wright
2002; Leigh et al. 2004). It is also likely that different disturbance histories could contribute to differences in species
richness among the sites sampled, but unfortunately there is
no local record that could support the inclusion of this variable in our analysis. We suggest that what we usually call
sample “sufficiency” or “representativeness” may be considered a ratio of convenience between the sampling effort
and the return of information, and that the mathematical
modelling of the collector’s curve (Pielou 1977) may be an
adequate tool to decide when stop enlarging sampling effort.
Also, we suggest that the total number of individuals sampled is more important than the area sampled.
large proportion of unidentified taxa. Moreover, an evaluation of the diversity is hindered by the great unfamiliarity
with the taxa occurring in the Atlantic rainforest s.s. and by
the difficulty to establish its precise geographic limits.
What was the influence of different sizes of the
smallest individual sampled on the results?
Different studies have shown that results vary with the size
of the smallest individual included in the sample rather than
with different sampling methods (Scudeller et al. 2001). In
samples taken from the Seasonal Semideciduous Forest in
São Paulo state, Dislich et al. (2001) found a negative correlation between the minimum size (PBH) and the total density of trees per unit area and emphasized that different
minimum sizes adopted in different field surveys render it
difficult to compare samples. Freitas (2004) also found a
negative correlation between the minimum DBH and the
total tree density per unit area in Atlantic fragments in Rio
de Janeiro state. Our results showed a negative correlation
of the minimum DBH with both the number of species and
the number of individuals sampled in an area around 10,000
m2. Therefore, the size of the smallest individual to be sampled in a field survey is a variable of greater importance
than the sampling method itself, and we suggest that it be
standardized in all future phytosociological studies so as to
allow more reliable comparisons.
Is there a sampling method that yielded a greater
number of species in relation to the sample size?
The comparison of phytosociological descriptors obtained
with different methods in Brazilian forests has already been
made by other authors. Gibbs et al. (1980) applied both the
plot and quarter methods in a riparian forest in the municipality of Moji Guaçu (São Paulo state) and sampled a larger
number of species with the quarter method. Cavassan
(1990) mapped one hectare of cerrado in the municipality of
Bauru (São Paulo state), digitalized the map, and compared
both methods by simulating different sampling efforts in the
digitalized community. He concluded that the quarter method does not yield less information when applied in tropical woody vegetation and has as an advantage the considerable economy of efforts during field work. He also concluded that the plot method is efficient in the study of small
areas (about one hectare) because it provides more details
on the vegetation, and the density estimate is less biased;
whereas the quarter method can be used over larger areas,
provides a more general idea of the community structure
and is a good indicator of the number of species and probable gradients in the vegetation, but furnishes biased estimates of density. Analyzing metadata on the Atlantic rainforest s.s. in São Paulo state, Scudeller et al. (2001) did not
find any influence of the sampling method (plots or quarters) on the results. Our results showed that considering a
similar sampling effort, the quarter method yields a larger
number of species than the plot method. Hence, we think
that the sampling method (plots or quarters) does not represent an important factor in the variation of the results in
samples taken from the Atlantic rainforest s.s., but we recommend the quarter method for expeditious samplings in
large areas where a general, fast survey is aimed and precise
estimates are not required.
CONCLUSIONS
Considering the present state of knowledge of the Brazilian
flora and vegetation, we believe that field surveys of the
community structure with the production of phytosociological tables are still very necessary. From our viewpoint,
there is no other way to qualify, quantify and model the diversity of the different vegetation types of Brazil unless by
means of the incentive not only to field works but also to
the publication of the phytosociological tables in good quality vehicles. However, each field survey should obey to a
minimum set of rules that can yield a threshold of reliability
on the data sampled.
The greatest source of variation in the results among the
different field surveys does not seem to be the sampling
method (plots or quarters) but the different sizes of the
smallest individual included in the sample, provided that the
sample size is not smaller than a critical minimum. Therefore, it is necessary to standardize the size of the smallest
individual to be included in the sample as well as to attempt
to a minimum sample size, which should not be less than
1,000 individuals (Palmer et al. 2000). Information on the
vegetation and the environment is also necessary, and we
indicate as a guide the Vade-Mecum pour le Relevé Méthodique de la Végétation et du Milieu, which was extracted
from the Code pour le Relevé Méthodique de la Végétation
Considering the number of species, would it be
possible to indicate a minimal sampling effort?
There is little available information concerning the sampling effort that is required to warrant the “sufficiency” of a
sample. Two aspects should be considered when we assess
the sample “sufficiency”. One aspect refers to the proportion of species sampled in relation to the total of species
present in the community. The restrict geographic range and
the very low constancy of tree taxa in the Atlantic rainforest
s.s. produce a decay of the floristic similarity with increase102
Tree phytosociology in the Brazilian Atlantic Rainforest. Caiafa and Martins
et du Milieu (Godron et al. 1969). Every phytosociological
survey should give information about the biome and classify the vegetation according to an internationally accepted
system, as well as describe topographic characteristics (altitude, slope aspect, position on the local relief, declivity),
soil characteristics (micro-relief, soil classification, texture
and chemical variables), and climatic characteristics
(monthly and yearly averages of the climatic elements, climate type). Martins (2004) highlighted that the description
of the environment in field phytosociological works is a
base to establish associations between species and environmental variables. Once established, these associations can
be added to the ecological knowledge already published,
and this can allow constructing hypotheses and expectances
on the presence and abundance of species and the magnitude of alpha-diversity. These are key-information concerning conservation of natural areas and remediation of degraded areas.
ACKNOWLEDGEMENTS
This research received financial support from FAPESP (process no.
04/02272-9). We thank Jorge Yoshio Tamashiro for checking the
valid binomials and Valéria Forni Martins for reviewing the manuscript.
REFERENCES
Andrade-Lima D (1966) Vegetação. In: Galvão MV (Ed) Atlas Nacional do
Brasil, IBGE, Rio de Janeiro, sheet no. II-11 Vegetação, 110 pp
Ayres M, Ayres-Júnior M, Ayres DL, Santos AS (2003) Bioestat 3.0: Aplicações estatísticas nas áreas das ciências biomédicas. Sociedade Civil Mamirauá, Belém
Baitello JB, Aguiar OT, Rocha FT, Pastore JA, Esteves R (1993) Estrutura
fitossociológica da vegetação arbórea da Serra da Cantareira (SP) – Núcleo
Pinheirinho. Revista do Instituto Florestal 5, 133-161
Bitterlich W (1984) The Relascope Idea: Relative Measurement in Forestry,
Commonwealth Agriculture Bureaux, Slough, 236 pp
Braun-Blanquet J (1979) Fitosociología: Bases para el Estudio de las Comunidades Vegetales, Blume, Madrid, 820 pp
Câmara IG (2005) Breve histórico da conservação da Mata Atlântica. In: Galindo-Leal C, Câmara IG (Eds) Mata Atlântica: Biodiversidade, Ameaças e
Perspectivas, Conservation Internacional & SOS Mata Atlântica, Belo Horizonte, pp 31-42
Cavassan O (1990) Florística e fitossociologia da vegetação lenhosa em um
hectare de Cerrado no Parque Ecológico Municipal de Bauru. PhD Thesis,
UNICAMP, Campinas, 206 pp
Castro AAJF, Martins FR, Tamashiro JY, Shepherd J (1999) How rich is the
flora of Brazilian Cerrados? Annals of the Missouri Botanical Garden 86,
192-224
Cielo-Filho R (2001) Estrutura de abundância de um trecho da Floresta Estacional Semidecídua no município de Campinas, Estado de São Paulo: Mata
Ribeirão Cachoeira. MSc Thesis, UNICAMP, Campinas, 108 pp
Cottam G, Curtis JT (1956) The use of distance measures in phytossociological sampling. Ecology 31, 451-460
Daubenmire RF (1968) Plant Communities: A Textbook of Plant Synecology,
Harper and How, New York, 300 pp
Dislich R, Cersósimo L, Mantovani W (2001) Análise da estrutura de fragmentos florestais no Planalto Paulistano – SP. Revista Brasileira de Botânica
24, 321-332
Ewald J (2003) A critique for phytossociology. Journal of Vegetation Science
14, 291-296
França GS, Stehmann JR (2004) Composição florística e estrutura do componente arbóreo de uma floresta altimontana no município de Camanducaia,
Minas Gerais, Brasil. Revista Brasileira de Botânica 27, 19-30
Freitas SR (2004) Modelagem de dados espectrais na análise de padrões de
fragmentação florestal na Bacia do Rio Guapiaçu (RJ). PhD Thesis, UFRJ,
Rio de Janeiro, 378 pp
Gandolfi S (1991) Estudo florístico e fitossociológico de uma floresta residual
na área do Aeroporto Internacional de São Paulo, Município de Guarulhos,
SP. MSc Thesis, UNICAMP, Campinas, 232 pp
Gégout JC, Coudun C, Bailly G, Jabiol B (2005) Ecoplant: A forest site database linking floristic data with soil and climate variables. Journal of Vegetation Science 16, 257-260
Gibbs PE, Leitão-Filho HF, Abbot RJ (1980) Application of the point-centred
quarter method in a floristic survey of an area of gallery forest at Moji Guaçu,
SP, Brazil. Revista Brasileira de Botânica 3, 17-22
Godron M, Daget P, Emberger L, Long G, Le Floc’h E, Poissonet J, Sauvage C, Wacquant JP (1969) Code pour le Relevé Méthodique de la Végétation et du Milieu. Centre National de la Recherche Scientifique, Paris, 169 pp
103
Guedes-Bruni RR (1998) Composição, estrutura e similaridade florística de
dossel em seis unidades fisionômicas da Mata Atlântica no Rio de Janeiro.
PhD Thesis, USP, São Paulo, 231 pp
Guedes-Bruni RR, Pessoa SVA, Kurtz BC (1997) Florística e estrutura do
componente arbustivo-arbóreo de um trecho preservado da floresta montana
na Reserva Ecológica de Macaé de Cima. In: Lima HC, Guedes-Bruni RR
(Eds) Serra de Macaé de Cima: Diversidade Florística e Conservação em
Mata Atlântica, Jardim Botânico do Rio de Janeiro, Rio de Janeiro, pp 127146
Hirota MM (2005) Monitoramento da cobertura da Mata Atlântica brasileira.
In: Galindo-Leal C, Câmera IG (Eds) Mata Atlântica: Biodiversidade, Ameaças e Perspectivas, Conservation Internacional and SOS Mata Atlântica, Belo
Horizonte, pp 60-65
Hurlbert SH (1971) The nonconcept of species diversity: a critique and alternative parameters. Ecology 52, 578-586
IBGE (2006) Available online: www.ibge.gov.br
Ivanauskas NM (1997) Caracterização florística e fisionômica da floresta
atlântica sobre a formação Pariquera-Açu, na Zona da Morraria Costeira do
estado de São Paulo. MSc Thesis, UNICAMP, Campinas, 217 pp
Jarenkow JA (1994) Estudo fitossociológico comparativo entre duas áreas com
mata de encosta no Rio Grande do Sul. PhD Thesis, UFSCAR, São Carlos,
125 pp
Jaster CB (1995) Análise estrutural de algumas comunidades florestais no
litoral do estado do Paraná, na área de domínio da floresta ombrófila densa –
Floresta Atlântica. MSc Thesis, Georg-August University, Göttingen, 116 pp
Jesus RM , Rolim SG (2005) Fitossociologia da Floresta Atlântica de Tabuleiro
em Linhares (ES). Boletim Técnico SIF 19, 1-149
Leigh EG, Davidar P, Dick CW, Puyravaud JP, Terborg J, Wright SJ (2004)
Why some tropical forests have so many species of trees? Biotropica 36, 447473
Leitão-Filho HF (1994) Diversity of arboreal species in the Atlantic Rainforest.
Anais da Academia Brasileira de Ciências 66, 91-96
Levine DM, Berenson ML, Stephan D (2000) Estatística: Teoria e Aplicações
usando Microsoft® Excel em Português. LTC Editora, Rio de Janeiro, 811 pp
Lobão DEVP (1993) O emprego do método de quadrantes na análise fitossociológica de um fragmento de mata Atlântica, no Sudeste da Bahia. MSc
Thesis, UFV, Viçosa, 121 pp
Martins FR (1989) Fitossociologia de florestas do Brasil: um histórico bibliográfico. Pesquisas série Botânica 40, 103-164
Martins FR (1991) Estrutura de uma Floresta Mesófila, Editora UNICAMP,
Campinas, 246 pp
Martins FR (2004) O papel da Fitossociologia na conservação e na bioprospecção. Anais do 55q Congresso Nacional de Botânica: Simpósios, Palestras e
Mesas-Redondas. Socciedade Botânica do Brasil and Universidade Federal
de Viçosa, Viçosa, edition on CD (non-paginated)
Maycock PF (1967) JOZEF PACZOSKI: founder of the science of Phytosociology. Ecology 48, 1031-1034
Mueller-Dombois D, Ellenberg H (1974) Aims and Methods of Vegetation
Ecology, Wiley, New York, 547 pp
Myers N (1990) The biodiversity challenge: expanded hot-spots analysis. The
Environmentalist 10, 243-255
Myers N, Mittermeier RA, Mittermeier CG, da Fonseca GAB, Kent J
(2000) Biodiversity hot-spots for conservation priorities. Nature 403, 853858
Negreiros OC, Custódio-Filho A, Dias AC, Franco GADC, Couto HTZ, Vieira MGL, Moura-Netto BV (1995) Análise estrutural de um trecho de Floresta Pluvial Tropical, Parque Estadual de Carlos Botelho, núcleo Sete Barras
(SP - Brasil). Revista do Instituto Florestal 7, 1-33
Negrelle RRB (2002) The Atlantic forest in Volta Velha Reserve: a tropical rain
forest site outside the tropics. Biodiversity and Conservation 11, 887-919
Oliveira-Filho AT, Fontes MAL (2000) Patterns of floristics differentiation
among Atlantic forests in south-eastern Brazil, and the influence of climate.
Biotropica 32, 793-810
Palmer MW, Clark D, Clark D (2000) Is the number of tree species in small
tropical forest plots nonrandom? Community Ecology 1, 95-101
Pessoa SVA, Guedes-Bruni RR & Kurtz BC (1997) Composição florística e
estrutura do componente arbustivo-arbóreo de um trecho secundário de floresta montana na Reserva Ecológica de Macaé de Cima. In: Lima HC, Guedes-Bruni RR (Eds) Serra de Macaé de Cima: Diversidade Florística e Conservação da Mata Atlântica, Jardim Botânico do Rio de Janeiro, Rio de Janeiro, pp 147-169
Pielou EC (1977) Mathematical Ecology, Wiley, New York, 385 pp
Salomão RP, Liboa PLB (1988) Análise ecológica da vegetação de uma
floresta pluvial tropical de terra firme, Rondônia. Boletim do Museu
Paraense Emílio Goeldi série Botânica 4, 195-233
Scudeller VV, Martins FR (2003) FITOGEO – um banco de dados aplicado à
fitogeografia. Acta Amazonica 33, 9-21
Scudeller V, Martins FR, Shepherd GJ (2001) Distribution and abundance of
arboreal species in the Atlantic Ombrophilous Dense Forest in southeastern
Brazil. Plant Ecology 152, 185-199
Silva AF, Shepherd GJ (1986) Comparações florísticas entre algumas matas
brasileiras utilizando análise de agrupamento. Revista Brasileira de Botânica
9, 81-86
Functional Ecosystems and Communities 1(2), 95-104 ©2007 Global Science Books
Silva AF, Leitão-Filho HF (1982) Composição florística e estrutura de um
trecho da mata atlântica de encosta no município de Ubatuba (São Paulo,
Brasil). Revista Brasileira de Botânica 5, 43-52
Siqueira MF (1994) Análise florística e ordenação de espécies arbóreas da
Mata Atlântica através de dados binários. MSc Thesis, UNICAMP, Campinas,
143 pp
Sneath PHA, Sokal RR (1973) Numerical Taxonomy, W.H. Freeman, San
Francisco, 573 pp
Stevens PF (2006 onwards) Angiosperm Phylogeny Website. Available online:
www.mobot.org/MOBOT/research/APweb
Tabarelli M, Mantovani W (1999) A riqueza de espécies arbóreas na floresta
atlântica de encosta no estado de São Paulo (Brasil). Revista Brasileira de
Botânica 22, 217-233
Tavares MCG, Rodal MJN, Melo AL, Lucena MFA (2000) Fitossociologia
do componente arbóreo de um trecho de floresta ombrófila montana do
Parque Ecológico João Vasconcelos Sobrinho, Caruaru, Pernanbuco. Naturalia 25, 243-270
Torres RB, Martins FR, Kinoshita LS (1997) Climate, Soil and tree flora relationships in forests in the state of São Paulo, southeastern Brasil. Revista
Brasileira de Botânica 20, 41-49
Veloso HP (1945) As comunidades e estações botânicas de Terosópolis, estado
do Rio de Janeiro.(Com um ensaio de uma chave dendrológica). Boletim do
Museu Nacional 3, 1-95
Veloso HP (1946) A vegetação no município de Ilhéus, estado da Bahia I. Estudo sinecológico das áreas de pesquisa sobre a febre amarela silvestre realizada pelo S.E.P.F.A. Memórias do Instituto Oswaldo Cruz 44, 13-103
Veloso HP (1992) Sistema fitogeográfico. In: Manual Técnico da Vegetação
Brasileira, IBGE, Rio de Janeiro, pp 9-34
Veloso HP, Klein RM (1957) As comunidades e associações vegetais da mata
pluvial do sul do Brasil. I. As comunidades do município de Brusque, estado
de Santa Catarina. Sellowia 8, 81-235
Veloso HP, Klein RM (1968a) As comunidades e associações vegetais da mata
pluvial do sul do Brasil. V. Agrupamentos arbóreos da encosta catarinense,
situados em sua parte norte. Sellowia 20, 53-126
Veloso HP, Klein RM (1968b) As comunidades e associações vegetais da mata
pluvial do sul do Brasil. VI. Agrupamentos arbóreos dos contra-fortes da
Serra Geral situados ao sul da costa catarinense e ao norte da costa sul-riograndense. Sellowia 20, 127-180
Vieira MGL, Couto HTZ (2001) Estudo do tamanho e número de parcelas na
Floresta Atlântica do Parque Estadual de Carlos Botelho, SP. Scientia Forestalis 60, 11-20
Wright SJ (2002) Plant diversity in tropical forests: a review of mechamisms of
species coexistence. Oecologia 130 1-14
Zar JH (1999) Biostatistical Analysis, Prentice Hall, New Jersey, 662 pp
104
Baixar