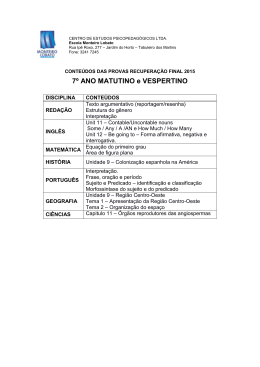
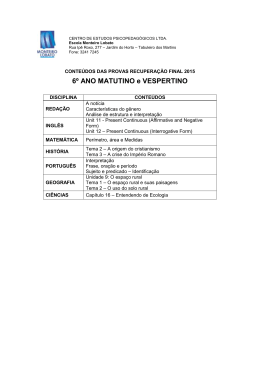
2007 International Nuclear Atlantic Conference - INAC 2007 Santos, SP, Brazil, September 30 to October 5, 2007 ASSOCIAÇÃO BRASILEIRA DE ENERGIA NUCLEAR - ABEN ISBN: 978-85-99141-02-1 (9$/8$7,212)2,/:$7(56(3$5$725681,76,1,1'8675,$/ ())/8(17686,1*5$',2$&7,9(75$&(56 /XtV(GXDUGR%UDQGmR $UPL:DQGHUOH\GD1yEUHJD H 5HQH/DQGLP2OLYHLUD 1 2 Instituto de Engenharia Nuclear ( IEN / CNEN RJ ) Caixa Postal 68550 Rio de Janeiro - RJ - Brasil - CEP 21.945-970 [email protected] Instituto Nacional de Controle de Qualidade em Saúde (INCQS / FIOCRUZ) Av. Brasil, 4365 - Manguinhos, Rio de Janeiro - RJ - Brasil - CEP: 21.040-900 [email protected] 3 Universidade Federal do Rio de janeiro – Escola de Química [email protected] $%675$&7 In this work a methodology to study and evaluate oil/water separators with radioactive tracers is presented. These units make possible to remove residues of organic phase present in the effluent and allow to reusing the water in other operations. As radioactive tracers we use 182 Br for the aqueous phase and 123 I for organic phase and two radioactive detectors ( NaI 2x2”) register the displacement of the tracers in the unit. With this methodology was possible to analyze the response of the unit in various experimental situations and identify problems in its operation, which interfere in the final quality of the effluent treatment. ,1752'8&7,21 The objective of this work was to develop methodology using radioactive tracers to evaluate units used in industry to separate different phases in the effluent as water and oil. This methodology is better than traditional methods that have been used to study the characteristics of phase separation units because with it we can use two different tracers, one for each phase, and measure in real time the situation inside the tank. 0(7+2'2/2*< In systems of oil/water phase separation, the flow of these materials in the tank depends on the hydrodynamic and physical/chemical characteristics of the effluent (density, composition, viscosity); the feeding and the exit conditions of the effluent; the geometry of the tank; etc. Due to the great number of different phenomena are occurring in simultaneous inside the tank the elaboration of an analytical model which represents the real separation process is extremely complex. Complex flow patterns can easily be monitored using radioactive tracers technique with a statistical formalism called Residence Time Distribution Functions (RTD), these functions correlate some statistical parameters such as mean residence time and statistical dispersion to the characteristics of the tracer displacement in the unit [1] The technique considers that each tracer particle has an “history” when it´s moving inside the tanks and defines as its “age” the time it remains in the unit. Thus, the RTD is defined as a statistical distribution for ages considering all the elements had entered and left the unit during the data acquisition time [2]. The technique of impulse/repost is used to evaluate a phase separation unit: all the characteristics of the tank are measured registering the response of the unit Cout (t) to a to a known impulse of tracer material in its entrance Cin(t). With this procedure is possible to know the processes inside the tank and measure its proprieties as mean residence time and the characteristic curve. For the unit we can define the following relationship: C out onde: ³C f 0 in (t) u H(t G C out (t) C in (t) H(t) (1) H(t) - Characteristic curve of the unit RTD ( RTD ) Cint(t) - stimulus in the entrance ( tracer injection registered detector) Cout(t) - exit response curve (tracer data registered in the unit exit) Using of Fourier Transform we can write the equation (1) as: F >H (t)@ F [C out (t)] F [C in (t)] (2a) ³ f H (iw ) C out ( iw ) C in ( i w ) H(iw) ³ f f f C out (t) u exp( i u w u t) dt C in (t) u exp( i u w u t) dt onde: F[H (t)] - Fourier transform of unit characteristic curve RTD F[Cint(t)] - Fourier transform of tracer injection curve F[Cout(t)] - Fourier transform of tracer exit curve W – Fourier frequency Using Euler equation: INAC 2007, Santos, SP, Brazil. (2b) A out i u Bout A in i u Bin H (iw) ( 3a ) ª A out u A in Bout u Bin º ª B u A in A out u Bin º i u « out « » » 2 2 A out Bout A 2out B2out ¬ ¼ ¬ ¼ H (iw) H COS H (iw) ( 3b ) i u H SEN ( 3c ) where: Aout - coefficient of Fourier series cosine expansion (exit curve) Bout - coefficient of Fourier series sine expansion (exit curve experimental data) Ain - coefficient of Fourier series cosine expansion (injection curve experimental data) Bin - coefficient of Fourier series sine expansion (injection curve experimental data) Hcos - coefficient of Fourier series cosine expansion (characteristic curve experimental data) Bsen - coefficient of Fourier series sine expansion (characteristic curve experimental data) The equations (3ª), (3b) e (3c) represent the mathematical solution of the deconvolução of the equation (1). From the Fourier coefficients of experimental data registered by the detectors (located in the entrance and the exit of the unit) it is possible to get the Fourier coefficients of the characteristic curve of the tank and the function H (t) is measured calculating the inverse Fourier transform of equation (3c) using numerical methods as shown in equation 4: F -1 >H (iw)@ H (t) H (t) F -1 >H cos i u H sin @ (4) To measure correctly the function H (t) it is essential that tracer and its phase possess the same hydrodynamic characteristics and also that the tracer doesn't react or precipitate inside the tank. The mean residence time for the unit will be calculated by equation (5): W ³t u H(t) dt t2 t1 where: t1 is instant of time of the beginning the register of experimental data t2 the instant of time in the end of the register of experimental data W mean residence time INAC 2007, Santos, SP, Brazil. (5) :DWHURLO6HSDUDWLQJ7DQN The tank has rectangular format, made completely in PVC and it is composed by two independent compartments. The first compartment is the point by where the unit is fed and also the point where the tracer materials are injected (as fast pulse). This compartment possesses a mechanical agitator and acts as a fast mixer that aids in the homogenization of the tracer in the effluent. The second compartment is the area where the process of separation happens and it is the largest portion of the unit. This part of the tank has (100 x 40 x 30) cm and it is divided in two independent chambers separated by a double chicane which act as level crossing gate and reduces the velocity of both phases in the effluent. This double baffle plates promote a damping in the displacement of the effluent and this damping accelerates the separation process of the phases. In the first chamber happens most of the oil agglutination process and in this part of the tank oil is separated from water and can be collected in a special tank. In the second camera each one of the two phases present in the effluent has already been separated and they are collected by two different exist, one located on the floor used to collect water that will be reuse in the industry and other located on the border of the tank and used to collect the oil the remaining oil in the effluent. Two NaI (2 x 2 “) scintillator detectors cintiladores had been used to monitor the water-oil separation process. The first one, located in the first chamber of the tank, was used to register the passage of booth phases and the second was positioned in the water exit and was used to register the signal of the aqueous phase and measure the characteristic curve of the separation tank and the mean residence time. All the experiments had been done considering a mixture of 85% of water and 15% of oil and flow of feeding of the constant and equal to 2,0 l/min. 5DGLRDFWLYH7UDFHUV8VHGWR0HDVXUHWKH0HDQ5HVLGHQFH7LPH Two different radioactive tracers had been used in the experimental tests, 140La (aqueous solution of La3Cl2) for the aqueous phase and 123I for the organic phase. In both cases it is essential that the tracers do not precipitate, do not be absorbed by the tank walls and mainly the tracer of one phase do not migrate to the other phase. To marc the organic phase it has been was used the method suggested by Moreau and Mitta [3,4]. Basically the method consist in incorporate the radioactive iodine to the oil molecule by eletrofílica substitution reactions using radioactive iodine as monochloride (ICl). Different samples of motor oil used in motors and vacuum pumps were marked, each one was measured in a calibrated system used to measure total activity and before after the process and the yield was around 85%. In all experiments samples of marked oil (volume of 5 ml) with 0.5 mCi of 123I were used as organic tracer and for aqueous phase 5.0g of La3O2 had been radiated in the Argonauta Reactor and later dissolved in HCl, resulting in a aqueous solution of 140La with 0.2 mCi and volume of 2.0 ml INAC 2007, Santos, SP, Brazil. 5(68/76$1'',6&866,216 Na primeira etapa dos testes foram realizados experimentos independentes com cada uma das fases com os dados sendo registrado pelo detetor posicionado na região onde o processo de separação de fases esta ocorrendo. Com a unidade totalmente preenchida de água, inicio-se a alimentação da mistura água/óleo proveniente do reservatório de mistura e 5 minutos após injetou-se um pulso rápido do traçador radioativo no compartimento de mistura rápida da unidade de separação. A aquisição dos dados iniciou-se no mesmo instante da injeção O registro da passagem do material marcado e mostrado na Figura 1A tanto para a fase aquosa como para a fase orgânica. (A) (B) ( W ( W ( ( )DVH$TXRVD ( ) DVH$TXRVD ( )DVH2UJ QLFD ( ( ( ( )DVH2UJ kQLFD ( ( 7HPSRP 7HPSRP Figura 1 - Deslocamento do efluente pelo tanque de separação: (A) sinal registrado na posição 1 (câmara de aglutinação); (B) sinal registrado na posição 2 (saída da unidade ) Inicialmente as duas curvas apresentam um crescimento rápido indicando uma entrada rápida na unidade com o sinal da fase aquosa apresentando máximo em torno de 10 minutos e decaindo lentamente ate atingir o nível mínimo em 50 minutos demonstrando que a fase aquosa desloca-se pela unidade em direção a saída sem ficar retida na região de aglutinação. Já para a fase orgânica, os dados mostram que nos primeiros 15 minutos há um aumento na intensidade do sinal indicando que o óleo marcado com esta se movimentando em direção a região de aglutinação. À medida mais efluente entra a unidade o sinal registrado pelo detetor vai apresentando um pequeno decréscimo isso devido ao fato que o traçador esta sendo diluído no volume total de óleo que está aumentado com a alimentação constante da unidade. A figura 1B apresenta o sinal registrado pelo detetor posicionado na saída da fase aquosa e o resultado é mostrado na Figura 2. Para a fase aquosa, o sinal do traçador começa a ser registrado 8 minutos após a injeção e atinge o máximo em torno de 26 minutos e decaindo lentamente ate atingir o nível da radiação de fundo. A curva apresenta um comportamento típico para o deslocamento do efluente em um tanque com retenção (provocada pela presença das chicanas) com o tempo médio de residência calculado pela técnica de deconvolução igual há 43 min. Para a fase orgânica marcada, o sinal registrado permanece no nível da radiação de fundo ou seja, o detetor não acusa a presença do traçador orgânico o que indica que o todo o óleo esta retido na região de aglutinação. INAC 2007, Santos, SP, Brazil. Um dos problemas encontrados em tanques de separação é o fenômeno de canalização e com a finalidade de identificar na curva resposta da unidade a existência de uma canalização abriu-se na parte superior na chicanas de separação um orifício com 2,0 cm de diâmetro e foram repetidas as mesmas condições de operação e injeção dos traçadores. A figura 2 mostra o resultados registrados pelo detetor posicionado na saída da unidade. ( W ( ( ( ) DVH$T XRVD ( )DVH2UJ kQ LFD ( ( 7HPSRP Figura 2 – Curva resposta da unidade de separação com a simulação de uma canalização Ao ser injetado, o material marcado entrou na unidade e parte dele foi canalizado diretamente para a saída.A curva resposta para a fase orgânica mostra que o óleo não fica retido no primeiro compartimento da unidade, o comportamento crescente da curva entre 20,0 e 30,0 minutos indica que o óleo esta se deslocando e movimentando-se para a saída da unidade. O mesmo fenômeno de canalização pode ser observado na curva da fase aquosa pela existência de um pico em torno de 8 minutos indicando que uma parte do material marcado sai com um tempo de residência menor que o característico da unidade. &21&/86,21 The main advantage of using radioactive tracer to analyze oil/water separating tanks is its versatility because using this methodology is possible to study different conditions existing in industry. All the procedures are independent of the physical characteristics of the tank (size, form and total volume) and can be used also in case of units with great dimensions. In this case is possible to use the scintillator detectors inside special cases and dived in the effluent. Another advantage is that the technique allows to measure in real time the residence time distribution function and the mean residence time for booth phases present in the effluent and so to identify an operational problem in the unit INAC 2007, Santos, SP, Brazil. %,%/,2*5$),$ 1. Luis E. Brandão Otimização de Unidades de Tratamento de Águas Residuais Urbanas e Industriais Empregando Traçadores Radioativos Tese de Doutorado COPPE/UFRJ 2001 2. P. V.Dankwerts Continuous Flow Systems Distributions of Residence Times Chem. Eng. Sc. Y , n. 1, p 1-18, 1953 3. R Moreau ; H. Renault and A. Lemonier. Bull. Soc. Chim. France Y, 1958 4. E. A. Mitta; M. A. Danker Metodo Simplificado para Marcación de Lípidos con Yodo131 CNEA-182 1965 5. J. Thýn Process analysis with nuclear techniques Isotopenpraxis Y, n. 11, p. 365-372, 1983 INAC 2007, Santos, SP, Brazil.
Baixar