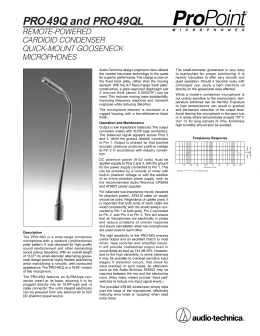
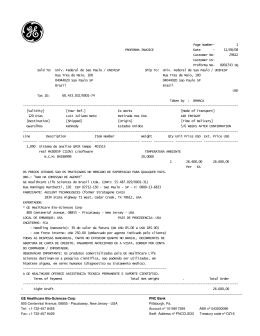
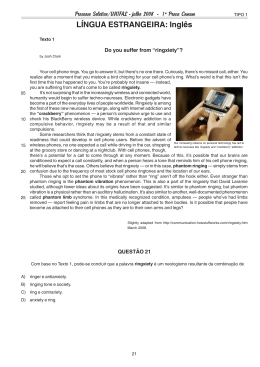
Pilot study: relative dose of the TLD, OSL and Radiochromic film applied
in CT exams dosimetry
Kikuti, C. F.1, Maia, R. S. I.2, Romano, R. F. T.2 ,Daros, K. A. C 2
1
Hospital Universitário Maria Aparecida Pedrossian, Universidade Federal do Mato Grosso
do Sul, Av Filinto Müller, 1, Campo Grande, MS, CEP: 79070-900
2
Departamento de Diagnóstico por Imagem, Escola Paulista de Medicina, Universidade
Federal de São Paulo, Rua Napoleão de Barros, 800, São Paulo, SP, CEP: 04024-002
E-mail: [email protected]
At DDI/UNIFESP, the abdomen and chest CT exams correspond to 38% of the exams,
becoming the focus of studies. The aim of this study is to assess the relative dose
using TLDs, OSLs and RF for the evaluation of the dose distribution in the skin in
abdomen CT exams. The simulation of the CT exam was performed in an
anthropomorphic phantom, using a CT scanner Philips, Brilliance/64 and TLDs, OSLs
and RF fixed along the sagittal axis of the phantom. The OSLs showed similar
performance to the TLDs and RF shows low accuracy, resulting in an average value
(0.927±0.022).
Keywords: computed tomography; abdomen; dosimetry
1. INTRODUCTION
In the last 10 years, it has been possible to see a
great increase in the number of the Computed
Tomography (CT) exams done in the medical
diagnostic centers worldwide (1–3). The studies
show that in 2010, only in the USA, more than
60 million CT exams were done on medical
diagnostic centers (4). In Brazil, the National
Register of Health Facilities (CNES, Cadastro
Nacional de Estabelecimentos de Saúde) shows
that there are 3312 CT scanners, 290 of them in
São Paulo (5,6).
At Diagnostic Image Department (DID) of the
Federal University of São Paulo (UNIFESP), the
abdomen and chest CT exams correspond to 38%
of the exams becoming the focus of studies. For
more than 30 years, the team of the Coordination
of Medical Physics (C0FIMED) of the
DID/UNIFESP, have been doing the control of
the doses resulting from radiology exams,
making use of instrumentation and simulators
more suitable for each method of diagnostic
imaging. For dosimetric evaluation on the patient
measures,
the
CoFIMED
uses
the
thermoluminescent
dosimeter
(TLD),
Radiochromic film (RF) and most recently, the
optically stimulated luminescence (OSL)
technology (7,8). According to the literature,
among all the above methods, the TLD is already
well established in vivo on CT dosimetic
application and the FR and OSL are still being
studied (7–10).
8th Brazilian Congress on Metrology, Bento Gonçalves/RS, 2015
1
2. OBJECTIVE
The aim of this pilot study is to assess the relative
dose response on the volume CT dose index
(CTDIvol), using three dosimetry systems, TLDs,
OSLs and RF for the evaluation of the
distribution of the dose in the skin in abdomen
computed tomography exams.
Figure 2: 40 unities of OSLs fixed along of the
sagittal axis on phantom surface.
3. METHODOLOGY
The study was conducted at DDI/UNIFESP,
using a CT scanner Philips, Brilliance/64. The
simulation of the CT exam was performed in an
anthropomorphic phantom, RSD, ART Phantom
subjected to routine exposure conditions for
examinations of an adult abdomen, generated by
120kV, 265 mAs and 0.75 pitch in helical mode.
Along the sagittal axis of the phantom surface, it
was fixed 40 unities of TLD100, Harshaw
(Figure 1) and 40 unities of OSLs,
LANDAUER® dosimeters (Figure 2). In a
second exposure, the same exam protocol was
followed, having set 40 cm of the RF, XR-CT,
Gafchromic® (Figure 3).
The CTDI volume was calculated according to
the recommendations of the AAPM-96 using an
acrylic simulator with a diameter of 32 cm and
ionization chamber (IC) Victoreen pencil type,
model 660 electrometer, probe 660-6 (12,13).
Figure 1: 40 unities of TLD100 fixed along the
sagittal axis on phantom surface.
Figure 3: 40 cm of the RF fixed along the
sagittal axis on phantom surface.
4. RESULTS
The CTDIvol result was 22.3±0.3 mGy.
The figure 4 represents the distribution of the
relative dose response of the CTDIvol to TLDs,
OSLs and RF setting along the sagittal axis on
the phantom’s surface. To each dosimetry system,
the points were normalized as a function of the
highest value obtained among the measurement
results. The error bars indicated in the figure 4
show that the maximum error associated for each
detector used was 5% to TLD and OSL and 3%
to RF.
8th Brazilian Congress on Metrology, Bento Gonçalves/RS, 2015
2
Figure 4: Distribution of the relative dose response on the CTDIvol, using three dosimetry systems,
TLDs, OSLs and RF.
1,20
Relative dose
1,00
0,80
0,60
0,40
0,20
0,00
0
50
100
150
200
OSL
250
TLD
RF
5. DISCUSSION AND CONCLUSION
The TLDs have been used for more than 30
years in radiological exams dosimetry. As it was
expected, this study reassured the dosimetry
qualities for CT doses evaluations (1). The OSLs
showed a similar performance to the TLDs. In the
literature, only a few publications mention the
usage of OSL dosimetry in CT evaluations.
However, this study demonstrates its viability
and accuracy for this purpose. It also highlights
the practicality of OSLs when compared to the
TLDs processes, which require special heat care
for this purpose. Despite being widely used in the
dosimetry of the diagnostic imaging methods and
therapies that use fluoroscopy, in the CT exams
the RF application is still little explored (9,10).
As seen in the figure 4, in this study RF shows
low accuracy, resulting in an average value
(0.927 + -0.022) on all the surface of the exposed
area simulator.
300
350
400
450
length along the sagittal axis (mm)
7. REFERENCES
1.
Daros KAC. Avaliação das doses de
radiação X em exames pediátricos de TC
de crânio com base em estudos de
otimização.
[Internet].
Radiologia
Brasileira. UNIFESP - Campus São
Paulo; 2005 [cited 2013 Jan 30].
2.
Dougeni E, Faulkner K, Panayiotakis G.
A review of patient dose and optimisation
methods in adult and paediatric CT
scanning. Eur J Radiol [Internet]. 2012
Apr [cited 2015 Jun 15];81(4):e665–83.
3.
Kritsaneepaiboon S, Trinavarat P,
Visrutaratna P. Survey of pediatric MDCT
radiation dose from university hospitals in
Thailand: a preliminary for national dose
survey. Acta radiol. SAGE Publications;
2012;53(7):820–6.
4.
Augusto F. Estudo da Qualidade da
Imagem e Índices de Dose em TC.
2009;72.
8th Brazilian Congress on Metrology, Bento Gonçalves/RS, 2015
3
5.
MARTINS, B. P. ; FREITAS, M. B. ;
FERNANDES ARC. . Banco de dados do
Sistema Único de Saúde (DATASUS):
Levantamento e análise da distribuição de
equipamentos de diagnóstico por imagem
e terapia e a frequência de procedimentos
realizados no Brasil. 2013.
6.
Ministério da Saúde do Brasil.
Departamento de Informática do SUS.
Banco de Dados do Sistema Único de
Saúde. 2013.
7.
Sousa LO de. Caracterização de sistemasa
de luminescência opticamente estimulada
(OSL) para doses liberadas em
cobaltoterapia. Universidade Federal do
Rio de Janeiro; 2009.
8.
Matsushima
LL, Sp I.
estimulada
LiF : Mg,Ti
Beta. :1–4.
9.
Oliveira BB. Estimation of MSAD values
in computed tomography scans using
radiochromic films *. 2013;46(3):96–100.
10.
Tiago da Silva Jornada. Estudo das
grandezasdosimétricas da qualidade da
imagem em exames pediátrico de tporax e
abdômen por tomografia computadorizada
[Internet]. 2013.
LC, Veneziani GR, Campos
Luminescência opticamente
empregando dosímetro de
para dosimetria da radiação
8th Brazilian Congress on Metrology, Bento Gonçalves/RS, 2015
4
Baixar