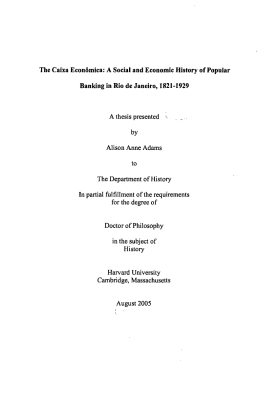
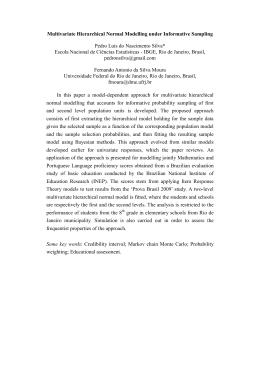
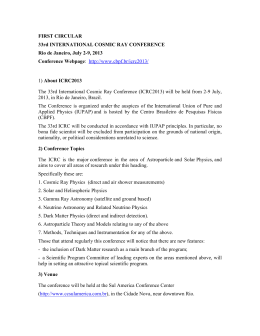
Business and Management Review Vol. 5(03) pp. 68 – 77 August, 2015
Available online at http://www.businessjournalz.org/bmr
ISSN: 2047 - 0398
PORTS EFFICIENCY ANALYSIS OF RIO DE JANEIRO OPERATING WITH CONTAINERIZED
CARGO TRANSPORTATION USING THE TECHNIQUE DATA ENVELOPMENT ANALYSIS
ANÁLISE DE EFICIÊNCIA DE PORTOS DO RIO DE JANIERO QUE OPERAM COM O
TRANSPORTE DE CARGA CONTEINERIZADA UTILIZANDO A TÉCNICA DE ANÁLISE
ENVOLTÓRIA DE DADOS - DEA
Tafarel Carvalho de Gois
Graduando em Engenharia de Produção, Centro Universitário Estácio de Brasília (Brasil)
E-mail: [email protected]
Reinaldo Moreira Del Fiaco
Aluno Especial do Mestrado em Transportes – UnB (Brasil)
E-mail: [email protected]
José Soares Pires
Mestre em Transportes – UnB (Brasil)
E-mail: [email protected]
Roberto Bernardo da Silva
Doutorando em Transportes, Universidade de Brasília – UnB (Brasil)
E-mail: [email protected]
Tharcia Suelen Vasconcelos Silva
Mestrando em Transportes – UnB (Brasil)
E-mail: [email protected]
Paulo Henrique da Silva Costa
Mestrando em Transportes – UnB (Brasil)
E-mail: [email protected]
ABSTRACT
The growing Brazilian production rate requires a better flow of products and raw materials every day.
Cabotage appears as an option among the transportation modes combining reliability and energy efficiency in
order to maximize profits and reduce pollution. In this context, the study aims to examine the effectiveness of
five terminals for three years. They operate with containerized cargo transport in cabotage in order to identify
which terminal is more efficient.
Keywords: Cabotage, Logistics, Transportation, Data Envelopment Analysis.
RESUMO
A crescente taxa de produção brasileira exige, a cada dia, um melhor escoamento de produtos e matérias
primas. A Cabotagem surge como opção entre os modais de transportes aliando confiabilidade e eficiência
energética de forma a maximizar os lucros e diminuir a poluição. Nesse contexto, o trabalho pretende analisar
a eficiência de cinco terminais, durante três anos, que operam com transporte de carga conteinerizada na
cabotagem, a fim de identificar qual terminal é mais eficiente.
1. INTRODUCTION
According OLIVEIRA (2011), Cabotage is the term fromFrench origin from term caboter which means
navigation between entre ports and cables in the same country. About the term Navigation FIACO (2014), apud
ROOS (1989), “constantly determine two elements, namely: location and orientation”. The Act 9432/1997
BRASIL (1997) defines cabotage as performed between ports or points of the Brazilian territory using the sea or
shipping routes and inland waterways.
According RODRIGUES (2003), Brazil is a country characterized by a coastline of over seven thousand
kilometers of coast in length and had a colonization process done by Portugal's coast to the interior, which led to
68
Business and Management Review Vol. 5(03) pp. 68 – 77 August, 2015
Available online at http://www.businessjournalz.org/bmr
ISSN: 2047 - 0398
a concentration of approximately 80% of the population and over 70% of PIB (Gross Domestic Product) 200 km
of coast. Because of this, cabotage has proven to be an advantageous option for cargo movement in Brazil and
its poor management is a critical problem because it generates burden for the entire population and loss of
competitiveness of products both in import and in export.
Despite the importance of coastal shipping its secluded management does not allow the generation of an
efficient logistics model. It is necessary to think cabotage as a single resource for a multimodal management
system that allows it to integrate other existing transportation modes.
According BALLOU (2001), transport-related costs represent the most important element of the logistics cost
for most companies. Transportation modes can be divided into: road, rail, waterway, pipeline and air,
MONTEIRO (1997).
For BALLOU (2001), before the company choose the mode of transport to be used or service offered within
this, several aspects must be analyzed in order to take into account, among other factors, frequency, security,
availability and speed.
FLEURY (2003), says that the shipping rates to differents modes of transports in Brazil have the following
descending order: air, road, rail, pipeline and waterway.
For the Confederação Nacional dos Transportes (CNT- 2014), the Brazilian Transport Matrix is distributed as
shown in table 1.
Note that the road transport represents more than half of all percentage involved in cargo transportation in
Brazil. According JÚNIOR et al (2013), the Brazil has a transport matrix delayed and expensive, evidenced fact
when compared to countries with large territory.
2. WATERWAY MODAL
According NOVAES et al. (2006), the Brazilian cargo transportation sector through a contradictory period,
considering that with privatization, there was a partial revival of rail and port systems. On the other hand, there
are still many shortcomings regarding infrastructure that must be solved for more efficient distribution of
products in the domestic market by increasing the country's competitiveness in foreign markets.
ERHART and PALMEIRA (2006) claim that, in Brazil, the lack of planning and investment in the transport
sector imply the inability to keep up with demand. The authors also claim that some risk factors can already be
seen, such as a fleet of trucks and very old locomotives, most of the roads in terrible conditions, low availability
of railway infrastructure and air and waterway systems with low participation. According MOREIRA (2011),
public ports and private port terminals generate a favorable macroeconomic environment to coastal shipping
compared to road transport.
When analyzing the configuration of the first Brazilian captaincies, in Figure 1, and do an association with the
current territorial occupation of the Brazilian territory, found in Figure 2, we see that the claims of
RODRIGUES (2003) and MOREIRA (2011) eattic correct. On the map below we see the distribution of the
Brazilian urban population according to the census conducted by the Instituto Brasileiro de Geografia e
Estatística (IBGE), during 2010.
3. CABOTAGE
The ANTAQ (2014) defines cabotage as navigation performed between ports of Brazil, using only the sea or the
combination of sea with the inland waterways. We'll talk of Cabotage on a specific topic. For SILVEIRA
JÚNIOR et al. (2013), transport via cabotage is a viable option for minimizing costs in freight transport in the
country, especially with the implementation of the container as developers, increasing the level of service on
shipping.
For LANCHMANN and CASTRO JÚNIOR (2009) apud from CARVALHO et al. (2010), the main
impediments to the development of cabotage in Brazil, especially when comparing with other countries like
Japan and the United States are the burden on the taxes and the bureaucracy.
CARVALHO et al. (2010) claim that although cabotage be used in cargo transportation as solid and liquid bulk,
the use of containers shows positive signs in the cabotage transport.
69
Business and Management Review Vol. 5(03) pp. 68 – 77 August, 2015
Available online at http://www.businessjournalz.org/bmr
ISSN: 2047 - 0398
MOURA e BOTTER (2011) claim that the origin of the container occurred in the 60s, bringing standardization
and generating gains across the logistics network.
GOEBEL (1996), says “the container, which follows the international standard established by ISO, is a
transportation equipment, not just a form of cargo securing ".
PRATA (2006) states that the most widely used containers are the 20 'x 8' x 8 ', these dimensions being used as
the internationally adopted standard module, called Twenty Feet Equivalent Units (THY) or 20 feet Equivalent
Unit.
SANTOS (2012) It states that the container has enabled the rapid exchange of a modal to another. For DUBKE
(1996), the container is designed to facilitate the transport of goods by one or more modes of transport.
For BALLOU (2008), the standard container is a device that may be transferable to all modes of ground
transportation, except for pipeline transportation. The author also states that the container avoids costly and slow
downloads of small loading units at interchange points. It also offers a service door to door when combined with
road transportation. This evolution was very important because of the shipping companies operating on port
container ships can offer an integrated transport service, so that integrated ship-truck services can be offered.
However, according SILVEIRA JÚNIOR et al (2013), only 12 of the 35 existing public ports receive continuous
cabotage services, still receiving a small number of routes assigned to cargo transport.
STOPFORD (2004) It states that a general cargo vessel of 22,000 DWT (Dead-Weight Tonnage) occupied 40%
of all their time in port, while a 47,000 DWT ship door-container held only 17% of their time in port. Therefore,
a ship with more than double the cargo can stay in port by a much lower than general cargo vessel amount of
time.
4. METHODOLOGY
This work aims to analyze the efficiency of terminals operating on cabotage. According VERGANA (2004), this
research can be characterized as descriptive and quantitative, by the fact that, by applying the method known as
data envelopment analysis, we seek to know the efficiency of port terminals operating on coastal and provide a
literature review on the issues involving the search.
According BERTOLOTO and SOARES de MELLO (2011), the method of data envelopment analysis (DEA)
emerged in 1978, based on a research developed by Farrel (1957), with the model developed by Charnes,
Cooper e Rhodes. This model aims to analyze the efficiency of a set of decision makers units, the English
"Decision Making Units" (DMUs), who need multiple inputs (resources) to produce multiple outputs (products).
A terminal or any port can be considered a DMU each year, that is, port A in the year can be considered the
DMU, PODINOVSKI and THANASSOULIS (2007).
According SANTOS e SPROESSER (2013), the DEA method came to prominence around the 1990s and is
used for various jobs in transportation and logistics.
Several authors have used DEA to analyze the efficiency of port terminals. Among them, TONGZON (2001),
VALENTINE e GRAZY (2001), FONTES and SOARES DE MELLO (2006).
For ANGULO MEZA (1998), the modeling in DEA involves the follow steps:
1 - Selection and definition of DMUs: it is important that decision-makers are units of the same use, with the
same input and output data and with the same goals in order that they can be compared properly;
2 - Inputs and Outputs Selection: The inputs and outputs need to be selected in order to describe the problem in
a clear and objective manner, seeking to break even in the number of variables; and
3 - Choose the model, orientation and application: must be done to choose the DEA model according to need to
be measured. After that, you choose the orientation of the input or output model as we will see below:
BERTOLOTO and SOARES de MELLO (2011) claim to be two classic DEA models are as follows:
• Model CCR, also known as CRS ou Constant Return to Scale; and
• Model BBC, also known as VRS ou Variable Return to Scale.
According the same authors, it is still possible to orient the model on two sides (one focused on inputs and one
focused on outputs). The orientation facing the inputs should be given when it is desired to minimize the
available resources, however, without providing a decrease in production quantity. The orientation focused on
outputs must be used when the objective is to increase the products produced without increasing the available
resources.
70
Business and Management Review Vol. 5(03) pp. 68 – 77 August, 2015
Available online at http://www.businessjournalz.org/bmr
ISSN: 2047 - 0398
The data envelopment analysis is being widely used by several authors in order to perform measurements in the
logistics terminals efficiency level, as stated by SANTOS and SPROESSER (2013) and presented in Table 2
5. ESTUDO DE CASO
To conduct the case study and following the guidelines of ANGULO MEZA (1998) will be held the first step of
data envelopment analysis which is the definition of DMUs, as shown below.
The following case study aims to measure the effectiveness of two port facilities that operate with the cabotage
service, transportation of containers in the last three years (2014, 2013 and 2012) in the state of Rio de Janeiro.
Therefore, the following port facilities were chosen: Itaguaí (Sepetiba) and the Instalação do Rio de Janeiro (Rio
de Janeiro Port).
The first port facility to be analyzed is the Porto de Itaguaí (Sepetiba), located in the municipality of Itaguaí –
RJ. The port of Itaguai has the infrastructure sented in Table 3.
In a survey conducted by Sistema de Informações Gerenciais (SIG) by Agência Nacional de Transportes
Aquaviários (ANTAQ), the port of Itaguai moves during the show the amount of TEUs cabotage shown in
Table 4:
The second port facility to be analyzed is the Port of Rio de Janeiro, located on the west coast of the Bay of
Guanabara, in the municipality of Rio de Janeiro - RJ. The Port of Rio de Janeiro has its infrastructure presented
in Table 5.
In a survey conducted by SIG ANTAQ, the port of Rio de Janeiro turnover during the sample period the amount
of TEUs in coastal presented in Table 6.
The second step proposed by ANGULO MEZA (1998) are the choice of variables involved in the process,
inputs and outputs (inputs and outputs), so that the problem can be described objectively.
The model studied in this paper will consider three data as inputs and one output as described in Table 7.
The length of the wharf is the total length of the space intended for berthing vessels. The greater the length of
the pier, larger ships can dock at the port terminal. The length of the pier will use the unit meter (m).
O calado do médio, segundo MACEDO and MANHÃES (2009), refers to the depth of the berths, the distance
between the water surface and the lowest point of the vessel, immersed in the water. Draught enable larger and
larger vessels with mooring of the cargo terminal. The unit to be used for draft measurement in this work will be
the meter (m). This study will use the silent medium that is the sum of the maximum and minimum draft halved.
The number of terminals refers to how many specialized facilities for handling the port exists. The greater the
number of terminals greater the possibility of moving charge.
O terceiro passo proposto por ANGULO MEZA (1998) It is the choice of DEA model and guidance according
to need to be measured. In this article, the DEA model will be used with BBC oriented method to outputs, due to
seek improvement in container handling without changing the installed port capacity. This will happen because
the pursuit of maximizing the number of containers moved without new investments in equipment and seeking
to optimize the use of the installed port capacity.
SOARES de MELLO et al. (2005), present the BBC DEA formulation focused on outputs as we shall see in
equation 1.
Equation 1 - Formulation DEA BCC
71
Business and Management Review Vol. 5(03) pp. 68 – 77 August, 2015
Available online at http://www.businessjournalz.org/bmr
In the model presented above u * v * are the dual variables associated with the condition
are interpreted as scale factors.
ISSN: 2047 - 0398
and They
Equation 2 - Dual PPL BCC oriented output
Where: Eff0 = Efficiency DMU0 (if the port terminal);
uj is the relative importance of output i;
YJK is the value of output i for DMU k;
vi is the relative importance of input;
xjk is the input value for DMU j k.
To make the calculations of the model, we used the DEA software called Sistema Integrado de Apoio à Decisão
V3.0 (SIAD), de ÂNGELO-MEZA et al. (2005). In Table 8 we note that the standard efficiency reached 100%
on two occasions in the Port of Rio de Janeiro in 2014 and in Itaguai Port during 2013.
According SOARES de MELLO et al. (2005), although the DEA models in deem the benefit of allowing
offenses do not require the interference of decision makers, the DEA model turns out to be benevolent with the
evaluated units. With this, it may become efficient by considering only some of the variables that have the
highest rates, causing draws occur in units 100% efficient.
To equate this problem, the inverted frontier was created. The inverted frontier can be defined under SOARES
de MELLO et al. (2005), as a pessimistic assessment of the DMUs. This analysis should be done, according to
the same author, changing inputs by the outputs of the original model. This analysis will show the inefficient
border being composed of the DMUs with the worst management practices. We will see in Figure 3
demonstrating the boundaries of classical efficiency and reverse efficiency of the BCC DEA model.Veremos a
seguir as formulações matemáticas de eficiência final, segundo Leta et al. (2005), eficiência composta e
eficiência composta normatizada, segundo Fontes (2006).
Equation 3 – Final Efficiency
Equation 4 – Standardized Composed Efficiency
Where:
EC = Efficiency Composite;
SE = Standard Efficiency;
EC * = Efficiency Composite standardized;
EI = Inverted efficiency.
With the aid of the composite efficiency, we can analyze that there was a tie between the DMUs 100% standard
efficiency. The Port of Itaguai, in 2013 obtained the highest efficiency score sample studied, obtaining 100%
efficiency made standardized, as shown in Table 9.
5. CONCLUSION
This study was intended to measure the efficiency of two ports operating with containers in cabotage in the
period between the years 2012 to 2014. This calculation was performed with the aid of primary data
72
Business and Management Review Vol. 5(03) pp. 68 – 77 August, 2015
Available online at http://www.businessjournalz.org/bmr
ISSN: 2047 - 0398
envelopment analysis, using the BCC model oriented to outputs. However, more than one terminal showed
100% efficiency, necessitating analysis by another technique.
Thus, it was chosen to reverse the efficient frontier, which presented the Port of Itaguai, in the year 2013 as
100% efficient, with the score higher efficiency.
However, it is important to remember that the DEA method uses input and output data to measure the efficiency
and these data the results are changed may be different from those found in this study, ie the Itaguai port was
more efficient than the Port of Rio, the study period, if the input and output data considered in this study are
considered, changed the inputs and outputs of the process efficiency also changes.
REFERENCES
ACOSTA, M. C. M.; SILVA, A. M. V. A.;LIMA, M. L. P. Aplicação de análise envoltória de dados (DEA)
para medir eficiencia em portos brasileiros. Journal of Transport Literature, v. 5, n. 4, p. 88–102, 2011
ÂNGULO MEZA, L.; BIONDI NETO, L.; SOARES DE MELLO, J.C.C.B.; GOMES, E.G. ISYDS – Integrated
System for Decision Support (SIAD – Sistema Integrado de Apoio a Decisão): a software package for
data envelopement analysis model. Pesquisa Operacional, v. 25, n. 3, 2005, pp. 493 -503.
ÂNGULO MEZA, L. (1998) Data Envelopment Analyis (DEA) na Determinação da Eficiência dos Programas
de Pós-Graduação da COPPE/UFRJ. Rio de Janeiro, 1998. Tese (Mestrado em Engenharia de
Produção) – COPPE, Universidade Federal do Rio de Janeiro
BALLOU, R H. Gerenciamento da cadeia de suprimentos: planejamento, organização e logística empresarial. –
4.ed – Porto Alegre: Bookman, 2001.
BALLOU, R H. Logística empresarial. São Paulo: Atlas, 2008.
BERTOLOTO, R. F., & SOARES DE MELLO, J. C. C. B. (2011). Eficiência de portos e terminais privativos
brasileiros com características distintas. Journal of Transport Literature, 5(2), 4-21.
BOWERSOX, D.J.;CLOSS, D.; COOPER, M. B. Gestão da cadeia de suprimentos e logística. Tradução
Claudia Mello Belhassof. Rio de Janeiro: Elsevier, 2007.
BRASIL. Lei Nº 9.432, de 8 de Janeiro de 1997. Dispõe sobre a ordenação do transporte aquaviário e dá outras
providências. Brasília, 1997.
CNT - Confederação Nacional do Transporte (2014) BOLETIM ESTATÍSTICO - CNT - Janeiro 2014.
Disponível em: < http://www.cnt.org.br/Paginas/Boletins_Detalhes.aspx?b=3> Acesso em 20 de
novembro de 2014.
CULLINANE, K.; WANG, T. The efficiency analysis of container port production using DEA panel data
approaches. OR Spectrum, v. 32, n. 3, p. 717-738, 2010.
DASKIN, M.S. Logistics: an overview of the state of the art and perspectives on future research, Transportation
Research - A, v.19A, n.5/6, p.383-393, 1985.
DA SILVA M.; M. A., & da Paschoa Manhães, J. V. (2009). Avaliação de eficiência de terminais de contêineres
no Brasil através da Análise Envoltória de Dados (DEA). Revista de Negócios, 14(3), 35-53.
DE CARVALHO, R. O., ROBLES, L. T., & ASSUMPÇÃO, M. R. P. (2010). Logística Integrada na prestação
de serviços de cabotagem: de porto-a-porto a porta-a-porta. .– SP. SIMPOI, 2010, São Paulo.
Anais…São Paulo: SIMPOI, 2010
DIAS, C. G.; LABEGALINI, L.; MARTINS, R. S.; GOMES, A. P. Análise da eficiência da logística
aeroportuária no Brasil. Revista de Economia e Administração, v. 9, n. 3, p. 271-293, 2010.
DUBKE, A. F. (1996) Análise da Interiorização do uso do contêiner: Um Estudo de Caso Aplicado ao Corredor
Centro-Leste. Rio de Janeiro, RJ, Dissertação de Mestrado. PUC/RJ.
ERHART, S., & PALMEIRA, E. M. (2006). Análise do setor de transportes. Revista académica de economia:
Observatorio de la Economía Latinoamericana, (71)
FIACO, Reinaldo Moreira Del. (2014). Proposta de um Aplicativo para Comunicar a Operacionalidade da
Navegação Aérea e dos Aeroportos. Monografia de Ciências Aeronáuticas. Pontifícia Universidade de
Goiás. Goiânia, GO.
FLEURY, P.F., WANKE, P., FIGUEIREDO, K.F. (2003). Logística e Gerenciamento da Cadeia de
Suprimentos: planejamento do fluxo de produtos e dos recursos. Coleção COPPEAD de
Administração. Editora Atlas, São Paulo.
FONTES, O. H. P. M.; SOARES DE MELLO, J. C. C. B. Avaliação da eficiência portuária através de uma
modelagem DEA. IX Simpósio de Pesquisa Operacional e Logística da Marinha - SPOLM 2006, Rio
de Janeiro. Anais do SPOLM 2006, 2006
GOEBEL, D. (1996) Logística – otimização do transporte e estoques na empresa. Curso de pós-graduação em
comércio exterior. Universidade Federal do Rio de Janeiro. Rio de Janeiro.
IBGE – Instituto Brasileiro de Geografia e Estatística (2010) Atlas do Censo Demográfico 2010 , 2015.
Disponivel em: < http http://censo2010.ibge.gov.br/apps/atlas/>. Acesso em: 12 Maio 2015.
73
Business and Management Review Vol. 5(03) pp. 68 – 77 August, 2015
Available online at http://www.businessjournalz.org/bmr
ISSN: 2047 - 0398
JÚNIOR, A. S., PIRES, J. S., BARBOSA, R. E., PEREIRA, H. C., & DE SOUSA, M. A. CABOTAGEM
COMO INSTRUMENTO DE PRESERVAÇÃO AMBIENTAL.
LANCHMANN, M. V.; CASTRO JR., Osvaldo A. A navegação de cabotagem na visão dos transportadores: o
valor da cabotagem brasileira. In: 1º Seminário sobre o Desenvolvimento da Navegação de Cabotagem
Brasileira. Brasília, DF: Lanchmann, Agosto/2014. Disponível em: <www.antaq.gov.br>. Acesso em
02/11/2014.
HUNG, S.; LU, W.; WANG, TO. Benchmarking the operating efficiency of Asia container ports. European
Journal of Operational Research, v. 203, n. 3, p. 706-713, 2010.
MONTEIRO, S. Seleção de sistemas de transporte: um modelo de análise para atacadista-distribuidores.
Dissertação (Mestrado em Administração) – Instituto de Pós-Graduação e Pesquisa em Administração.
Rio de Janeiro: UFRJ/COPPEAD, 1997.
MOREIRA, W. S. O Desenvolvimento da Navegação de Cabotagem no Brasil. FIESP. 6º Encontro de Logística
e Transportes. Junho/ 2011. Disponível em: < http://pt.slideshare.net/FIESP/o-desenvolvimento-danavegao-de-cabotagem-no-brasil-wagner-de-sousa-moreira> Acessado em 08 de abril de 2015.
MOURA, D. A., & Botter, R. C. (2011). O transporte por cabotagem no Brasil-potencialidade para a
intermodalidade visando a melhoria do fluxo logístico. Revista Produção Online, 11(2), 595-617.
NOVAES, A. G. Logística e gerenciamento da cadeia de distribuição: estratégia, operações e avaliação. Rio de
Janeiro: Campus, 2001.
OLIVEIRA, Carlos Tavares de. Modernização dos Portos. São Paulo. Aduaneiras, 2011.
ONLINE, In Britannica Escola. As primeiras capitanias hereditárias do Brasil, 2015. Disponivel em:
<http://escola.britannica.com.br/assembly/177618/>. Acesso em: 01 Maio 2015.
PODINOVSKI, V. V., THANASSOULIS, E. Improving discrimination in data envelopment analysis: Some
practical suggestions. Journal of Productivity Analysis, 28 (1-2), pp. 117-126, 2007.
PORTOS RIO. Porto de Itaguaí, 2015. Disponivel em: < http://www.portosrio.gov.br/node/show/106>. Acesso
em: 28 junho 2015.
PORTOS RIO. Porto do Rio, 2015. Disponivel em: http://www.portosrio.gov.br/node/show/102>. Acesso em:
28 junho 2015.
RODRIGUES, L. V ANÁLISE DOS IMPACTOS AMBIENTAIS DA NAVEGAÇÃO DE CABOTAGEM NO
BRASIL: O CASO DO TRANSPORTE DE MINÉRIO DE FERRO PARA A SIDERÚRGICA DO
PECÉM. MESTRADO EM TRANSPORTES. UFRJ, 2003
SANTOS, A. B. Avaliação da eficiência operacional dos Terminais Intermodais da cadeia logística de grãos
brasileira. 2012. 122f. Dissertação (Mestrado) - Curso de Administração, Departamento de Economia e
Administração, Universidade Federal de Mato Grosso do Sul, Campo Grande, 2012.
SANTOS, A. B., SPROESSER, R. L., & MARTINS, R. S. (2013). Caracterização e Avaliação da Eficiência dos
Terminais Intermodais do Corredor Logístico de Grãos Centro-Leste. Revista ADM. MADE, 17(1), 123.
SOARES DE MELLO, J. C. C. B., ÂNGULO MEZA, L., Gomes, E. G., & Biondi Neto, L. (2005). Curso de
análise de envoltória de dados. XXXVII Simpósio Brasileiro de Pesquisa Operacional. Gramado, RS.
STOPFORD, M. Maritime economics. 2. ed. London: Routledge, 2004.
TEIXEIRA, P. E. F. Desempenho de terminais hidroviários do corredor logístico Centro-Oeste: um estudo de
multi-casos, 2010. 132 f. Dissertação (Mestrado em Administração) – Departamento de Economia e
Administração, Universidade Federal de Mato Grosso do Sul, Campo Grande, 2010.
TONGZON, J. Efficiency measurement of selected Australian and other international ports using data
envelopment analysis. Transportation Research, Part A 35, Elsevier, 2001, p. 107–122
VALENTINE, V. C e GRAY, R. The measurement of port efficiency using data envelopment analysis.
Proceedings of the Ninth World Conference on Transport Research, Seoul, 22–27 July, 2001.
VERGARA, S. C. Projetos e Relatórios de Pesquisa em Administração. 5 ed. São Paulo: Atlas, 2004.
WANKE, P. F.; AFFONSO, C. R. Determinantes da eficiência de escala no setor brasileiro de operadores
logísticos. Produção, v. 21, n. 1, p. 53-63, 2011.
ANNEX
Table 1 - modal distribution of the Brazilian matrix of cargo transportation
Source: CNT (2014)
74
Business and Management Review Vol. 5(03) pp. 68 – 77 August, 2015
Available online at http://www.businessjournalz.org/bmr
ISSN: 2047 - 0398
Table 2 - DEA Use in studies related to transport and logistics
Source: Santos e Sproesser (2013) adapted, * not specified in the reference
Table 1 - Infraestrutura do Porto de Itaguaí
Source: Internet: http://www.portosrio.gov.br/node/show/106:
Table 2 - Movimentação de TEUs na cabotagem no Porto dde Itaguaí
Source: Internet: SIG ANTAQ
Table 3 - Infraestrutura do Porto do Rio
Source: Internet: http://www.portosrio.gov.br/node/show/102.
Table 4 - Movimentação de TEUs na cabotagem no Porto do Rio
Source: Internet: SIG ANTAQ
75
Business and Management Review Vol. 5(03) pp. 68 – 77 August, 2015
Available online at http://www.businessjournalz.org/bmr
ISSN: 2047 - 0398
Table 5 - Inputs e Output usados na pesquisa
Table 6 - Eficiência Padrão
Table 7 - Eficiências padrão, invertida, composta e composta normatizada
Figure 1 - As primeiras Capitanias Hereditárias do Brasil.
Source: Internet: http://escola.britannica.com.br/assembly/177618/null#asmbly-citation
76
Business and Management Review Vol. 5(03) pp. 68 – 77 August, 2015
Available online at http://www.businessjournalz.org/bmr
ISSN: 2047 - 0398
Figura 2 - Distribuição da População Urbana Brasileira.
Source: Internet: http://censo2010.ibge.gov.br/apps/atlas/
Figure 3 - Fronteiras DEA BCC clássica e invertida
Source: Soares de Mello et al. (2005)
77
Baixar