The Importance of Numbers:
What Large Skeletal Samples Can (and Cannot) Reveal About
the Health Status of Earlier Human Population
Phillip L. Walker
Department of Anthropology
University of California, Santa Barbara
The history of paleopathology: from
small to large numbers
•Stage I: Case Studies
–Dominated almost the end of the
20th century
–“Physician to the dead” approach
–century took a descriptive, case
study
–Emphasis on determining the spatial
temporal distribution of diseases.
•Stage II: Population Studies
–Mainly during the last 50 years.
–Emphasis on calculating the
prevalence of common pathological
conditions in cemetery collections
– Bioarchaeological approach with an
emphasis on cultural and ecological
determinants of health status
Goals of Modern Paleopathology
• Describe the chronology and spatial distribution of
health-related conditions in an earlier populations
• Determine the biocultural interactions that occur
as a population responds to its environment, using
disease as an index of the success or failure of
adaptation
• Use the prevalence and pattern of disease to shed
light on the adaptation of the population
• Investigate the processes involved in prehistoric
the evolution of ancient diseases
What are the limitations of a
population-based approach in paleopahtology?
• How large are the samples that we will need to
detect population differences we might reasonably
expect to see in the frequency of pathological
conditions?
• How significant are sample biases introduced by
age, sex, and preservation differences between
samples?
• What problems are there with pooling samples
from different sites to increase sample sizes?
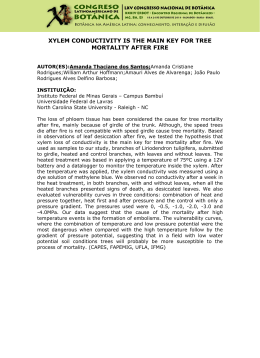
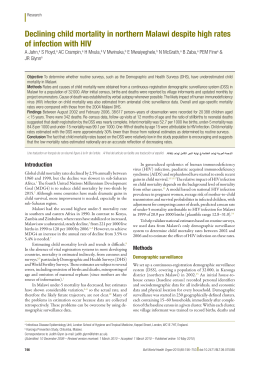
Western Hemisphere and History of Health in Europe
Project Sites
893 sites, total n= 142,952
E urope
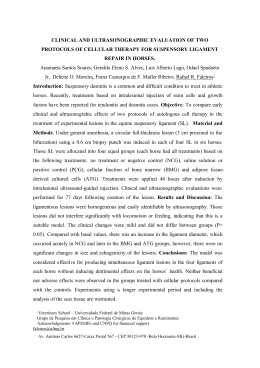
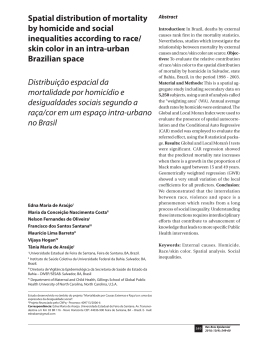
Most archaeological skeletal collections are small!
10
5
0
Percent of Sites
15
Size Distribution of Cemetery Collections: N=893
0
100
200
300
Number of Burials
400
500
Most archaeological skeletal collections are small!
30
20
10
0
Percent of Sites
40
Size Distribution of Cemetery Collections: N=893
0
500
1000
Number of Burials
1500
2000
Cemetery collections from archaeological sites:
median =59, mode= 1
30
20
10
0
Percent of Sites
40
Size Distribution of Cemetery Collections: N=893
0
50
100
150
200
250
300
Number of Burials
350
400
450
500
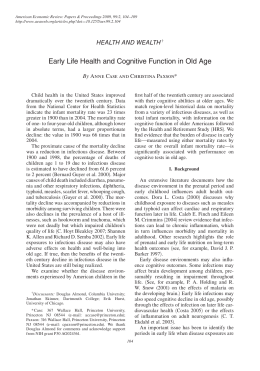
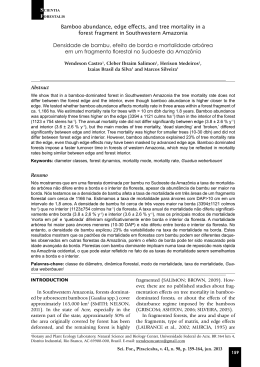
Number of skeletons required to detect a statistically significant difference in the
proportion of people afflicted with a pathological condition
40
35
M e d ia n size
o f b io a rc h a e o lo g ic a l c o lle c tio n s
% Difference
30
25
20
15
10
5
0
0
50
100 150 200 250 300 350 400 450 500 550 600 650 700
Sample Sizes Required
Cutting up the Pie Makes Things Worse!
Testing bioarchaeological
hypotheses typically requires
subdividing site samples
Age
Sex
Social Status
Sex is a big part of the pie!
• % 39.8 of burials in
the Western
Hemisphere sample
are younger than 15
years old and thus
probably not subject to
reliable sex
determination.
<15 years old
technically
unsexable
40%
>15
technically
sexable
60%
The real world situation is worse..
• Only 41% of the Western
Hemisphere sample could be
sexed to the level of “probable
male” or “probable” female.
• This means that about 24
burials in a sample with the
median size of 59 can be
reliably sexed.
• Assuming a balanced sex
ratio, this would mean that
within-site sex comparisons
would typically involve 12
males and 12 femailes
Sexed
41%
Unsexed
59%
Age
Subadults: 59 x 0.38= 22
Adults: 59 x 0.62= 37
S uba dults
38 %
A du lts
62 %
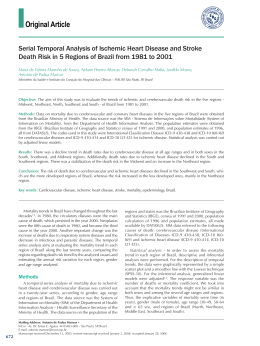
The effects of preservation biases can be significant!
How should frequencies of pathological lesions be measured?
% Bones With Periostitis
Malibu
50
40
30
20
10
Weighted % With Periostitis
0
Femur
Tibia
Fibula
Humerus
Femur
Tibia
Fibula
Humerus
Ulna
Radius
50
40
30
20
10
0
Historic
Prehistoric
Ulna
Radius
The under-representation of pathological conditions in
skeletal samples
•
•
Many diseases such as tuberculosis only
leave lesions on a small proportion of
individuals
Many lethal injuries leave no skeletal traces
Poor preservation of ancient skeletal
material means that often subtle signs of
disease and traumatic injury will either be
unobservable or uninterpretable
Bone Damage In Indian War Arrow Wounds: 30%
100
80
% of Injuries
•
60
40
20
0
Head &
Neck
Thorax
Abdomen
Upper Limb Lower Limb
What can large samples tell us?
A Caveat: variation among contemporaneous
populations within a region can be significant
Sex Difference in Malibu Isotopes
-15.5
16
18
15
10
12
14
δ N (Air)
15
14
13
12
δ15N (Air)
16
20
17
Early Period on Santa Cruz Island (SCRI-3)
-15
-14.5
13
-14
δ C (PDB)
Males
-13.5
Females
-13
-12.5
-17.5
-16.5
-15.5
-14.5
13
δ C (PDB)
Males
Females
-13.5
-12.5
Variations in the bathtub curve
• Wide differentials
in the excess
mortality occurring
at the youngest and
oldest ages
• Marked
differences in the
timing of the
decline in juvenile
mortality or the
rise in adult
mortality
Could we detect minor variations in the bathtub curve?
1,000,000
MALE
FEMALE
100,000
10,000
ye
ar
-5915
-1
925
-2
935
-3
945
-4
955
-5
965
-6
975
-7
985
-8
995
-9
9-
1,000
<1
• The adolescent
“accident hump”
• Apparent slowing
down of the rate of
increase of
mortality among
the oldest of the
old
Number of Deaths (log scale)
United States Death Rates (1999)
Age in Year
What are our chances of detecting the “Basic” human
mortality pattern?
• The “bathtub curve”
this is a species-wide
theme in human
mortality
• Basic features
– Excess mortality at the
youngest ages of the life
span
– Rapid decline to a lifetime
low at around 10-15 years
of age
– Accelerating, roughly
exponential, rise in
mortality at later ages
Conclusions
• Small sample sizes and preservation biases mean that
paleodemographers will ever be able to reconstruct the fine
details of any set of mortality rates.
• At best, we can hope to learn something about the overall
level and age pattern of death in the distant past - and
perhaps something about the gross differences in material
conditions that led to variation in level and age pattern.
• Paleodemographers will probably never be able to
reconstruct the "bumps and squiggles" in ancient mortality
patters.
• Reconstructing the general shape and level of the bathtub
curve will be challenging enough.
Statistical Power
• The probability of rejecting a false statistical null
hypothesis.
• Performing power analysis and sample size
estimation is an important aspect of experimental
design, because without these calculations, sample
size may be too high or too low.
• If sample size is too low, the experiment will lack
the precision to provide reliable answers to the
questions it is investigating.
• If sample size is too large, time and resources will
be wasted, often for minimal gain.
Determining Sample Size
•
•
•
•
•
•
•
What kind of statistical test is being performed. Some statistical tests are
inherently more powerful than others.
Sample size. In general, the larger the sample size, the larger the power.
However, generally increasing sample size involves tangible costs, both in
time, money, and effort.
Consequently, it is important to make sample size "large enough," but not
wastefully large.
In paleopathological studies increasing sample size is typically impossible
The size of experimental effects. If the null hypothesis is wrong by a
substantial amount, power will be higher than if it is wrong by a small amount.
The level of error in experimental measurements. Measurement error acts like
"noise" that can bury the "signal" of real experimental effects. Consequently,
anything that enhances the accuracy and consistency of measurement can
increase
Regional Variation
Bioarchaeologically Interesting
Differences
• Time: how does health status vary through time
• Space: What regional or intraregional differences
are there
• Age: What is the relationship between age at death
and the presence of pathological lesions indicative
of specific diseases
• Sex: how does a person’s sex influence their
health status
• Social Status: How do social stratification and
gender roles influence health status.
• alpha specifies the significance level of the
test; the default is alpha (.05).
• power(#) is power of the test. Default is
power(.90).
Age determination is a blunt
sword…
A priori sample size estimation
• Based on the acceptable statistical
significance of your outcome measure.
• Specify the smallest effect you want to
detect of the Type I and Type II error
rates
Error Types
• Type 1 error: The chance of accepting the
research hypothesis when the null hypothesis
is actually true ("false positive").
• Type 2 error: The chance of accepting the
null hypothesis when the research hypothesis
is actually true ("false negative").
Age Related Changes in Bones Mass
% with Tibial Osteoperiostitis
Osteoperiostitis
25
Inland
Coastal
20
15
10
5
0
Slight
Moderate
Severe
% Burials with Tibial Osteoperiostitis
Osteoperiostitis
40
30
20
10
0
Early
Late
Early Period
Early
Late
Middle Period
Late
Period
Long Bones Affected
SBA-52
Number of Burials
6
4
2
0
1
2
3
4
5
6
Long Bones with Periosteal Lesions
>6
Temporal Variation
Malibu
Number of Burials
15
10
5
0
1
2
3
4
5
Long Bones with Periosteal Lesions
Historic
Prehistoric
6
Baixar