Nursing / Enfermagem
Quality of life of patients with hypertension
Qualidade de vida dos portadores de hipertensão arterial
Silvania Maria de Oliveira Castro1, Raquel Machado Cavalca Coutinho1
1
School of Nursing, University Paulista, Campinas-SP, Brazil.
Abstract
Objective – To assess the quality of life and risk factors to patients with hypertension who participate in the group “Group ComViva Health”.
Methods – This is a field study of a quantitative exploratory, descriptive and not experimental. Results – Most employees with chronic diseases such as rating their quality of life satisfactory in many respects, but there is still a significant proportion of subjects who indicated dissatisfaction with their full quality of life. Driven often by family and friends through the knowledge acquired in the common sense, many of
them have doubts about the pathology and even taboos related to treatment, thus hindering the adherence to it. Although the developers
claim to know the disease and assume that it does not interfere with their quality of life there is still a very large deficit of knowledge about
the disease and ways to prevent complications during the course of chronic disease. Conclusion – No need to include directly the change
of habits was one of the most worrisome data collected for this study because even assuming employees know about its importance, yet do
not thus increasing the complications related to hypertension.
Descriptors: Quality of life; Hypertension; Health education
Resumo
Objetivo – Avaliar a qualidade de vida bem como os fatores de riscos aos portadores de hipertensão arterial sistêmica que participam do
grupo “ComViva Saúde”. Métodos – Trata-se de uma pesquisa de campo do tipo quantitativa exploratória, não experimental e descritiva.
Resultados – A maioria dos colaboradores portadores de doenças crônicas avalia sua qualidade de vida como satisfatória em muitos aspectos,
porém ainda há uma parcela significativa de sujeitos que indicaram pleno descontentamento com sua qualidade de vida. Orientados muitas vezes por familiares e amigos através do conhecimento adquirido no senso comum, muitos deles possuem dúvidas a respeito da patologia e até tabus relacionados ao tratamento, dificultando assim a adesão ao mesmo. Apesar de os colaboradores afirmarem conhecer a
doença e assumirem que a mesma não interfere em sua qualidade de vida ainda há um déficit muito grande de conhecimento sobre a patologia, bem como formas de prevenir complicações durante o curso da doença crônica. Conclusão – Há necessidade de incluírem diretamente a mudança de hábitos que foi um dos dados mais preocupantes levantados por esta pesquisa, pois mesmo os colaboradores assumindo
saber sobre sua importância, ainda não o fazem aumentando assim as complicações relacionadas à hipertensão arterial sistêmica.
Descritores: Qualidade de vida; Hipertensão; Educação em saúde
Introduction
systolic and 80mmHg diastolic. The Ministry of Health
(MOH) considers the optimal value, where there is less risk
to the cardiovascular system6.
The identification of hypertensive disease in the population is no easy task, since it requires measurement of
blood pressure and information regarding the recent use
of antihypertensive medication7-8.
The strategies for the implementation of preventive
measures of hypertension depend on the performance of
interdisciplinary teams, adoption of public policies, community activities, organization and planning of health
services9-10.
Quality of life relating to health is defined as the measurement of perceived functional status, impact, limitations, conditions and treatment perspective that patients
with chronic diseases and heart disease have a cultural
context and value system11.
Theories seeking to explain and guide approaches to
obtain the commitment of patients with chronic diseases
began to be systematically investigated12-13.
In health, interest in the concept of quality of life is relatively recent and stems, in part, the new paradigms that
have influenced policies and practices in the industry for
decades14-15. Thus health and disease processes configure
understood as a continuum, related to economic, sociocultural, experience and personal lifestyles16.
Blood pressure is a physiological parameter that varies widely among populations, among different individuals and in
the same individual in different situations. Physiologically,
blood pressure is determined by the ratio between cardiac
output and peripheral resistance. These two variables are related to dozens of other variables, neuroendocrine, metabolic, genetic, nutritional, cardiac and renal, neuropsychiatric, and these are related to numerous other anthropometric,
social, racial, nutritional habits and lifestyles1.
In Brazil there are about 17 million hypertensive patients,
35% of the population 40 years and more1. This number is
growing, its appearance is increasingly short and it is estimated that about 4% of children and adolescents are also
suffering2. The disease burden represented by the mortality
due to disease is very high and all that hypertension is a serious public health problem in Brazil and worldwide3.
The main causes of primary hypertension are a heritage,
ethnic group, age, and social class, ingestion of electrolytes in the diet, obesity, alcohol abuse, smoking and
oral contraceptive use4.
The classification used later, is recommended by the Brazilian Society of Cardiology (Sociedade Brasileira de Cardiologia) based on parameters Americans5. In this current
rating, the optimal pressure is lower than that 120mmHg
J Health Sci Inst. 2012;30(2):134-9
134
So some questions arise as:
How committed to that cause hypertension in patients'quality of life? What factors contribute to lack of adherence to treatment of hypertension? What are the epidemiological characteristics of patients with hypertension?
Hypotheses of this research, we have:
The involvement of hypertension is directly related to
people with lower socioeconomic status.
The lack of knowledge about the deleterious effects of
hypertension is not related to treatment adherence.
Is there a relationship between age, obesity and physical inactivity with the onset of hypertension.
The general purpose was to assessing quality of life related to health and risk factors to patients with hypertension participating in the group “Group ComViva Health”
and the specific objectives was to determine the involvement of the disease on quality of life of patients with hypertension; to sort the main factors contributing to nonadherence to treatment and prevention of hypertension
and to specify which epidemiologic characteristics of patients with hypertension.
have submitted the basic characteristics of the evaluation
and analysis of quality of life.
With data collection have achieved the following results:
Table 1. Distribution of total collaborators as their socio-demographic characteristics. Campinas-SP, 2011
Nº (%)
Sex
Female
11 (78,6%)
Male
03 (21,4%
White
Black
Brown
Elementary
Middle School
Higher education
Postgraduate
40 - 60 kg
60 - 80 kg
08 (57,1%)
03 (21,4%)
03 (21,4%)
01 (7,2%)
09 (64,3%)
03 (21,4%)
01 (7,2%)
05 (35,7%)
06 (42,9%)
80 - 100 kg
03 (21,4%)
Total
Skin color
Schooling
Body weight
14 (100%)
In Table 1 we see data of 14 employees interviewed
being predominantly literate with 78.6%, while males represented only 21.4% of the sample. The largest number
of women met in hypertension is observed perhaps because of the characteristics of the woman as caregiver and
more attentive to aspects of their health.
See also features on the skin color 57.1% of the employees found the white while the other 42.8% divided
between blacks and mulattoes. The average age of developers hypertensive was 47.3 years.
The schooling was also questioned and the majority of
respondents (64.3%) reported to the school, only 7.2% of
contributors said have studied elementary (4th grade),
while 21.4% received higher education and 7.2% completed post-graduate course.
We also note that in relation to body weight most collaborators (42.9%) referred not to be in your ideal weight
weighing between 60 and 80 kg and 21.4% of them
weighed between 80 and 100 kg they admitted not having
concern in controlling weight18.
Using the graphical representation can show this group
more easily.
Methods
This is a character field research quantitative, descriptive and exploratory, where they were reviewed literature
over the last 10 years.
This survey was conducted in a Higher Education Institution (HEI) in the municipality of Campinas. Participants are
part of the group “Group ComViva Health”, Clinical Health,
data were collected from November to December 2010.
The study participants consisted of 24 employees of a
randomly chosen HEI involved in the group “Group ComViva Health” to prevent and control hypertension.
We conducted a survey of the number of employees involved with SAH group “Group ComViva Health”, totaling
14 employees. The sample used for this study were all employees who agreed to participate voluntarily in the study.
The trial included all employees who: are patients with
hypertension, participated in the group “Group ComViva
Health” within the institution, who agreed to participate
in the study made official by signing the Informed Consent
(IC) and who were present at the time of data collection.
We excluded all employees who were not present on
the day of the interview or refused to participate.
We used an instrument adapted from Schulz et al.17
(2008) translating the questionnaire Minichal for data
collection.
Data were collected between October-November 2010,
where there were 14 samples and 6 refusals, and disengaged the four institutions, two were transferred from
campus, two are away on medical leave and two did not
join the project totaling 70% of representative sample.
Data were compiled and tabulated in Excel spreadsheet
according to the sequence of questions. Subsequently
underwent simple percentage calculation for the quantification of variables.
Results and Discussion
In research conducted in a Higher Education Institution
(HEI) was obtained a sample of fourteen contributors who
J Health Sci Inst. 2012;30(2):134-9
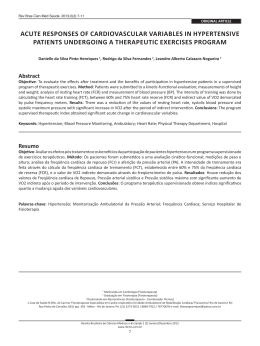
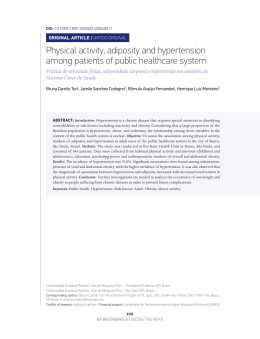
Graph 1. Distribution of body weight of employees (%). Campinas-SP,
2011
135
Quallity of life of patients with hypertension
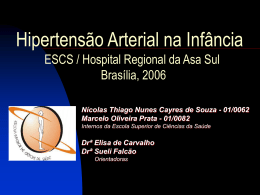
life, the majority (64.3%) responded that the disease does
not interfere in anything their quality of life has 35.7% assumed the disease interferes too not only in quality of life,
but also in their daily activities, but many pointed out that
"the disease, when controlled does not interfere in anything, the bearer can follow his life normally."
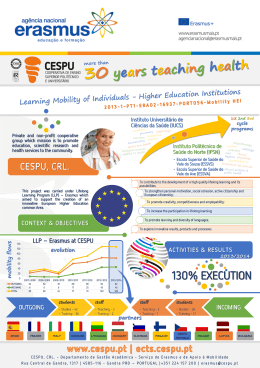
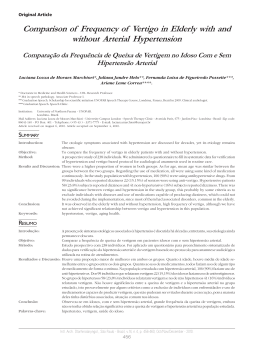
Graph 2. Control body weight by collaborators of IES (%). CampinasSP, 2011
In Graph 1 we can see more clearly the current situation of employees who were part of the search, noting that
64.3% of them reported having their weight between 60
and 100 kg and 64.3% of them are not doing any control
of weight as shown in Graph 2. Despite data developers
showed know all risks of overweight and disarray or even
the absence of a healthy diet for the hypertensive.
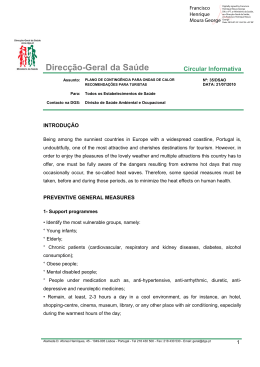
Graph 5. Representation of the response of employees interviewed
about the practice of healthy habits. Campinas-SP, 2011
In Graph 5 we can observe that the practice of healthy
habits is not among the main concerns of respondents, with
85.7% of respondents said they participate in programs of
quality of life, while only 14.3% said not participating or
ever having participated in such programs. Already we see
the nutritional accompaniment worrying data with 92.9%
of participants assuming make no nutritional accompaniment and only 7.1% say care giving diet with the guidance
of a qualified professional. As to the practice of physical
exercise 78.6% reported not practicing any type of activity,
assuming sedentariness and only 21.4% reported practicing
physical exercises occasionally.
In relation to the habit of smoking have obtained positive data, because 85.7% of the survey participants said
they have never smoked, while 14.3% (2 respondents)
have already made use of cigarette, participants mentioned 01 smoker for over 6 years. How to perform the
treatment or control hypertension got 92.9% of contributors said control and treat somehow HAS, while 7.1% assumed not to make any control of pathology.
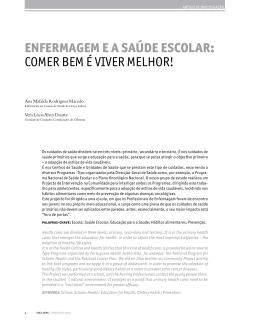
Graph 6 shows that half of respondents have a symptom
related to the use of antihypertensive drugs such as xerostomia or dry mouth. Many of them reported that this is
the worst part of the treatment, when drug therapy is initiated, as have many adverse effects related to the use of
these drugs, xerostomia occurring nausea, malaise,
among other symptoms. This implies to the population
studied in a decreased quality of life.
Based on this principle and to validate the hypotheses
of the study, was applied also in the population studied
the quality of life scale adapted model Flanagan (EQVF),
and she obtained the following results:
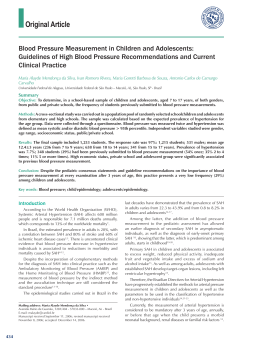
Graph 3. A family history of collaborators with HAS. Campinas-SP,
2011
Graph 3 shows that when asked about people in your
family who HAS 93% of respondents reported having a family history of hypertension and only 7% did not inform.
Through this raised the following questions:
Graph 4. The HAS somehow affects the quality of life of people. Campinas-SP, 2011
In Graph 4 we see the opinion of the employees surveyed about the interference of the disease on quality of
Castro SMO, Coutinho RMC
136
J Health Sci Inst. 2012;30(2):134-9
tion, while other 28.5% responded be unsatisfied or
indifferent.
Table 4 shows as for social activities, community and civic received the following responses: 57.1% were satisfied
with his performance to help the next voluntarily, while
14.2% reported being dissatisfied, 14.2% took his dissatisfaction with this item and 14.2% were indifferent. In the sense
of participation in associations or public interest activities only
35.7% of respondents reported being satisfied, while 42.6%
divided between somewhat satisfied, somewhat dissatisfied
and unhappy and 21.7% were indifferent to this item.
Date analysis of Table 5 as personal development and
achievements the majority of participants (57.1) said to be
satisfied with their learning, 28.4% of them were divided
between somewhat dissatisfied, and very unhappy. Already regarding self-knowledge 64.3% were satisfied,
and only 7.1% reported being dissatisfied with this item.
Satisfaction with the work was also questioned and 57.1%
reported being satisfied with the activity that performs. As
for creative communication 71.4% reported being satisfied, while 21.4% reported being dissatisfied and only
7.1% were indifferent to this item.
Table 6 shows as recreation had a very satisfactory assessment, socialization or ability to make friends represented 92.9% satisfaction. With respect to recreation passive 57.1% assumed to be very satisfied and 42.9%
described this activity as satisfactory taking hold at least
one leisure activity per week. Regarding participation in
active recreation 64.3% reported being satisfied, 14.2%
Graph 6. Symptom related “dry mouth” to the use of antihypertensive
drugs. Campinas-SP, 2011
Table 2 shows the degree of satisfaction of the population interviewed following the aspects of quality of life
scale of Flanagan, were assessed 15 points. The first one
was with respect to the material comfort of respondents
considering housing, food and financial situation, 14.2%
of the employees were divided between very unhappy
and dissatisfied, while 28.6% reported being dissatisfied
with their current situation, the majority of respondents
(57.1%) were divided between satisfied and very satisfied
with aspects related to material comforts.
In relation to health, the answers were found: 78.9%
said they were satisfied with health that possessed while
21.3% responded they were dissatisfied.
Date analysis of Table 3 then arose the question of
personal relationships where they were questioned
about their satisfaction about family, friends and partner. On family relationships (parents and siblings) accounted for 92.9% satisfaction according to respondents. When asked about constitute family (create
children) most 80.4% were satisfied or very satisfied,
while 7.1% were dissatisfied with this aspect, 14.2%
said it indifferent and 7.1% reported being somewhat
dissatisfied. Whereas the intimate relationships 85.7%
of employees reported being very satisfied and 14.2%
divided between indifferent and unhappy. Shortly thereafter the friendships accounted for 64.2% satisfac-
Table 3. Total distribution of degree of satisfaction of employees as to relation with other people. Campinas-SP,
2011
Relationship with
other people
Very dissatisfied
Dissatisfied
Somewhat dissatisfied
Indifferent
Little satisfied
Satisfied
Very satisfied
Very satisfied
Dissatisfied
Somewhat dissatisfied
Found a family
Indifferent
(have and creat children)
Little satisfied
Satisfied
Very satisfied
Very dissatisfied
Dissatisfied
Intimate relationship
Somewhat dissatisfied
(spouse, boyfriend or
Indifferent
another relevant person) Little satisfied
Satisfied
Very satisfied
Very dissatisfied
Dissatisfied
Close friends
Somewhat dissatisfied
(share interests,
Indifferent
activities and opinions)
Little satisfied
Satisfied
Relationship with
parents, siblings
and relatives
(communications,
and help)
Table 2. Total distribution of employee responses when questioned about his satisfaction with regard to their physical and mental well being. Campinas-SP, 2011
Physical and material
well being
Material comfort
(home, food, financial)
Health
(physically well
and vigorous)
J Health Sci Inst. 2012;30(2):134-9
Degree of
satisfaction
Nº
(%)
Very dissatisfied
Dissatisfied
Somewhat dissatisfied
Indifferent
Little satisfied
Satisfied
Very satisfied
Very dissatisfied
Dissatisfied
Somewhat dissatisfied
Indifferent
Little satisfied
Satisfied
Very satisfied
1
1
0
0
4
6
2
0
2
1
0
2
9
0
7,1%
7,1%
0,0%
0,0%
28,6%
42,9%
14,2%
0,0%
14,2%
7,1%
0,0%
14,2%
64,3%
0,0%
Degree of
satisfaction
137
Nº
(%)
0
0
1
0
0
7
6
0
0
1
2
1
5
5
0
1
0
1
0
5
7
0
1
0
3
1
7
0,0%
0,0%
7,1%
0,0%
0,0%
50,0%
42,9%
0,0%
0,0%
7,1%
14,2%
7,1%
35,7%
35,7%
0,0%
7,1%
0,0%
7,1%
0,0%
35,7%
50,0%
0,0%
7,1%
0,0%
21,4%
7,1%
50,0%
Quallity of life of patients with hypertension
Table 4. Distribution of employee satisfaction degree about
social activities, community and civic held by them.
Campinas-SP, 2011
Social activities,
community and civic
Degree of
satisfaction
Nº
(%)
Voluntarily,
help and support
others
Very dissatisfied
Dissatisfied
Somewhat dissatisfied
Indifferent
Little satisfied
Satisfied
Very satisfied
0
2
1
1
2
7
1
0,0%
14,2%
7,1%
7,1%
14,2%
50,0%
7,1%
Participation in association
and activities of public
interest
Very dissatisfied
Dissatisfied
Somewhat disatisfied
Indifferent
Little satisfied
Satisfied
Very satisfied
0
2
2
3
2
4
1
0,0%
14,2%
14,2%
21,4%
14,2%
28,6%
7,1%
Table 6. Representation of responses from employees about their
satisfaction with respect to recreation. Campinas-SP, 2011
Table 5. Satisfaction of the respondents with respect to their
personal development and their accomplishments.
Campinas-SP, 2011
Personal development
and achievements
Degree of
satisfaction
Nº
(%)
Learning
(frequent other general
knowledge courses)
Very dissatisfied
Dissatisfied
Somewhat dissatisfied
Indifferent
Little satisfied
Satisfied
Very satisfied
2
1
2
1
0
7
1
14,2%
7,1%
14,2%
7,1%
0,0%
50,0%
7,1%
Self-knowledge
(recognize your
potential and limitations)
Very dissatisfied
Dissatisfied
Somewhat dissatisfied
Indifferent
Little satisfied
Satisfied
Very satisfied
0
1
2
0
2
9
0
0,0%
7,1%
14,2%
0,0%
14,2%
64,3%
0,0%
Work
(interesting, rewarding
Very dissatisfied
Dissatisfied
Somewhat dissatisfied
Indifferent
Little satisfied
Satisfied
Very satisfied
1
0
1
1
3
6
2
7,1%
0,0%
7,1%
7,1%
21,4%
42,9%
14,2%
Creative communication
Very dissatisfied
Dissatisfied
Somewhat dissatisfied
Indifferent
Little satisfied
Satisfied
Very satisfied
0
0
0
1
3
7
3
0,0%
0,0%
0,0%
7,1%
21,4%
50,0%
21,4%
Degree of
satisfaction
Nº
(%)
Participation in active
recreation
Very dissatisfied
Dissatisfied
Somewhat dissatisfied
Indifferent
Little satisfied
Satisfied
Very satisfied
0
0
0
3
2
6
3
0,0%
0,0%
0,0%
21,4%
14,2%
42,9%
21,4%
Listen to music, watch TV
or movies, reading,
or other entertainment
Very dissatisfied
Dissatisfied
Somewhat dissatisfied
Indifferent
Little satisfied
Satisfied
Very satisfied
0
0
0
0
0
6
8
0,0%
0,0%
0,0%
0,0%
0,0%
42,9%
57,1%
Socialization
(“make friends”)
Very dissatisfied
Dissatisfied
Somewhat dissatisfied
Indifferent
Little satisfied
Satisfied
Very satisfied
0
0
0
1
0
7
6
0,0%
0,0%
0,0%
7,1%
0,0%
50,0%
42,9%
Conclusion
With this study can conclude that the majority of employees with chronic diseases have evaluated their quality of life as satisfactory in many respects, but there is still
a significant portion of subjects who indicated full disagreement with their quality of life. This requires intervention of health professionals to evaluate each case separately and create an action plan that includes the
withdrawal of guidance, and even psychological questions for these patients.
Although the developers saying about the disease and
assume that it does not interfere in their quality of life is
still a deficit too large of knowledge about the pathology,
as well as ways to prevent complications during the
course of chronic disease, including directly to changing
habits who was one of the most concern raised by this research, because even the developers assuming to know
about its importance, yet do not thereby HAS related
complications.
When we compared the difference in gender QVRS
were verified that existed both in the analysis carried out
by Minichal as in analyzing Flanagan. As in other studies,
factors such as gender, obesity, lower age and lower educational level seem to be related to a worst-case assessment of QV. It was also noted in the original study of Minichal, in which women had a worse score in relation to
the mental state, other authors also claim that women are
more often feelings of dissatisfaction and frustration, what
influences in the QVRS, mainly in the field of psychological and in addition, men have, in general, better ability
to tolerate diseases without being affected emotionally.
Several factors covered in the survey achieved a very
high satisfaction and acceptance. Much of this result can
be thanks to the work of university to create a group of
educational practices aimed at the collective health of its
assumed to be dissatisfied and 21.4% were indifferent.
Even with these positive data must understand that the patient is hypertensive goes through periods of adaptation to
disease. Recreational and sports activities help the patient
to change their focus on disease and assist in the treatment
of the same, so the leisure and recreation are so important
in quality of life of employees.
Castro SMO, Coutinho RMC
Recreation
138
J Health Sci Inst. 2012;30(2):134-9
9. Oliveira SMJV, Santos JFL, Lebrão ML, Duarte YAO, Pierin AMG.
Hipertensão arterial referida em mulheres idosas: prevalência e fatores associados. Texto & Contexto Enferm. 2008;(2):241-9.
collaborators, since most of the respondents said that before to participate in the collective health actions ("Group
ComViva Health") exist in HEIS had never participated in
groups so mostly for lack of time or another reason, said
to be very satisfied with aspects related to work.
10. Ministério da Saúde (BR). Secretaria de Atenção à Saúde. Departamento de Atenção Básica. Hipertensão arterial sistêmica. Brasília (DF); 2006 (Cadernos de Atenção Básica, 15).
11. Didier MT, Guimarães AC. Otimização de recursos no cuidado
primário da hipertensão arterial. Arq Bras Cardiol. 2007;88(2):
218-24.
References
1. Beers MH, Berknow R. Manual Merck: diagnóstico e tratamento.
17.ed. São Paulo: Roca; 2001.
12. Diretrizes Brasileiras de Hipertensão Arterial Sistêmica, V. Sociedade Brasileira de Hipertensão. Sociedade Brasileira de Cardiologia. Sociedade Brasileira de Nefrologia. São Paulo 13 fev 2006
[acesso 7 jan 2011] Disponível em: http://bvsms.saude.gov.br/bvs/
publicacoes/v_diretrizes_brasileira_hipertensao_arterial_2006.pdf
2. Lessa I. Epidemiologia da hipertensão arterial sistêmica e da insuficiência cardíaca no Brasil. Rev Bras Hipertens. 2001;8(4):383-92.
3. Freitas OC, Carvalho FR, Neves JM, Veludo PR, Parreira RS, Gonçalves RM et al. Prevalência de hipertensão na população urbana
de Catanduva, SP, Brasil. Arq Bras Cardiol. 2001;77(1):9-15.
13. Diretrizes Brasileiras de Hipertensão Arterial, IV. Sociedade Brasileira de Hipertensão. Sociedade Brasileira de Cardiologia. Sociedade Brasileira de Nefrologia. Campos do Jordão: BG Cultura; 2002.
4. Braunwald E, Kasper DL, Fauci AS, Longo DL, Hamser SL, Jameson JL. Medicina interna. 16.ed. São Paulo: McGraw-Hill/Tecmedd; 2005.
14. Lucena AF, Barros ALBL. Mapeamento cruzado: uma alternativa
para a análise de dados em enfermagem. Acta Paul Enferm.
2005;18(1):82-8.
5. Campos RJ, Colombari E, Cravo S, Lopes OU. Hipertensão arterial: o que tem a dizer o sistema nervoso. Rev Bras Hipertens. 2001
[acesso 22 set 2010];8(1):41-54. Disponível em: http://departamentos.cardiol.br/dha/publicacoes/8-1/006.pdf
15. Sousa ALL, Educando a pessoa hipertensa. In: Nobre F, Pierin
AMG, Mion Jr D. Adesão ao tratamento: o grande desafio da hipertensão. São Paulo: Lemos; 2001.
6. Ministério da Saúde (BR). Secretaria de Políticas de Saúde. Departamento de Ações Programáticas Estratégicas. Plano de reorganização da atenção à hipertensão arterial. Brasília (DF); 2001.
16. Sanchez CG, Pierin AMG, Mion Jr D. Comparação dos perfis
dos pacientes hipertensos atendidos em Pronto-Socorro e em tratamento ambulatorial. Rev Esc Enferm USP. 2004;38(1):90-8.
7. Carvalhaes MABL, Moura EC, Monteiro CA. Prevalência de fatores de risco para doenças crônicas: inquérito populacional mediante entrevistas telefônicas em Botucatu, São Paulo. Rev Bras
Epidemiol. 2008;11(1):14-23.
17. Schulz RB, Rossignoli P, Correr CJ, Fernández-Llimós, Toni PM.
Validation of the short form of the Spanish hypertension quality of
life questionnaire (Minichal) for Portuguese (Brazil). Arq Bras Cardiol. 2008;90(2):127-31.
8. Passos VMA, Assis TD, Barreto SM. Hipertensão arterial no Brasil: estimativa de prevalência a partir de estudos de base populacional. Epidemiol Serv Saúde. 2006;15(1):35-45.
18. Siedl EMF, Zannon CMLC. Qualidade de vida e saúde: aspectos conceituais e metodológicos. Cad Saúde Pública. 2004;20(2):
580-8.
Corresponding author:
Silvania Maria de Oliveira Castro
Av. Comendador Enzo Ferrari, 280 – Swift
Campinas-SP, CEP 13044-090
Brazil
E-mail: [email protected]
Received June 24, 2011
Accepted August 12, 2011
J Health Sci Inst. 2012;30(2):134-9
139
Quallity of life of patients with hypertension
Baixar