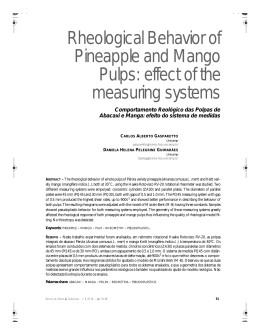
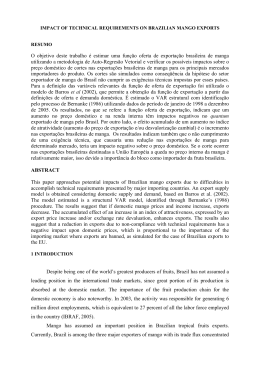
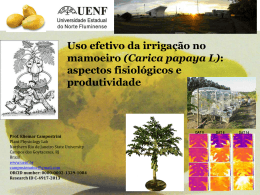
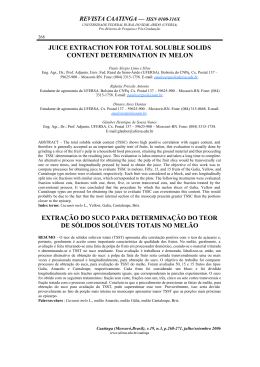
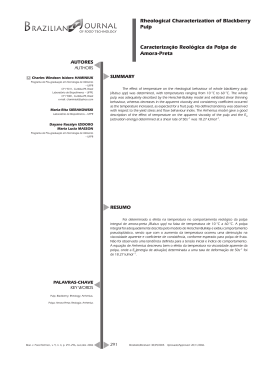
Acta Scientiarum. Technology
ISSN: 1806-2563
[email protected]
Universidade Estadual de Maringá
Brasil
Piveta Ribeiro, Geovana; Cristiane de Andrade, Ana Paula; Daniels, Juliano; Fátima Seibel, Neusa
Development of soy-based beverages with papaya and mango pulps
Acta Scientiarum. Technology, vol. 36, núm. 2, abril-junio, 2014, pp. 341-347
Universidade Estadual de Maringá
Maringá, Brasil
Available in: http://www.redalyc.org/articulo.oa?id=303230170021
How to cite
Complete issue
More information about this article
Journal's homepage in redalyc.org
Scientific Information System
Network of Scientific Journals from Latin America, the Caribbean, Spain and Portugal
Non-profit academic project, developed under the open access initiative
Acta Scientiarum
http://www.uem.br/acta
ISSN printed: 1806-2563
ISSN on-line: 1807-8664
Doi: 10.4025/actascitechnol.v36i2.21958
Development of soy-based beverages with papaya and mango pulps
Geovana Piveta Ribeiro, Ana Paula Cristiane de Andrade, Juliano Daniels and Neusa Fátima
Seibel*
Departamento de Tecnologia de Alimentos, Universidade Tecnológica Federal do Paraná, Avenida dos Pioneiros, 3131, 86036-370, Jardim
Morumbi, Londrina, Paraná, Brazil. *Author for correspondence. E-mail: [email protected]
ABSTRACT. The objective of this study was to elaborate and characterize Soy-Based Beverages (SBB)
with papaya and mango flavors. Three formulations of each SBB were produced with soy extract (SE);
papaya or mango pulp flavor; sugar and citrus pectin, in which were evaluated with chemical and sensory
analysis. The addition of the pulps to SE did not affect the results (p < 0.05) of the chemical
characterization compared to pure SE. The different proportions of pulp and sugar added to SE interfered
only in the values for pH, moisture and total soluble solid. The results of the sensory analysis of preference
showed that the most preferred papaya and mango flavors was the formulation containing 62.7% SE, 30%
pulp, 7% sugar and 0.3% citrus pectin. The acceptance of the most preferred sample of each flavor
represented in the scale used, that the judges 'liked' and / or 'liked a lot' the beverage. It was concluded with
the chemical characterization that the addition of pulps to SE did not add nutritional qualities compared to
pure SE. With the sensory analyses was possible to put in order the samples, and determine which was the
most preferred by judges and quantify the attributes of the chosen sample.
Keywords: soy extract, fruit pulps pectin, chemical characterization, preference, acceptance.
Desenvolvimento de bebidas à base de soja com polpas de mamão e manga
RESUMO. O objetivo do trabalho foi elaborar e caracterizar bebidas à base de soja (BBS) com sabores de
mamão e de manga. Três formulações de cada BBS foram produzidas com extrato de soja (ES); polpa sabor
mamão ou manga; açúcar e pectina cítrica, as quais foram avaliadas com análises químicas e sensoriais.
A adição das polpas ao ES não interferiu nos resultados (p < 0.05) da caracterização química quando
comparada ao ES puro. As diferentes proporções de polpa e açúcar adicionadas ao ES interferiram somente
nos valores de pH, umidade e sólidos solúveis totais. Os resultados da análise sensorial de preferência
mostraram que a formulação mais preferida sabor mamão e sabor manga foi a contendo 62,7% de ES, 30%
de polpa, 7% de açúcar e 0,3% de pectina cítrica. A aceitação da amostra mais preferida de cada sabor
representou na escala utilizada, que os julgadores ‘gostaram’ e/ou ‘gostaram muito’ da bebida. Com os
resultados da caracterização química concluiu-se que a adição das polpas ao ES não acrescentou qualidades
nutricionais em relação ao ES puro. Com as análises sensoriais foi possível ordenar as amostras e
determinar qual era a mais preferida pelos julgadores e quantificar os atributos da amostra escolhida.
Palavras-chave: extrato de soja, polpas de frutas pectina, caracterização química, preferência, aceitação.
Introduction
Recent studies show an increased interest of
consumers for healthier foods, bringing the food
industry to the development of new products based
on soy, whose aspirations are to go beyond the
supply of basic nutrients and the satisfaction of
consumer’s taste (MOON et al., 2005). The foods
produced from soybeans are rich in high quality
proteins, have low saturated fat and are free of
cholesterol (ANDERSON et al., 1995).
Among derivative soy products, the soymilk is
highlighted to be a product ready for consumption,
of high nutritional value, relatively low cost and easy
to obtain (NELSON et al., 1976). In the past, the
Acta Scientiarum. Technology
‘milk’ from soybean shad poor acceptance, basically
due to its unpleasant taste and aroma to the taste of
brazilian consumers (YING-QIU et al., 2008), The
use of Soy Extract (SE) initially was limited to
people with lactose intolerance, vegetarians and
those with dietary restrictions or religious order.
Later, the commercial SE reached considerable
insertion in the market, as inexpensive protein
source and a substitute to cow milk (HEANEY
et al., 2000).
According to Resolution 14/78 of the National
Norms and Standards for Food, the soymilk is
defined as the “[…] product obtained from the
aqueous emulsion resulting from hydration of soy
grains, conveniently cleaned, followed by
Maringá, v. 36, n. 2, p. 341-347, Apr.-June, 2014
342
appropriate processing technology, supplemented
with or without optional permitted ingredients,
may be subjected to total or partial dehydration”,
with its chemical composition thus established:
moisture - maximum of 93.0%, proteins minimum of 3.0%, lipids - minimum of 1.0%,
carbohydrates - maximum of 2.8% and ashes maximum of 0.6% (BRASIL, 1978). Its
combination with fruit juices has been successful,
indicating that consumers may be changing their
attitude in relation to products made from
soybeans, because it joins desirable sensory
characteristics of fruits with the functional
properties of soy (ZULUETA et al., 2007).
The Normative Instruction No 1 from January
7, 2000 defines fruit pulp as the unfermented,
unconcentrated, undiluted product, obtained by
crushing fruits with pulp, through an appropriate
technological process, with a minimum total
solids from the edible part of the fruit, specific for
each one of these (BRASIL, 2000). Its use is often
as raw material for processing other products such
as nectars, juices, jams, ice creams and sweetened
fruit products (BRUNINI et al., 2002), and its
consumption is expanding, mainly in the
industries of dairy products, ice creams, sweet
fruit products, etc., which increases the interest of
both producers and consumers (KUSKOSKI
et al., 2006).
The objective of this study was to elaborate and
characterize a Soy-Based Beverage (SBB) with
papaya and mango flavors using Soy Extract
obtained from cultivar BRS 232, 2010/2011
harvested.
Ribeiro et al.
pectin, in relationship to the total beverage, which were
defined the formulations for both flavors (Table 1).
Figure 1. Flowchart for obtaining Soy Extract (SE).
Material and methods
Preparation of soy extract (SE)
The Soy Extract was obtained according to the
methodology proposed by Mandarino et al. (2003),
in proportion soybeans: water (1:10) and pasteurized
until boiling (Figure 1). The cultivar used was the
BRS 232, 2010/2011 harvest.
Preparation of soy-based beverages (SBB)
The papaya and mango flavors beverages were
elaborated from the homogenization of SE, frozen
pasteurized papaya flavor pulp (Polpa Norte) and
mango flavor pulp (Redondo), sugar and citrus
pectin in industrial blender (Metvisa LQ 15) for 1
minute (Figure 2).
For the formulations of beverages were made five
previous tests for the percentage of pulp, sugar and
Acta Scientiarum. Technology
Figure 2. Flowchart for obtaining soy-based beverages (SBB).
Table 1. Formulations of Soy-Based Beverages (BBS) (%).
Soy extract
Pulp
Sugar
Citrus pectin
64.7
30
5
0.3
Formulations
62.7
30
7
0.3
59.7
35
5
0.3
Maringá, v. 36, n. 2, p. 341-347, Apr.-June, 2014
Soy beverages with fruits pulps
343
Chemical characterization
Statistical analysis
In SE, pulp and formulations of SBB were
performed analyzes of pH, using potentiometer with
glass electrode model NT PHM (Tecnopon Equip.
Especiais LTDA.); total soluble solids (TSS),
expressed in °Brix, measured with Abbe
Refractometer; and total titratable acidity (TTA)
determined by titration with standardized sodium
hydroxide 0.1 M solution, according to the Instituto
Adolfo Lutz (IAL, 2008).
The data of chemical analysis and proximate
composition were analyzed by the software Statistica
10.0, using analysis of variance (ANOVA) and
comparing the averages with the Tukey test at 5%
significance (STATSOFT, 2005).
Proximate composition
The determinations of moisture, ashes and
proteins of beverages and SE were performed
according to AOAC (1995). The moisture
determination was done in an oven at 105oC with air
circulation, ashes were quantified by incineration in
the furnace at 550oC, proteins were determined by
calculating the nitrogen content by the
Microkjeldahl method using correction factor 6.25.
Lipids of SE and beverages were quantified with an
acid hydrolysis followed by Soxhlet extraction with
petroleum ether, according to methodology
described 033/IV by the Instituto Adolfo Lutz (IAL,
2008). Carbohydrates were calculated by difference.
Results and discussion
The Soy Extract was made with 1:10 dilution
(soybean: water), because several authors and
industrial processes report that this is the most
frequently used to formulations of Soy-based
beverage (SBB). The results of chemical analysis of
SE are shown in Table 2, revealing that the higher
proportion is moisture (94.33%), followed by lipids
(2.30%) and carbohydrates (1.95%).
Table 2. Chemical characterization of Soy Extract (SE).
Analysis
pH
Total Titratable Acidity (g citric acid 100 g-1)
Total Soluble Solids (oBrix)
Proteins (%)
Lipids (%)
Moisture (%)
Ashes (%)
Carbohydrates (%)
SE
6.71 ± 0.01
0.05 ± 0.01
2.05 ± 0.07
0.99 ± 0.19
2.30 ± 0.27
94.33 ± 0.58
0.43 ± 0.08
1.95 ± 0.68
Values are mean ± Standard Deviation of three replicates.
Sensory analysis
A preference test was performed with 50 nontrained judgers, of both sexes, where the judgers
ordered the three formulations in preference
increasing order using the method proposed by
Friedman, using the table of Newell and
MacFarlane (1987). If the difference between the
sums of the orders is greater than or equal to the
value tabulated, it is concluded that there is
significant
difference
between
samples
corresponding to the significance level (ABNT,
1994). The preference test was conducted separately
in accordance to each flavor.
In the most preferred formulation of each flavor,
was performed a sensory acceptance test using a
hedonic scale of 10 points proposed by Villanueva
et al. (2005), regarding to color, flavor, texture and
overall acceptability. For these formulations was also
conducted a survey of purchase intention with a 5point scale, where 5 is certainly would buy and 1
certainly would not buy, and frequency of
consumption of soy products. The sensory
acceptance was made with 50 non-trained of both
sexes. These analyses have the approval by Bioetic
and Etic Committee of the Irmandade Santa Casa de
Londrina – Bioiscal, through the Project nº 355/10
= CAAE: 0015.0.083.000-10.
Acta Scientiarum. Technology
The pH and total titratable acidity of SE were close
to values found by Abreu et al. (2007), respectively
(6.78 e 0.05g citric acid 100 g-1), who analyzed a sample
of pure soy extract. These values are also close to those
found by Tashima and Cardello (2003) (7.0 e 0.063 g
citric acid 100 g-1) that analyzed a commercial
sweetened soybean extract, but the value of total
soluble solids (TSS) in this study differed from that
found by these authors (10ºBrix), fact which can be
explained by the presence of sucrose and sucralose in
the sample. The value of SST (9.45°Brix) found by
Abreu et al. (2007) was also higher for the determined
for SE of this study.
The protein content (0.99%) differed from those
found by Caus et al. (2008) and Branco et al. (2007),
whose values were respectively 1.85% and 1.9% and
approached the mean value (1.06%) found by Jaekel
et al. (2010) for beverages formulated with 30%
soybean extract and 70% rice extract. The lipid
content found was larger than the content analyzed
by Caus et al. (2008) (1.95%), which SE was made
from the same cultivar BRS 232.
The moisture content is similar to that obtained by
Branco et al. (2007) (95.94%), and ashes content was
lower when compared with the same author (0.54%).
These contents are shown larger than those obtained
Maringá, v. 36, n. 2, p. 341-347, Apr.-June, 2014
344
Ribeiro et al.
flavorings and colorants, giving preference to natural
pulps of papaya and mango because they are not
traditionally marketed as soy juices flavors. Both
formulations were produced in the same
proportions and under the same conditions, to verify
if the difference of the pulp used influenced in the
values of characterization. The differences in the
proportions of pulp and sugar in both flavors
interfered in pH, moisture and TSS. The higher the
proportion of sugar, lower were the moisture values
and higher the values of TSS, in the case of the
addition of mango pulp these values increased
further. In other analyzes the results did not differ
regardless the type and proportions of pulp and
sugar employed (Tables 4 and 5).
The pH values of the SBB papaya and mango
formulations were near average (5.11) of the values
found by Caus et al. (2008) who analyzed beverages
based of soybean extract with strawberry pulp. The
values for TTA and TSS for both flavors differ from
that found by Abreu et al. (2007) (0.34g citric acid
100 g-1 and 15.20oBrix) for a commercial mixed
drink with pineapple and soy, variation that may be
due to the difference of the fruit used in the
formulation of SBB.
The moisture content for all formulations of
SBB were close to the values found by Uliana and
Venturini Filho (2010) (89.67%) in a mixed drink
made in proportion SE and cranberry juice 1:2, and
the ashes content of mango flavored beverage were
lower, compared with this same beverage (0.45%).
Rodrigues and Moretti (2008) found values of 0.61%
lipids for a peach flavor SBB, while Caus et al.
(2008), values from 1.97% to 2.62%, for SBB with
strawberry and passion fruit pulps, which is closer to
the values found in SBB with mango and papaya
pulp of the present study.
by Silva Júnior and Demonte (1997) (85.62% and
0.37%), which can be explained by factors ranging
from the composition of raw materials until the
processing of SE. The carbohydrates content
approaches the value found by Uliana and Venturini
Filho (2010), 2.05%.
Comparing the results of the chemical
characterization of papaya and mango pulp flavor
(Table 3) with current legislation, noted that the
values of SST and acidity are below the required,
and the pH within the range provided. Because the
Technical Regulation for Establishment of
Standards of Identity and Quality establishes
parameters for papaya pulp: SST - minimum of
10.0 °Brix; pH - minimum of 4.0; TTA - minimum
of 0.17g citric acid 100 g-1. And for mango pulp: SST
- minimum of 11.0°Brix; pH - minimum of 3.3 and
maximum of 4.5; TTA - minimum of 0.32g citric
acid 100 g-1 (BRASIL, 2000).
Table 3. Chemical characterization of papaya and mango pulps.
Pulps
Papaya
Mango
Total Titratable Acidity
(g citric acid 100 g-1)
4.96 ± 0.01a
0.14 ± 0.04a
4.58 ± 0.05a
0.23 ± 0.07a
pH
Total Soluble
Solids (oBrix)
9.07 ± 0.38a
8.67 ± 0.01a
The values are mean±Standard Deviation of three replicates; Means followed by the same
letter in the same column, there are not significantly different by Tukey test (p ≤ 0.05).
The pH, TSS and acidity average of papaya pulp
flavor were close to the values found by Parker et al.
(2009) (4.9, 8.30°Brix, 0.10 g citric acid 100 g-1), which
featured a papaya pulp whose fruit was irradiated. The
pH and acidity for mango pulps were respectively
higher and lower (4.04 and 0.78 g citric acid 100 g-1) of
values found by Brunini et al. (2002), who analyzed
frozen mango pulps, but the TSS value was near
(9.48oBrix).
In order to develop a natural product, beverages
were obtained without addition of preservatives,
Table 4. Chemical characterization of papaya and mango soy-based beverages (SBB).
Formulations
Papaya SBB (30% pulp 5% sugar)
Papaya SBB (30% pulp 7% sugar)
Papaya SBB (35% pulp 5% sugar)
Mango SBB (30% pulp 5% sugar)
Mango SBB (30% pulp 7% sugar)
Mango SBB (35% pulp 5% sugar)
Total Titratable Acidity
(g citric acid 100 g-1)
0.09 ± 0.01a
0.10 ± 0.01a
0.10 ± 0.01a
0.08 ± 0.01a
0.07 ± 0.01a
0.09 ± 0.01a
pH
c
5.45 ± 0.02
5.64 ± 0.01a
5.44 ± 0.02c
5.48 ± 0.02c
5.45 ± 0.01c
5.18 ± 0.01b
Total Soluble Solids (oBrix)
7.57 ± 0.32b
8.03 ± 0.15bc
7.03 ± 0.15b
9.17 ± 0.76dc
10.83 ± 0.29a
10.00 ± 0.50da
The values are means ± Standard Deviation of three replicates; Means followed by the same letter in the same column, there are not significantly different by Tukey test (p ≤ 0.05).
Table 5. Proximate composition of papaya and mango soy-based beverages (SBB) (%).
Formulations
Papaya SBB (30% pulp 5% sugar)
Papaya SBB (30% pulp 7% sugar)
Papaya SBB (35% pulp 5% sugar)
Mango SBB (30% pulp 5% sugar)
Mango SBB (30% pulp 7% sugar)
Mango SBB (35% pulp 5% sugar)
Proteins
0.78 ± 0.02a
0.60 ± 0.02a
0.78 ± 0.02a
0.76 ± 0.15a
0.77 ± 0.08a
0.74 ± 0.11a
Lipids
1.65 ± 0.08a
2.26 ± 0.35a
2.53 ± 0.95a
1.45 ± 0.05a
1.93 ± 0.35a
2.60 ± 0.30a
Moisture
92.35 ± 0.05a
89.87 ± 0.07b
92.03 ± 0.70a
91.51 ± 0.23a
90.16 ± 0.05b
91.52 ± 0.07a
Ashes
0.20 ± 0.07a
0.49 ± 0.03a
0.63 ± 0.65a
0.15 ± 0.20a
0.21 ± 0.02a
0.20 ± 0.07a
Carbohydrates
5.01 ± 0.05a
6.77 ± 0.37a
4.03 ± 0.97a
6.13 ± 0.20a
6.93 ± 0.36a
4.93 ± 0.31a
The values are means±Standard Deviation of three replicates; Means followed by the same letter in the same column, there are not significantly different by Tukey test (p ≤ 0.05).
Acta Scientiarum. Technology
Maringá, v. 36, n. 2, p. 341-347, Apr.-June, 2014
Soy beverages with fruits pulps
345
The proteins content analyzed remained low
compared to the value of SE, concluding that none
of the pulps interfere with the amount of proteins.
This value was also lower than the values found by
Uliana and Venturini Filho (2010) ranging from
1.49% to 1.58% for a soy drink with cranberry juice
1:2 (extract: juice). The values for carbohydrates
were below the values (8.9%, 10.8% and 11.85%)
found by Uliana and Venturini Filho (2010) for
mixed drink made with 10°Brix, 12°Brix and
14°Brix, respectively.
Separately, in the three formulations of soy
beverages of each flavor were done the preference
tests by ordering (Table 6). The most preferred
formulation for both flavors was the one containing
62.7% SE, 30% pulp, 7% sugar and 0.3% citric
pectin. Although the papaya flavor formulations
2 and 3 did not differ among themselves, it was
decided to choose the formulation 2 as the most
preferred because it got a smaller sum of the
preference responses, which means that it obtained
the highest score number 1 (most preferred).
Formulations with mango pulp did not differ in
preference, but it was decided to choose the
formulation 2 as most preferred, as this also
obtained fewer answers 1 (most preferred).
Table 6. Preference test by ordering of papaya and mango flavor
formulations.
Formulations
(1) 64.7%SE 30%pulp5%sugar
0.3%citrus pectin
(2) 62.7%SE 30%pulp7%sugar
0.3%citrus pectin
(3) 59.7%SE 35%pulp5%sugar
0.3%citrus pectin
Sum of orders
papaya flavor *
Sum of orders
mango flavor *
123a
115a
86b
82a
91b
104a
*
1 to most preferred and 3 to least preferred.
As well as Uliana and Venturini Filho (2010)
who analyzed a mixed beverage of extract of soy and
cranberry juice, it was established that the different
concentrations of SE and juice did not affect the
overall score, more over the higher sugar content the
higher grades obtained.
In the most preferred formulation of each flavor
was performed the sensory acceptance test and the
profile of the judges who evaluated the soy beverages
was very similar. To papaya formulation, 62% were
women under 20 years and high school graduate, who
consume juices daily. For the mango formulation most
of the judges were women (64%), between 20 and
30 years, high school graduates, which consume juices
weekly. Among the judges of papaya formulation,
69.4% consume soy-based products, and of mango
flavor 74% consume this type of product.
Acta Scientiarum. Technology
Analyzing the data of the most preferred sample
flavor papaya, its observed that the highest averages
were color (7.67) and texture (7.60), followed by
global acceptance (6.56) and flavor (5.95), in which
there was higher variation. All this scores
corresponding to a degree of acceptance 'liked'
and/or 'liked a lot' the beverage in the hedonic scale
used (Table 7).
Table 7. Sensory acceptance test of papaya and mango flavor
formulations.
Attribute
Color
Flavor
Texture
Global acceptance
Papaya
7.67 ± 1.64
5.95 ± 2.07
7.60 ± 1.81
6.56 ± 1.93
Mango
6.01 ± 2.21
5.92 ± 2.63
6.74 ± 1.91
6.14 ± 2.51
The values are means±standard deviation of fifty evaluations.
Regarding the most preferred mango flavor
sample, the highest means were for texture (6.74)
and overall acceptability (6.14), followed by color
(6.01) and flavor (5.92), corresponding to a degree of
acceptance ‘liked’ and/or ‘liked a lot’ the beverage in
the hedonic scale. Thus, the beverages of different
flavors are sensorily alike. The biggest difference is
in color, where the papaya formulation had higher
mean (7.67).
Means for papaya and mango flavor formulations
are near the means found (6.09) by Branco et al.
(2007) for a soy-based beverage with 20% strawberry
and 10% sucrose. The mean of color to the mango
formulation was also near the mean found (6.19) by
Branco et al. (2007), however for a soy-based
beverage with 25% strawberry and 15% sucrose.
As for global acceptance, the averages of both
formulations were greater than the average analyzed
(5.7) by Felberg et al. (2004) for a mixed drink
extract of soybean and 30% extract of Brazil nut.
Moreira et al. (2010) found lower averages for
the flavor (4.69) and color (6.65) in a chocolate
drink containing 77.36% of soy extract. The two
evaluations are proportionally smaller than those
found for drinks of papaya and mango because the
authors used a sensory scale of up to 9 points.
Analyzing the intention of purchase of papaya
SBB (Figure 3), most of judges (43.5%) would
‘definitely or probably buy’ the beverage, as well as
to mango SBB, in which the majority of judges
(38%) also would 'definitely or probably buy' the
beverage.
It is also noticed that the two beverages had low
rejection, because only 6.53% and 6% of the judges
would ‘certainly not buy’ the papaya and mango
beverage, respectively.
Maringá, v. 36, n. 2, p. 341-347, Apr.-June, 2014
346
Figure 3. Percentage of notes regarding the purchase intent of
papaya and mango SBB.
Among the judges who responded that consume
soy products (69.4%) for the formulation papaya
flavor, it was noted that 46% would definitely or
probably buy the product and only 6% said they
would not buy the product. For the mango flavor
formulation, it was noted that 74% of the judges
who consume soy products, 43.24% would certainly
or probably buy the product and only 0.01% said
they would not buy the product, proving the
acceptability of tasters for beverages of papaya and
mango flavors, being the papaya flavor even more
accepted.
Conclusion
The papaya and mango flavored soy based
beverages were produced containing soy extract,
fruit pulps, sugar and citric pectin. The
differences in proportion of pulp and sugar in
both flavors interfered in pH, moisture and TSS.
The preference order was also influenced by sugar
portion, in which the samples with more sugar
were preferred. The beverages containing 62.7%
SE; 30% of flavor pulp (papaya or mango); 7% of
sugar and 0.3% of citric pectin were chosen by
judgers. And in these were realized the sensory
acceptance test, in which the judges ‘liked’ and/or
‘liked a lot’ for both beverages.
Acknowledgements
The authors acknowledge CAPES for the supply
students’ financial support.
References
ABNT-Associação Brasileira de Normas Técnicas.
NBR13170. Teste de ordenação em análise sensorial. Rio
de Janeiro: ABNT, 1994.
ABREU, C. R. A.; PINHEIRO, A. M.; MAIA, G. A.;
CARVALHO, J. M.; SOUSA, P. H. M. Avaliação química
Acta Scientiarum. Technology
Ribeiro et al.
e físico-química de bebidas de soja com frutas tropicais.
Alimentos e Nutrição, v. 18, n. 3, p. 291-296, 2007.
ANDERSON, J. W.; JOHNSTONE, B. M.; COOKNEWELL, M. A. Meta-analysis of the effects of soy
protein intake on serum lipids. New England Journal of
Medicine, v. 333, n. 5, p. 1715-1716, 1995.
AOAC-Association of Official Analytical Chemists.
Official methods of analysis. 16th ed. Arlington:
AOAC, 1995. v. 1‑2.
BRANCO, I. G.; TEIXEIRA, A. M.; RIGO, M.;
BEZERRA, J. R. M. V.; COUTINHO, M. R.;
ARGANDOÑA, E. J. S.; BASTOS, R. G. Avaliação da
aceitabilidade sensorial de uma bebida à base de extrato
hidrossolúvel de soja, polpa de morango e sacarose.
Revista de Ciências Exatas e Naturais, v. 9, n. 1,
p. 129-141, 2007.
BRASIL. Ministério da Agricultura. Comissão Nacional
de Normas e Padrões para Alimentos. Resolução n.º 14
de junho de 1978. Estabelecer o padrão de identidade e
qualidade para farinha desengordurada de soja, proteína
texturizada de soja, proteína concentrada de soja, proteína
isolada de soja e extrato de soja. Available form:
<http://www.agricultura.gov.br>. Access on: April, 2013.
BRASIL. Ministério da Agricultura. Instrução Normativa
n.º 1, de 7 jan. 2000. Aprova os Regulamentos Técnicos
para fixação dos padrões de identidade e qualidade para
polpas e sucos de frutas. Diário Oficial da União,
Brasília, n. 6, 10 jan. 2000. Seção I, p. 54-58.
BRUNINI, M. A.; DURIGAN, J. F.; OLIVEIRA, A. L.
Avaliação das alterações em polpa de manga ‘Tommyatkins’ congeladas. Revista Brasileira de Fruticultura,
v. 24, n. 3, p. 651-653, 2002.
CAUS, S.; CZAIKOSKI, K.; GOMES, G. V. L.;
CÓRDOVA, K. R. V.; BEZERRA, J. R. M. V.; RIGO, M.
Obtenção de bebidas a base de extrato hidrossolúvel de
soja com polpa de frutas. Revista de Ciências Exatas e
Naturais, v. 10, n.1, p. 115-131, 2008.
FELBERG, I.; DELIZA, R.; GONÇALVES, E. B.;
ANTONIASSI, R.; FREITAS, S. C.; CABRAL, L. C.
Bebida mista de extrato de soja integral e castanha-dobrasil: caracterização físico-química, nutricional e
aceitabilidade do consumidor. Alimentos e Nutrição,
v. 15, n. 2, p. 163-174, 2004.
HEANEY, R. P.; DOWELL, M. S.; RAFERTY, K.;
BIERMAN, J. Bioavailability of the calcium in fortified
soy imitation milk, with some observations on method.
American Journal of Clinical and Nutrition, v. 71,
n. 5, p. 1166-1169, 2000.
IAL-Instituto Adolfo Lutz. Normas Analíticas do Instituto
Adolfo Lutz. Métodos químicos e físicos para análise
de alimentos. 4. ed. São Paulo: Imesp, 2008.
JAEKEL, L. Z.; RODRIGUES, R. S.; SILVA, A. P.
Avaliação físico-química e sensorial de bebidas com
diferentes proporções de extratos de soja e de arroz.
Ciência e Tecnologia de Alimentos, v. 30, n. 2,
p. 342-348, 2010.
KUSKOSKI, E. M.; ASUERO, A. G.; MORALES, M. T.;
FETT, R. Frutos tropicais silvestres e polpas de frutas
Maringá, v. 36, n. 2, p. 341-347, Apr.-June, 2014
Soy beverages with fruits pulps
congeladas: atividade antioxidante, polifenóis e
antocianinas. Ciência Rural, v. 36, n. 4, p. 1283-1287,
2006.
MANDARINO, J. M. G.; BENASSI, V. T.; CARRÃOPANIZZI, M. C. Manual de receitas com soja.
Empresa Brasileira de Pesquisa Agropecuária. Londrina:
Embrapa, 2003. (Documentos 206).
MOON, W.; BALASUBRAMANIAN, S. K.; RIMAL, A.
Perceived health benefits and soy consumption behavior:
two-stage decision model approach. Journal of
Agricultural and Resource Economics, v. 30, n. 2,
p. 315-332, 2005.
MOREIRA, R. W. M.; MADRONA, G. S.; BRANCO, I.
G.; BERGAMASCO, R.; PEREIRA, N. C. Avaliação
sensorial e reológica de uma bebida achocolatada elaborada
a partir de extrato hidrossolúvel de soja e soro de queijo.
Acta Scientiarum. Technology, v. 32, n. 4, p. 435-438,
2010.
NELSON, A. I.; STEINBERG, M. P.; WEI, L. S. Illinois
process for preparation of soymilk. Journal of Food
Science, v. 41, n. 1, p. 57-61, 1976.
NEWELL, G. J.; MAcFARLANE, J. D. Expanded tables
for multiple comparison procedure on the analysis of
ranked data. Journal of Food Science, v. 52, n. 6,
p. 1721-1725, 1987.
PARKER, T. L.; ESGRO, S. T.; MILLER, S. A.; MYERS,
L. E.; MEISTER, R. A.; TOSHKOV, S. A.; ENGESETH,
N. J. Development of an optimised papaya pulp nectar
using a combinationof irradiation and mild heat. Food
Chemistry, v. 118, n. 3, p. 861-869, 2009.
RODRIGUES, R. S.; MORETTI, R. H. Caracterização
físico-química de bebida proteica elaborada com extrato de
soja e polpa de pêssegos. Boletim CEPPA, v. 26, n. 1,
p. 101-110 2008.
SILVA JÚNIOR, S. I. S.; DEMONTE, A. Avaliação da
qualidade nutricional da proteína do ‘leite de soja’ e do
Acta Scientiarum. Technology
347
leite integral em pó. Ensaio experimental e discussão
mercadológica. Alimentos e Nutrição, v. 8, n. 1,
p. 105-120, 1997.
STATSOFT. Statistica 7.0 Software. Tucksa: Statsoft,
2005.
TASHIMA, E. H.; CARDELLO, H. M. A. B. Perfil
sensorial de extrato hidrossolúvel de soja (Glicine max L.
Merril) comercial adoçado com sacarose e com sucralose.
Boletim CEPPA, v. 21, n. 2, p. 409-428, 2003.
ULIANA, M. R.; VENTURINI FILHO, W. G. Análise
energética de bebida mista de extrato hidrossolúvel de soja
e suco de amora. Revista Energia na Agricultura, v. 25,
n. 3, p. 94-103. 2010.
VILLANUEVA, N. D. M.; PETENATE, A. J.; SILVA, M.
A. A. P. Performance of the hybrid hedonic scale as
compared to the traditional hedonic, self-adjusting and
ranking scales. Food Quality and Preference, v. 16,
n. 8, p. 691-703, 2005.
YING-QIU, L.; QUN, C.; XIU-HE, L.; ZHENGXING, C. Inactivation of soybean lipoxygenase in soymilk
by pulsed electric fields. Food Chemistry, v. 109, n. 2,
p. 408-414. 2008.
ZULUETA, A.; ESTEVE, M. J.; FRASQUET, I.;
FRÍGOLA, A. Vitamin C, vitamin A, phenolic
compounds and total antioxidant capacity of new fruit
juice and skim milk mixture beverages marketed in Spain.
Food Chemistry, v. 103, n. 4, p. 1365-1374, 2007.
Received on September 20, 2013.
Accepted on October 4, 2013.
License information: This is an open-access article distributed under the terms of the
Creative Commons Attribution License, which permits unrestricted use, distribution,
and reproduction in any medium, provided the original work is properly cited.
Maringá, v. 36, n. 2, p. 341-347, Apr.-June, 2014
Baixar