Process Improvement in health care units: Scenarios
Planning with Discrete Event Simulation Model
applied to a Nuclear Medicine Unit
Miguel Amador Rosa
Thesis to obtain the Master of Science Degree in
Biomedical Engineering
Examination Committee
Chairperson:
Professor João Pedro Estrela Rodrigues Conde
Supervisor:
Professor Mónica Duarte Correia de Oliveira
Members of the Committee:
Professor João Carlos da Cruz Lourenço
Professor Fernando Godinho
November 2012
If I have one hour to save the world I would spend fifty-five minutes defining the problem and only five
minutes finding the solution
Albert Einstein
Acknowledgments
First of all, I would like to thank Professor Mónica Oliveira for all the guidance, patience and critical
thinking throughout this work, she always showed to me as my supervisor. I would like also wish the
best to little Sofia, that was many times present, although not for her option. I would like also to thank
Professor Fernando Godinho for letting me develop this work on the case of Atomedical, and for the
long hours problem exploration, being always available to receive me. I also want to thank Professor
Guilhermina Cantinho for all the support and insights of Atomedical. Without the collaboration of
them, nothing of this would have been possible.
To Joana Nunes and João Marques, I would like to let a huge "Obrigado" for having been all the
time on my side during this journey.
To Célia Cruz, for all comprehension and help, I will never forget.
To all NEBM crew in the past year. It would not be possible without all the distractions, background
talks and companion. Especially Pedro Afonso, for remembering all the times that one has to have
priorities. To Vanessa Cunha, as promised, and to Anabela Reis for her support in the beginning.
Finally, to my family. To my father for always asking when I finished my thesis, and for funding this
work. To my mother for giving all her support , and always being there for me, and remembering that
tomorrow is always a better day.
iii
Abstract
Health care services are a highly competitive, complex and technology driven market. In the
discussion of National Health Care Systems, a level of context uncertainty adds to the existing, intrinsically, within units examination operations. In this work, a novel combination of the methodology
of Scenarios Planning with Discrete Event Simulation is developed and explored to addressed this
problem in Atomedical, a private Nuclear Medicine practice unit, localized in Lisbon, Portugal.
The objectives of the unit managers decision problem were focused in the examination operations
performance (service quality and operating costs). The use of a Scenarios Planning methodology
allowed to overcome the challenges of unit environment. It also guided the definition of scenarios
that covered a wide range of problem context uncertainties. By using a new approach focused in
operations, this methodology provided further understanding of Atomedical through a structured system analysis, with the identification of relevant variables within the problem. This gave support to
the development of coherent scenarios and strategies for succeeding system study. Discrete Event
Simulation was used to address the uncertainty regarding the procedure in operations. This simulation methodology allowed the evaluation, inside Scenarios Planning, of the drawn strategies and
scenarios through complementary setups of an Atomedical unit model. Model and simulations were
implemented using the SIMUL8 simulation software.
The results of this methodology do not intend to provide unit managers with a solution for their
problem, but rather a deeper understanding of it. The Scenarios Planning methodology was successful in systematically explore both operations system and environment context uncertainties of a
multi-variable problem as in Atomedical, although it requires many technical choices. Learning how
different contexts influence the unit, and the impact of different strategies, provides unit managers the
tools to handle future realization of paths explored in scenarios.
Keywords
Scenarios Planning; Discrete Event Simulation (DES); Uncertainty; Nuclear Medicine; Scenarios;
System Analysis; Operation Management; Scheduling
v
Resumo
O mercado dos serviços de saúde é altamente tecnológico, competitivo e complexo. A discussão
dos Sistemas de Saúde aumenta a incerteza, já existente intrinsecamente ao nível operacional.
Neste trabalho, é desenvolvida e explorada uma nova combinação metodológica de Planeamento
de Cenários com Simulação Discreta de Eventos, no sentido de abordar este problema na Atomedical, uma unidade privada de Diagnósticos de Medicina Nuclear, localizada em Lisboa, Portugal.
Os objectivos do problema de decisão dos gestores estão focados no desempenho das operações da unidade (qualidade do serviço e custos operacionais). O uso de uma metodologia de
Planeamento de Cenários permitiu ultrapassar os desafios do contexto ambiente. Esta guiou igualmente o processo de definição de cenários que cobrissem um vasto leque de contextos de incerteza
do problema. Através do uso de uma nova abordagem, focada nas operações, esta metodologia
permitiu um aprofundar do conhecimento da Atomedical. Usando uma estrutura para a análise de
sistemas, identificou-se as variáveis relevantes para o problema. Estas deram suporte ao desenvolvimento de cenário e estratégias coerentes para a persecução do estudo. A Simulação Discreta
de Eventos foi usada ao nível da incerteza dos procedimentos da unidade. Esta permitiu executar a avaliação das estratégias e cenários construídos, através um modelo da Atomedical. Para a
simulação e implementação do modelo foi usado o software de simulação SIMUL8.
Esta metodologia tenciona providenciar, aos gestores da unidade um superior conhecimento do
problema, ao invés de uma solução. A metodologia de Planeamento de Cenários foi bem sucedida
na exploração sistemática das incertezas ao nível das operações e contexto ambiente, num problema
com múltiplas variáveis, como o da Atomedical. Apesar de, para tal, necessitar de diversas técnicas
auxiliares. Uma ferramenta que permita o conhecimento dos impactos dos cenários e estratégias na
unidade permitirá ao gestores estarem preparados para abordar qualquer evolução da unidade.
Palavras Chave
Planeamento de Cenários; Simulação de Eventos Discreta; Incerteza; Medicina Nuclear; Cenários;
Análise de Sistemas; Gestão Operacional; Escalonamento
vii
Contents
1 Introduction
1
1.1 Motivation . . . . . . . . . . . . . . . . . . . . . . . . . . . . . . . . . . . . . . . . . . . .
2
1.2 Original contributions . . . . . . . . . . . . . . . . . . . . . . . . . . . . . . . . . . . . . .
2
1.3 Thesis outline . . . . . . . . . . . . . . . . . . . . . . . . . . . . . . . . . . . . . . . . . .
3
2 Case Study: Atomedical
5
2.1 Atomedical . . . . . . . . . . . . . . . . . . . . . . . . . . . . . . . . . . . . . . . . . . .
6
2.2 Nuclear Medicine . . . . . . . . . . . . . . . . . . . . . . . . . . . . . . . . . . . . . . . .
9
2.3 Diagnostic health care services in Portugal . . . . . . . . . . . . . . . . . . . . . . . . . 12
2.4 Identifying the decision problem of Atomedical . . . . . . . . . . . . . . . . . . . . . . . 13
2.4.1 Context of the decision problem
. . . . . . . . . . . . . . . . . . . . . . . . . . . 13
2.4.2 Definition, objectives and scope of the decision problem . . . . . . . . . . . . . . 13
2.4.3 Uncertainty as Atomedical decision problem
. . . . . . . . . . . . . . . . . . . . 14
3 Literature review
15
3.1 Methodologies for system analysis in health care units . . . . . . . . . . . . . . . . . . . 16
3.1.1 System analysis . . . . . . . . . . . . . . . . . . . . . . . . . . . . . . . . . . . . 16
3.1.2 Dealing with uncertainty . . . . . . . . . . . . . . . . . . . . . . . . . . . . . . . . 17
3.1.3 Appointment scheduling in health care units . . . . . . . . . . . . . . . . . . . . . 18
3.1.4 Discrete event simulation models . . . . . . . . . . . . . . . . . . . . . . . . . . . 20
3.2 Scenarios Planning in Health Care . . . . . . . . . . . . . . . . . . . . . . . . . . . . . . 23
3.2.1 Scenarios Planning . . . . . . . . . . . . . . . . . . . . . . . . . . . . . . . . . . 23
3.2.2 Scenarios Planning methodologies . . . . . . . . . . . . . . . . . . . . . . . . . . 26
3.2.3 Dealing with Uncertainty in Scenarios Planning . . . . . . . . . . . . . . . . . . . 27
3.2.4 Using Scenarios Planning with other methodologies . . . . . . . . . . . . . . . . 28
3.2.5 Scenarios Planning in health care . . . . . . . . . . . . . . . . . . . . . . . . . . 29
3.3 A combination of Scenarios Planning with Simulation . . . . . . . . . . . . . . . . . . . . 30
4 Proposed methodology framework for Scenarios Planning
31
4.1 Scenarios Planning framework . . . . . . . . . . . . . . . . . . . . . . . . . . . . . . . . 32
4.2 Phase 1 - Analysis of the problem . . . . . . . . . . . . . . . . . . . . . . . . . . . . . . 33
4.2.1 Step One - Identify the focal issue, question or decision . . . . . . . . . . . . . . 33
ix
4.2.2 Step Two - Problem analysis . . . . . . . . . . . . . . . . . . . . . . . . . . . . . 33
4.2.3 Step Three - Identification of problem variables . . . . . . . . . . . . . . . . . . . 33
4.2.4 Step Four - Identification of Key Variables . . . . . . . . . . . . . . . . . . . . . . 34
4.2.5 Variables selection tools in Scenarios Planning . . . . . . . . . . . . . . . . . . . 35
4.3 Phase 2 - Scenarios and Strategies . . . . . . . . . . . . . . . . . . . . . . . . . . . . . 40
4.3.1 Step Five - Scenarios and Strategies construction . . . . . . . . . . . . . . . . . 40
4.4 Phase 3 - Study of Strategies and Scenarios . . . . . . . . . . . . . . . . . . . . . . . . 42
4.4.1 Step Six - Selection of leading indicators and signposts . . . . . . . . . . . . . . 42
4.4.2 Step Seven - Evaluation of Strategies under Scenarios . . . . . . . . . . . . . . . 42
5 Scenarios Planning Phase 1: Analysis of Atomedical problem
43
5.1 Step Two: Problem analysis . . . . . . . . . . . . . . . . . . . . . . . . . . . . . . . . . . 44
5.1.1 Analysis of the Atomedical unit operations . . . . . . . . . . . . . . . . . . . . . . 44
5.1.2 Identifying influential variables in problem objectives . . . . . . . . . . . . . . . . 48
5.2 Step Three: Variables in Atomedical problem . . . . . . . . . . . . . . . . . . . . . . . . 51
5.2.1 People . . . . . . . . . . . . . . . . . . . . . . . . . . . . . . . . . . . . . . . . . . 52
5.2.2 Equipment . . . . . . . . . . . . . . . . . . . . . . . . . . . . . . . . . . . . . . . 52
5.2.3 Materials and products
. . . . . . . . . . . . . . . . . . . . . . . . . . . . . . . . 52
5.2.4 Methods and procedures . . . . . . . . . . . . . . . . . . . . . . . . . . . . . . . 53
5.2.5 Unit environment . . . . . . . . . . . . . . . . . . . . . . . . . . . . . . . . . . . . 53
5.2.6 Unit performance
. . . . . . . . . . . . . . . . . . . . . . . . . . . . . . . . . . . 54
5.3 Step Four: Systematization and classification of identified variables - key variables of
the problem . . . . . . . . . . . . . . . . . . . . . . . . . . . . . . . . . . . . . . . . . . . 54
5.3.1 Direct classification of variables - Dependency Structure Matrix using MICMAC . 55
5.3.2 Indirect classification of variables - Dependency Structure Matrix using MICMAC 57
5.3.3 Impact versus Uncertainty Analysis
. . . . . . . . . . . . . . . . . . . . . . . . . 59
5.3.4 Key Variables . . . . . . . . . . . . . . . . . . . . . . . . . . . . . . . . . . . . . . 62
6 Scenarios Planning Phase 2: Atomedical Scenarios and Strategies
63
6.1 Step Five: Scenarios constructions for the Atomedical problem . . . . . . . . . . . . . . 64
6.1.1 Subsystems Scenarios analysis . . . . . . . . . . . . . . . . . . . . . . . . . . . 65
6.1.2 Scenarios . . . . . . . . . . . . . . . . . . . . . . . . . . . . . . . . . . . . . . . . 67
6.2 Step Five: Strategies in the Atomedical problem . . . . . . . . . . . . . . . . . . . . . . 68
6.2.1 Subsystems Strategies analysis . . . . . . . . . . . . . . . . . . . . . . . . . . . 69
6.2.2 Strategies . . . . . . . . . . . . . . . . . . . . . . . . . . . . . . . . . . . . . . . . 70
6.3 Step Six: Signposts for the Atomedical problem . . . . . . . . . . . . . . . . . . . . . . . 71
6.4 Scenarios and strategies in the Atomedical problem . . . . . . . . . . . . . . . . . . . . 72
x
7 Scenarios Planning Phase 3: Evaluation of Strategies and Scenarios - Discrete Event
Simulation Model
73
7.1 Atomedical Simulation Model . . . . . . . . . . . . . . . . . . . . . . . . . . . . . . . . . 74
7.1.1 Simul8 Discrete Event Simulation (DES) Model Implementation . . . . . . . . . . 75
7.2 Atomedical DES Model Calibration and Validation . . . . . . . . . . . . . . . . . . . . . . 78
7.3 Implementation of Scenarios and Strategies into the Model . . . . . . . . . . . . . . . . 80
7.4 Simulation results
. . . . . . . . . . . . . . . . . . . . . . . . . . . . . . . . . . . . . . . 81
7.4.1 Unit performance indicators . . . . . . . . . . . . . . . . . . . . . . . . . . . . . . 81
7.4.2 Service quality indicators . . . . . . . . . . . . . . . . . . . . . . . . . . . . . . . 83
7.4.3 Unit workload indicators . . . . . . . . . . . . . . . . . . . . . . . . . . . . . . . . 86
7.4.4 Results Summary . . . . . . . . . . . . . . . . . . . . . . . . . . . . . . . . . . . 88
8 Final remarks
89
Bibliography
93
Appendix A Literature review in the scheduling problem in health care units
A-1
Appendix B Atomedical problem analysis
B-1
xi
List of Figures
2.1 Layout of Atomedical Facilities. . . . . . . . . . . . . . . . . . . . . . . . . . . . . . . . .
7
2.2 Cost Structure of Atomedical in 2010. . . . . . . . . . . . . . . . . . . . . . . . . . . . .
9
2.3 Representation of a Gamma Camera components. . . . . . . . . . . . . . . . . . . . . . 11
3.1 Generic architecture of a scenarios planning process. . . . . . . . . . . . . . . . . . . . 26
3.2 Illustration of multiplicity in possible futures, problem instances within a scenario. . . . . 28
4.1 Proposed Scenarios Planning Process. . . . . . . . . . . . . . . . . . . . . . . . . . . . 32
4.2 Dependency Structure Matrix (DSM) and its graph representations. . . . . . . . . . . . . 36
4.3 Example of a DSM for a set of variables, in its original rearrangement and alternative
rearrangement. . . . . . . . . . . . . . . . . . . . . . . . . . . . . . . . . . . . . . . . . . 36
4.4 Variables influence versus dependence chart. . . . . . . . . . . . . . . . . . . . . . . . . 37
4.5 Shape of variables-points configuration as a way to determine the system stability. . . . 38
4.6 Scenarios and Strategies resulting in multiple test conditions. . . . . . . . . . . . . . . . 39
4.7 Scenarios resulting in relevant, coherent and plausible configurations of key variables
possibilities. . . . . . . . . . . . . . . . . . . . . . . . . . . . . . . . . . . . . . . . . . . . 41
5.1 “Fishbone" cause-effect diagram for the operational costs. . . . . . . . . . . . . . . . . . 49
5.2 Process-type cause-effect diagram for the total patient waiting time . . . . . . . . . . . . 50
5.3 Process-Type Cause-Effect Diagram for the Exam Quality . . . . . . . . . . . . . . . . . 51
5.4 Plan of direct influence versus dependence of Atomedical problem variables using MICMAC.
. . . . . . . . . . . . . . . . . . . . . . . . . . . . . . . . . . . . . . . . . . . . . . 55
5.5 Graph of direct influence of some Atomedical problem variables using MICMAC. . . . . 56
5.6 Compared classification of variables influence in direct and indirect classification using
MICMAC. . . . . . . . . . . . . . . . . . . . . . . . . . . . . . . . . . . . . . . . . . . . . 57
5.7 Plan of indirect influence versus dependence of Atomedical system variables using
MICMAC. . . . . . . . . . . . . . . . . . . . . . . . . . . . . . . . . . . . . . . . . . . . . 58
5.8 Graph of indirect influence of some Atomedical system variables using MICMAC. . . . . 59
5.9 Plan of level of impact/importance versus level of certainty/control of Atomedical problem variables in a management vision of the unit. . . . . . . . . . . . . . . . . . . . . . . 60
5.10 Plan of level of impact/importance versus level of certainty/control of Atomedical problem variables in a operational vision of the unit. . . . . . . . . . . . . . . . . . . . . . . . 61
xiii
7.1 Systems and sub-systems of simulation model. . . . . . . . . . . . . . . . . . . . . . . . 74
7.2 Atomedical Simul8 Simulation model. . . . . . . . . . . . . . . . . . . . . . . . . . . . . 76
B.1 Atomedical general examination process flow chart. . . . . . . . . . . . . . . . . . . . . B-2
xiv
List of Tables
2.1 Evolution in the number of patients and exams per year from 2007 to 2011. . . . . . . .
8
3.1 Taxonomy of a framework for handling uncertainties and their effects. . . . . . . . . . . 17
3.2 Characterization of Foresight Techniques. . . . . . . . . . . . . . . . . . . . . . . . . . . 24
3.3 Example of Scenarios Planning methods used, steps and organizations origin. . . . . . 27
6.1 Key variables separation into Atomedical unit subsystems. . . . . . . . . . . . . . . . . . 64
6.2 Strategic key variables separation into Atomedical unit subsystems. . . . . . . . . . . . 68
7.1 Simulation Model Outputs and Signpost. . . . . . . . . . . . . . . . . . . . . . . . . . . . 78
7.2 Calibration Model Simulation Results. . . . . . . . . . . . . . . . . . . . . . . . . . . . . 79
7.3 Unit performance results for Strategy 0 under the procurement scenarios. . . . . . . . . 82
7.4 Unit performance results for Strategy 0 under the operational scenarios. . . . . . . . . . 82
7.5 Unit performance results for Strategies 1 and 2 under the procurement scenarios. . . . 82
7.6 Unit performance results for Strategy 3 under the procurement scenarios. . . . . . . . . 83
7.7 Service quality results for Strategy 0 under the procurement scenarios.
. . . . . . . . . 84
7.8 Service quality results for Strategy 0 under the operational scenarios. . . . . . . . . . . 84
7.9 Service quality results for Strategies 1 and 2 under the procurement scenarios. . . . . . 85
7.10 Service quality results for Strategy 3 under the procurement scenarios.
. . . . . . . . . 86
7.11 Unit resources workload results for Strategy 0 under the procurement scenarios. . . . . 86
7.12 Unit resources workload results for Strategy 0 under the operational scenarios. . . . . . 87
7.13 Unit resources workload results for Strategies 1 and 2 under the procurement scenarios. 87
7.14 Unit resources workload results for Strategy 3 under the procurement scenarios. . . . . 87
A.1 Table of Literature in the Scheduling Problem in Health Care Units . . . . . . . . . . . . A-2
B.1 Atomedical Problem Variables and Analysis Results. . . . . . . . . . . . . . . . . . . . . B-3
xv
Abbreviations
DES Discrete Event Simulation
RF Radiopharmaceutical
NMT Nuclear Medicine Technician
MPS Myocardial Perfusion Study
MIBG Metaiodobenzylguanidine
NM Doctor Nuclear Medicine Specialist Doctor
NM Technician Nuclear Medicine Technician
DSM Dependency Structure Matrix
MDI Matrix of Direct Influences
MII Matrix of Indirect Influences
WT Waiting Time
AVG Average
NHS National Health Service
CEO Chief Executive Officer
xvii
List of Symbols
67
Ga
99m
99
Radioactive Isotope of Gallium-67 . . . . . . . . . . . . . . . . . . . . . . . . . . . . . 44
T c Metastable Nuclear Isomer of Technetium-99 . . . . . . . . . . . . . . . . . . . . . . 46
Mo
Molybdenum-99 . . . . . . . . . . . . . . . . . . . . . . . . . . . . . . . . . . . . . . . 46
xix
1
Introduction
Contents
1.1 Motivation . . . . . . . . . . . . . . . . . . . . . . . . . . . . . . . . . . . . . . . . .
1.2 Original contributions . . . . . . . . . . . . . . . . . . . . . . . . . . . . . . . . . . .
1.3 Thesis outline . . . . . . . . . . . . . . . . . . . . . . . . . . . . . . . . . . . . . . .
2
2
3
1
1.1
Motivation
Health care services are a highly competitive, complex and technology driven market. On one
hand, the pressure in providing a quality service is tremendous, since dealing with the human life.
On the other hand, services are asked to provide the same quality service at lower costs, as a result
of limitation in the public funding. The complexity of health care systems resides in numerous stakeholders on the process that drive a multi variable uncertain environment context for unit operations. In
such situation, problems that managers face are often complex, and the implications of options and
context changes can only be solved with the aid of decision support tools [Ozcan, 2009].
This work addresses a problem in Atomedical, a private diagnostic unit of Nuclear Medicine. The
field presents special operational complexity, mainly due to the dynamic of the used radionuclides. It
justifies the difficulty to overcome uncertainties regarding its management without real experimentation of strategies. This type of uncertainty in Atomedical can be addressed using simulation models to
study the result in quality indicators of different modification to the system. Azevedo [2010] previously
studied Atomedical using a Discrete Event Simulation (DES) model. In this work, the author describes
the development of the model and implementation in SIMUL8 simulation software, while characterizing and analyzing unit operations. However, even tough the developed model remains actual, the
environment context has changed. Atomedical saw a reduction on the number of clients, as a result
of national economic situation. Besides the operational complexity in Atomedical, the uncertainty of
environment context arises as the main problem of management. The different strategies that impact
in the system must also take into account different scenarios in the future of the unit. It is important
to complement the DES methodology to provide a decision support tool to operations management
decisions under those levels of uncertainty.
1.2
Original contributions
To complement the study of the operational uncertainty of the problem with the DES, this work,
Scenarios Planning methodology is explored as a way to systematically analyze the field of scenarios and strategies in the problem. It addresses the uncertainty at the level of the unit environment
context. This method is often used in such complex problems through a more general and abstract
perspective. However, this work explore the development of a new Scenarios Planning methodology
approach that focus on the operational level of the problem and on the impacts of uncertainty in the
unit operations system variables. This approach allows one the use of DES as part of Scenarios
Planning methodology, in order to evaluate the impact of designing scenarios and strategies for several Atomedical unit system variables. This way both operations system and environment context
uncertainties are being addressed in a multi-variable problem as a complex health care service.
2
1.3
Thesis outline
In Chapter 2, this work starts with the characterization of the problem. In Chapter 3, it drives the
literature review of analysis and uncertainty of systems, as well as the use of simulation methodologies, namely the DES, and Scenarios Planning. In Chapter 4, a methodology framework of Scenarios
Planning is presented to Atomedical problem. In Chapter 5 and 6, the new framework is explored in
Atomedical using: problem analysis; variables identification and classification; scenarios and strategies construction and signpost definition. In Chapter 7, the resulting scenarios and strategies are
evaluated in an improved DES model of Atomedical operations in different simulations setups. The
results of the signposts are used to perform an analysis of the uncertainty drivers, which provides unit
managers further knowledge of their unit and options and consequently supporting future decisions.
In Chapter 8, final remarks are presented regarding the results of addressing the uncertainty problem
in Atomedical, suggesting further work and methodology improvements.
3
4
2
Case Study: Atomedical
Contents
2.1
2.2
2.3
2.4
Atomedical . . . . . . . . . . . . . . . . . . . . .
Nuclear Medicine . . . . . . . . . . . . . . . . .
Diagnostic health care services in Portugal . .
Identifying the decision problem of Atomedical
.
.
.
.
.
.
.
.
.
.
.
.
.
.
.
.
.
.
.
.
.
.
.
.
.
.
.
.
.
.
.
.
.
.
.
.
.
.
.
.
.
.
.
.
.
.
.
.
.
.
.
.
.
.
.
.
.
.
.
.
.
.
.
.
.
.
.
.
.
.
.
.
.
.
.
.
.
.
.
.
6
9
12
13
5
2.1
Atomedical
Atomedical is a private Nuclear Medicine unit, located in Lisbon, Portugal. It has a strategic
location, near city main public hospital, Hospital de Santa Maria, a medicine university Hospital,
where the Administrator and the Clinical Director are faculty members in the Nuclear Medicine field.
Atomedical unit is located near a wide range of public transports (including metro and train), and
provides diagnostic services in the field of Nuclear Medicine, among some therapeutic services and
echographies. It targets people from all the country, although the majority of the patients come mostly
from the Metropolitan Area of Lisbon. Since August 2006, Atomedical is a public limited company with
a shareholders’ equity amount of 500 000 e.
Atomedical activity started in October 1987 with a single tomographic chamber equipment, having
increased in infrastructures and number of equipments since then, in order to respond to the increment of patients numbers, being today the largest unit in the field, operating in Portugal, with four
Gamma Cameras.
Atomedical operations are described in detail in a previous work of a simulation model of the unit
[Azevedo, 2010]. For the purpose of this work, will only be presented a broad view of the operations
to sustain the proposed analysis of the current problem.
Services: Atomedical provides mainly services in the field of Nuclear Medicine diagnosis [Azevedo,
2010]. Other services may be provided when is possible to order the needed Radiopharmaceutical (RF) and the needed equipment is available. However, there are three feature exams, as a result
of a higher demand and major revenue generation: the Myocardial Perfusion Study, the All Body Bone
Scintigraphy and the Thyroid Scintigraphy. Besides the Nuclear Medicine diagnosis studies, Atomedical makes use of the cope ability with radioactive products to also provide therapeutical services.
Since the staff, namely the Clinical Director, is able to perform echographies, Atomedical provides
also this type of service, in order to capitalize the in-house skills.
Organizational Structure and Human Resources:
Atomedical organizational structure consists
in a Shareholders’ General Meeting who empowers the Administration Board or Executive Office,
responsible by Atomedical management. The total workforce of Atomedical consists in 34 people: 2
Physicist (in which, Prof. Dr. Fernando Godinho is also Atomedical Administrator), 5 medical doctors
(2 Nuclear Medicine Specialist Doctor (NM Doctor), being one the Clinical Director, 2 cardiologists and
1 specialist in internal medicine), 5 workers in administrative, management and consultative tasks, 10
Nuclear Medicine Technician (NMT), 7 secretaries (working in the reception and exam pick-up), 1
nurse, 1 pharmacist and 3 medical and cleaning auxiliaries.
In Atomedical, the role of handling company stakeholders is a task of the Chief Executive Officer
(CEO), Prof. Dr. Fernando Godinho. His role gives him the autonomy to implement the possible
6
structural and operational solutions of this work problem, as unit manager, being therefore, a Decision
Maker. Drª. Guilhermina Cantinho, as unit Clinical Director, is also a unit manager, and therefore, a
Decision Maker, as she has a major influence in the definition of unit operations, organization and
procedures. In this case of study, Prof. Dr. Fernando Godinho and Drª. Guilhermina Cantinho are
hence responsible by the definition of the decision problem and thereby considered unit managers.
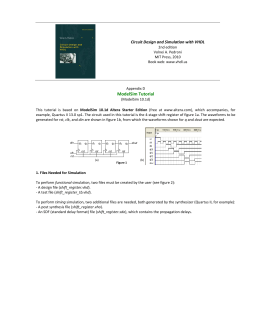
Facilities and Resources:
In Figure 2.1, one can see the Atomedical plant, figuring the most
important zones in the unit operations of examination. The plant identifies clearly the different zones
and their functions that one can gather in self explanatory groups: Waiting Rooms, Administrative
Facilities, Preparation Rooms, Examinations Rooms and Support Facilities.
S.5 WC!
P.2 RF!
S.6 WC!
P.1
Injections
Room!
W.2 Waiting
Room!
A.3 Telephonist!
A.2 Reception
Desk!
E.4 GC Room!
E.5 GC Room!
W.6 Waiting
Zone!
E.2 Console Room!
W.3 Waiting
Room
(Children)!
E.1 Ultrasonography
Room !
S.3!
WC!
E.3 GC
Room!
E.1 Console
Room!
W.4 Waiting
Room
(Stretchers)!
W.5
Waiting
Room!
E.6 GC Room!
P.3 RF!
W.7
Waiting
Zone!
S.7 Store
Room !
E.7 Strain
Studies Room !
S.2 WC!
A.4 Reports
Room!
S.1 WC!
Legend: W.#! Wai%ng Rooms A.1
Reports
Delivery!
W.1 Waitting Room!
Unit Entrance!
Observa%on Windows Countertop A.#! Administra%ve Facili%es P.#! Prepara%on Rooms GC! Gamma Camera E.#! Examina%on Rooms RF! Prepara%on Room WC! Water Closet S.#! Support Facili%es Radiopharmaceu%cals Figure 2.1: Layout of Atomedical Facilities. Based in [Azevedo, 2010]
Unit operations focus in the Preparation and Examination Rooms. In Preparation Rooms, the
patients are administrated with the RF for the following exam or just for a treatment. From the Preparations Rooms, the Radiopharmacy is the place where the Technetium Generator is located, and all
the RF are prepared.
In the Examination Rooms, the different tasks of the examinations are performed, namely images
acquisition in the Gamma Cameras and the Strain Studies. Gamma Cameras are the core of Atomedical operations, so a more detailed description of the existing equipments is made. Atomedical has
four Gamma Cameras with different functionalities and uses. Only one of the Gamma Cameras has
7
a CT (Computer Tomography) that is used in cases where is necessary anatomic information to complement the diagnostic information of the Nuclear Medicine exam, for instance in cardiology studies.
That Gamma Camera is the only one that allows the use of radionuclides of low energy, like the Gallium and the Iodine. One of the Gamma Cameras, E.4, is an older and smaller equipment that is used
in partial or static exams, which require less detail, such as renograms, thyroid or hands scintigraphy.
All equipments must be daily calibrated and the quality control is assured by the Atomedical Physicist.
Atomedical Activity: Although Atomedical provides several types of exams, unit operations are
limited to few types of them. It depends on the procurement, which is influenced by the incidence of
diseases in populations and the diagnostics exams used by practitioners. Table 2.1 provides information about the distribution of the exams performed at Atomedical, where is evident the relevance
of few types of exams. The analysis of the evolution of exam type distribution, Table 2.1, allows to
observe a higher decrease of certain exam types. For instance, the change in Renograms is justified
by the reduction of children Nuclear Medicine exams. This is a result of non-radioactive alternatives
for diagnostic exams. It is also possible to observe a reduction in the number of Bone Scintigraphy in
the year 2011, that has no current direct explanation.
Table 2.1: Evolution in the number of patients and number of exams per year from 2007 to 2011.
2007
2008
2009
2010
2011
Total Exams
32408
31749
32145
29775
21265
Bone Scintigraphy
Myocardial Perfusion
Thyroid Scintigraphy
Renograms
Other Exams
32,22%
37,43%
10,27%
6,79%
13,29%
31,39%
41,39%
9,65%
6,28%
11,29%
29,52%
47,64%
8,87%
3,44%
10,52%
27,55%
51,32%
9,61%
3,43%
8,1%
Exam Distribution
32,01%
39,62%
10,19%
6,43%
11,74%
Atomedical resources provides to the unit a capacity to perform certain number of exams. The
unit capacity depends either on long term decisions, for instance, facilities and the number of existing
equipments (usually irreversible), either on short/medium term decision, for instance, staff and consumables. While the number of exams are the driver of revenues, the unit capacity will determine
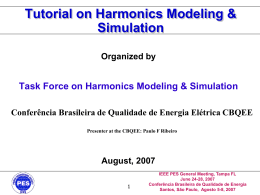
the level of expenditures. The relation between both will result in the unit final profit. In Figure 2.2
is presented the structure of costs in 2010, where one can see significant weight of staff, equipment
maintenance and exam consumables costs. These are the costs related to the short/medium term decisions that influence capacity. Since 2005, Atomedical has the current facilities and equipments, and
therefore, the current capacity. The total exams per year, Table 2.1, shows that until 2009 Atomedical
performed a steady number of exams, that was reported to represent the maximum unit capacity.
Starting in 2010, the number of exams started to decrease, changing the context of unit operations.
To avoid profit reduction or even loss, it is important to develop strategies that reduces the capacity
and, consequently, the costs, which can be either long or short/medium term.
8
Other Costs"
28%"
Consumables"
20%"
Maintenance "
6%"
Staff"
46%"
Figure 2.2: Cost Structure of Atomedical in 2010.
2.2
Nuclear Medicine
Nuclear Medicine is a technique that makes use of the administration of RF to obtain a diagnostic
or a treatment [Webb, 2003]. Differently from other image techniques, as Nuclear Resonance or
X-Ray, this technique does not provide a direct anatomic image, but rather an image of the spatial
distribution of administrated radioactive compounds in the body. Radioactive chemical tracers emitting
gamma rays or positrons can provide diagnostic information about a person’s internal anatomy and
the functioning of specific organs or tissues, usually as a complement of other image techniques,
as anatomic images from X-Rays. RF have specific biological and chemical affinities that, once
administered to the patient, will be localized in specific organs or cellular receptors. This property of
RF allows Nuclear Medicine the ability to image the extent of a disease process in the body, based on
the chemical and biochemical changes and physiology, rather than relying only on physical changes in
the tissue anatomy. In some diseases Nuclear Medicine studies can identify medical problems at an
earlier stage than other diagnostic tests. Treatment of diseased tissue, based on metabolism, uptake
or binding of a particular ligand, may also be accomplished, similar to other areas of pharmacology.
However, the treatment effects of RF rely on the tissue-destructive power of short-range ionizing
radiation [Webb, 2003].
RF are composed by a radioactive element, responsible for the emission of radioactivity to produce the image or to perform the treatment, and by a chemical substrate, that provides the binding
specificity to specific tissues or organs and distribution along the body. Nuclear Medicine uses different compounds to study or treat different systems and functions. The radioactive element is an atom
that presents an unstable nucleus, that releases radiation when decaying to a more stable isotope (radioactive decay) [Webb, 2003]. For the use in Nuclear Medicine, those radionuclides should be pure
gamma radiation emitters. Gamma rays are high energy radiation, with high penetration power, due
to their low interaction with tissues, that can easily exit the body and be detected. There are also used
radionuclides, which emit positrons. A particle and its anti-particle, such as an electron and a positron,
will undergo an annihilation process. This process produces neutral pions which quickly decay into
two gamma-rays that exit the body in opposite directions. Radionuclides for Nuclear Medicine must
9
also have enough half-time
1
to the detection but in the minimum possible dose of radiation for the
patient. From the few radionuclides that can then be used in Nuclear Medicine, Technetium (99m T c)
is used in 90% of the exams since it can be produced on-site, which means that this nucleotide generator can be delivered at the hospitals and clinics where exams are performed. At the therapeutic
level, one is looking for ionizing radiation, namely radionuclides that suffer a beta decay in order to
interact with the tissues. For this purpose, the most used radionuclides are the Iodine 131, Samarium
153 and Strontium 89 [Webb, 2003], that are directly delivered to the units in individual doses, upon
request.
Technetium has a half-life time of about 6 hours and a HVL
2
of 4,6 cm in water, which makes it
optimal to be handled securely in the exams performed. Technetium is generated from Molybdenum
(99 M o) that decays with a half-life time of 66 hours, enough to be produced and be locally delivered,
being the core resource of a Nuclear Medicine unit since it provides all the Technetium for the exams.
In the generator, starting only with Molybdenum, the activity of the Technetium increases until a
maximum value at the end of the second day. After that, the two radionuclides are in equilibrium,
which means that both activities are similar and decrease according the decay of Molybdenum. Units
in full operation need to order new generators in intervals of 2/3 days, with a maximum activity (defined
by the initial amount of Molybdenum) that needs to be adjusted to the number and type of the exams
performed from that generator.
In Nuclear Medicine imaging, RF are administrated internally, for example intravenously or orally.
Then, external detectors (Gamma Camera) capture and form images from the radiation emitted by
the RF. This process is made after a waiting time from the RF administration that depends on its
distribution in each person, on the target tissue and on the radionuclide properties. The administrated
RF dose depends on the activity needed to the tissue in study, the patient size and the current activity
of the radionuclide in use. The Gamma Camera detects the gamma rays, that are continuously emitted
from inside the body, and process the detection signal in order to reconstruct the location of emission
inside the body, providing so the diagnostic information. The resulting image is then evaluated by a
NM Doctor that provides a detailed report.
The Gamma Camera is constituted by a collimator, a gamma ray detector and photomultiplier
tubes. The collimator only allows gamma rays that make an angle near 90 degrees to be detected.
Unlike a lens, as used in visible light cameras, the collimator attenuates most (more than 99%) of
incident photons and thus greatly limits the sensitivity of the camera system. Large amounts of radiation must be present in order to provide enough exposure for the camera system to detect sufficient
scintillation dots to form a picture. In the detector, a crystal scintillates in response to incident gamma
radiation. When a gamma photon leaves the patient it knocks an electron loose from an Iodine atom
in the crystal, and a faint flash of light is produced when the dislocated electron again finds a minimal
energy state. The initial phenomenon of the excited electron is similar to the photoelectric effect and
1 The
half-life time of a radioactive element is the needed time to its decay activity be reduced to half of the initial activity.
A material’s half-value layer (HVL), or half-value thickness, is the thickness of the material at which the intensity of radiation
entering it is reduced by one half.
2
10
(particularly with gamma rays) to the Compton effect. After the production of the flash of light, it is
detected. Photomultiplier tubes behind the crystal amplify the number of resulting photons, allowing the detection of the fluorescent flashes (events) as electrical pulses to a computer that sums the
counts. The computer reconstructs and displays a two dimensional image of the relative spatial count
density on a monitor. This reconstructed image reflects the distribution and relative concentration of
radioactive tracer elements present in the organs and tissues imaged.
Figure 2.3: Representation of a Gamma Camera components.
Gamma Camera need to be highly maintained in order to sustain a performance that assure images quality. One of the Gamma Camera assessment of the equipment performance is the uniformity
of the measurement. Basically, if it is exposed to a uniform flux of gamma radiation, the resulting
image must present a uniform intensity. However, equipments present heterogeneities at this level,
and consequently a daily calibration of the equipment is needed to correct the differences by using a
reference source of radiation of the radionuclides to be used in the exams. During the exam, quality is
guaranteed by assuring a statistical significance in the measurement, by which, a certain number of
gamma rays must be detected. Therefore, an exam duration depends on the level of the activity dose
administrated to the patients, since a higher activity would result in a quicker counting of detection
until reaching the set statistical significance of the measurement. Statistical significance assures that
the difference between the RF resulting measurement and the background is bigger than a detection
limit defined for these methodologies.
Nuclear Medicine is a very distinct technique inside diagnostic and treatment methods in health
care. The use of radionuclides are center of this distinction, because of the need of special equipment
and a strict resource management, the variability in the distribution of the administrated RF, the activity
needed and the acquisition times of different exams and radionuclides. Since units need to deal with
a resource that has a short life span, as radionuclides in a continuous decay, exam management has
to take into account limitations of the resources, in order to maximize its use and provide a quality
service. Any Nuclear Medicine unit presents strong constraints that result in complex systems, making
difficult to predict its behavior. This operational uncertainty is very important in any consideration of
the problem at Atomedical.
11
2.3
Diagnostic health care services in Portugal
All residents in Portugal have access to health care provided by the National Health Service (NHS),
financed mainly through taxation. Co-payments have been increasing over time, and the level of costsharing is highest for pharmaceutical products. Approximately one-fifth to a quarter of the population
enjoys a second (or more) layer of health insurance coverage through health subsystems and voluntary health insurance. Health care delivery is based on both public and private providers. Public
provision is predominant in primary care and hospital care, with a gatekeeping system in place for the
former. Pharmaceutical products, diagnostic technologies and private practice by physicians constitute the bulk of private health care provision [Barros et al., 2011].
Planning and regulation take place largely at the central level in the Ministry of Health and its institutions. The management of the NHS takes place at the regional level. In each of the five regions,
a health administration board that is accountable to the Ministry of Health is responsible for strategic management of population health, supervision and control of hospitals, management of primary
care/NHS primary care centers and implementation of national health policy objectives. They are
also responsible for contracting services with hospitals and private sector providers for NHS patients.
Although in theory the regional health administrations have financial responsibilities, these are limited
to primary care since hospital budgets are defined and allocated centrally. All hospitals belonging to
the NHS are in the public sector, under the Ministry of Health jurisdiction. Private sector hospitals,
both profit-making and non-profit-making, have their own management arrangements [Barros et al.,
2011].
Atomedical operates in the field of private health care diagnostics units. However, it operates as
a complement of the health care providers in the public sector, since most do not have a Nuclear
Medicine unit available or its capacity do not fulfill the unit needs. This is reflected in the nature
of the sector financing, mainly public. It has a higher importance in health care diagnostic units as
Atomedical that have established a service and price agreement with the public sector. Therefore,
most clients of such units reaches there forwarded by public hospitals and units that support the
majority of the cost. Either by providing direct services to the Public Providers, or by providing cost
support services directly to patients, diagnostic units only perform exams if prescribed by medical
practitioners. Therefore, private diagnostic providers in Portugal are highly dependent on the National
Health Care System regarding either funding, or exam requests [Deloitte, 2011].
In 2011, consultant firm Deloitte presented a report of the NHS in Portugal [Deloitte, 2011]. The
report identified, in collaboration with different system stakeholders, the evolution of the NHS that
drives the improvement of several Portuguese indicators of health. On the other hand, the report
identifies the main challenges that the Portuguese health care sector faces nowadays, and that are
important to a unit as Atomedical:
• Financial instability of the Health Care System, due to the increasing costs of service, and to
12
the decrease of tax revenues in an aging population.
• Lack of strategic planning of the services offer.
• Deficiency in the evaluation and responsibility in the implementation of reforms and politics.
• Lack of definition in the role of private institutions in the health care system.
• Legislative instability.
These challenges were exacerbated in the public debt crisis that put in the order of the day the
costs with the NHS. Public Health providers are under pressure to reduce expenditure and the practitioners are pressured to only prescribe essential exams and treatments. As a result of an ongoing
reform of the Portuguese Health Care System, it is unknown the evolution of the role of a public NHS
in Portugal, as well as the impact of ongoing and future policies in the environment where Atomedical
bases its operations.
2.4
2.4.1
Identifying the decision problem of Atomedical
Context of the decision problem
In the last 2 years, Atomedical has suffered with a decrease of the number of patients, as a result
of the changes in health care administration policies and people economic power, as presented in
Section 2.3. After facilities’ expansion in 2004, the unit is now working beneath the maximum capacity,
and with no possible direct interference in the demand. In this environment context, unit managers
have adjusted the complex exams schedule and workforce to the new reality, in order to maintain
the unit final profit sustained in the high reputation of Atomedical. However, these adjustments were
done empirically, based on the experience of the unit managers, mainly the Clinical Director, as the
person in charge of the unit exams scheduling. Despite of the efforts, further adjustments need to be
performed in order to sustain unit viability.
Due to recent investment in facilities expansion and new equipment adjusting the capacity is limited
to intervention in operations, as stated in Section 2.1. Section 2.3 showed how unit managers are
on a leash by the external economic situation. Current health care policies and economic changes
do not allow prediction of the evolution of the current situation. Therefore, unit managers need to be
prepared to the possible switches of the current environment of unit operations, namely at the level of
procurement.
2.4.2
Definition, objectives and scope of the decision problem
Unit managers were supported in the definition of the Decision Problem. The methodology used
in problem identification, helped them to set the problem and its structure, and sustain the following
research and development.
13
The management of RFs perishable products, the diversity and number of exams, with procedure
constraints, and significant workforce size, make managers believe that they can perform in a greater
level of efficiency, adopting some organizational changes. The objective is to reduce operational
costs, maintaining or even improving service quality (examination quality and patient waiting time).
Since it is a risk to perform dramatic changes in the organizational structure of the unit, without a clear
insight of the results, only small changes were performed. Given the context and the unit manager
perceptions, the decision problems on the current situation were identified as problems regarding:
1. Exam scheduling weekly plan, increasing the efficiency of the use of resources, for the set
objectives and radioactive products stock constraints.
2. Setting minimal staff for the proposed schedule and set objectives.
3. Predicting the effects of possible strategies in unit performance in uncertain operational and
environment contexts.
The scope of the problem is Atomedical unit operations, its performance regarding the influence
multiple internal factors, and how external factors could play a role in determining the conditions in
which the unit performs. The analysis of the unit performance is either at the financial level, or at the
service quality level. Vicente et al. [2007] describes dimensions of quality from the part of the patient
are the waiting list for an exam and the waiting time during it, being the last the one that they most
valued. To guarantee a quality service, unit managers added also the importance of the quality of
exam performed (therefore providing a good diagnostic report to patient medic).
2.4.3
Uncertainty as Atomedical decision problem
As presented in Sections 2.2 and 2.3, unit managers face a context of uncertainty at two different
unit levels: operations and environment. At the operations level, uncertainty resides in the behavior of
the unit regarding either changes in procedures and context, or intrinsic uncertainty of procedures (for
instance: exam durations or radionuclides activity) and inputs (for instance: number of patients). Previous work showed the usefulness of system simulation. This provides a tool to evaluate the current
performance and impact of proposed changes, overcoming unit practical test limitations [Azevedo,
2010]. However, current Atomedical problem presents one a system with a high level of uncertainty
regarding its current and future operations. This work must help General Managers not only to improve Atomedical service, but also to prepare them to possible futures of their working, economical,
political and even technological contexts. Therefore, it is important to go further in the development of
a decision support tool to the Atomedical problem.
14
3
Literature review
Contents
3.1 Methodologies for system analysis in health care units . . . . . . . . . . . . . . .
3.2 Scenarios Planning in Health Care . . . . . . . . . . . . . . . . . . . . . . . . . . .
3.3 A combination of Scenarios Planning with Simulation . . . . . . . . . . . . . . . .
16
23
30
15
3.1
3.1.1
Methodologies for system analysis in health care units
System analysis
The development of a decision support tool needs to consider Atomedical operations as a system. A system can be viewed as a set of entities acting and interacting with each other in order to
accomplish some logical end [Law and Kelton, 2007]. Therefore, in studying Atomedical as a system,
one can focus only in the core entities related with the problem under analysis. The general types of
processes that make part of a health care unit system are clinical, management and auxiliary. From
those, the clinical processes are the most important, since they involve planning and controlling of
resources used in the service provided to patients. The management processes deal with the tasks
of managing resources, as equipments, supplies and staff, which support the clinical process. The
auxiliary processes refer to all the resources, needed to the correct service of the health care unit
[Vissers and Beech, 2005]. In Atomedical, one is between the clinical and management process,
although the management is restricted to what directly influences the examination operations.
In order to conduct a study of a system, one has two options: study the real system or study
the system through using a model [Law and Kelton, 2007]. The first option is preferable as the
final results present no doubt, however, the changes are, in most cases, irreversible, and it may be
costly both in money and time. The second option offers the possibility to study a system using a
model, which allows to overcome the difficulties that a real system study presents: studying several
alternative changes, replication of the study and avoiding the risk of considering dangerous or even
illegal changes [Pidd, 2003]. The use of a model of the system suits the problem of Atomedical as
seen in Azevedo [2010].
Models tend to be close representations of the system to be studied. They can also represent
changes whose effects are intended to be analyzed. A model can be either physical or mathematical.
In management, the most frequently used are the mathematical models, since systems behavior
can be, in most cases, easily described this way, allowing one more flexibility than a physical model
[Pidd, 2003]. In cases where one is facing with a simple system, or a simpler model of the system,
the relation between the entities and their behavior can be expressed with a logical and quantitative
method, in order to obtain exact solutions, allowing one to optimize it. Therefore, the mathematical
model can be studied analytically [Law and Kelton, 2007].
Many system configurations have received plenty of study, and can therefore be adapted to similar
problems. For instance, system configuration used in production sites can be used in most common
health care units. The usual solution methodologies applied in this type of mathematical problems can
be divided in: traditional optimization methods, such as, dynamic programming, branch and bound
or use of trade-off curves; integer programming formulations; and, more recent methods, such as,
genetic algorithm, simulated annealing or tabu search. These system models are studied regarding
their performance, and finally evaluate using a criteria or a multi-criteria methodology [Nagar et al.,
16
1995].
However, Nuclear Medicine units were proved to be rather complex. The core problem in Atomedical corresponds to the scheduling of patients exams. However, there are other constraints that
increases complexity. They are mainly related to the management of radiopharmaceuticals, different exams performed and the uncertainty around its environment inputs and procedures. Although
analytical models can address uncertainty in the system components, the complexity of the system
interactions limits the pratical use of analytical models to study Atomedical and similar problems.
Problems focused in operations difficult the simplification of a model to a feasible level, due to multiple
internal and external variables and related uncertainties.
3.1.2
Dealing with uncertainty
In a system, different types of uncertainty may exist, depending on the problem, increase usually with its complexity. They are addressed by different tools and methodologies. In particular, this
topic arises when one desires advanced systems characteristics, such as, robustness, flexibility and
adaptability, although plagued by a terminology poorly defined [McManus and Hastings, 2006]. Uncertainties may be split into four categories. Uncertainties, leading to Risk or Opportunities, which are
handled technically by Mitigations or Exploitations, leading hopefully to wanted Outcomes [McManus
and Hastings, 2006]. These categories are then decomposed in different classes, in a taxonomy
detailed Table 3.1.
Table 3.1: Taxonomy of a framework for handling uncertainties and their effects.
Uncertainties
Risks/Opportunities
Mitigations/Exploitations
Outcomes
Lack of Knowledge
Disaster
Margins
Reliability
Lack of Definition
Failure
Redundancy
Robustness
Statistically Characterized
Variables
Known Unknowns
Degradation
Design Choices
Versatility
Cost/Schedule (+/-)
Verification and Test
Flexibility
Unknown Unknowns
Market shifts (+/-)
Generality
Evolvability
Need shifts (+/-)
Upgradeability
Interoperability
Extra Capacity
Modularity
Emergent Capabilities
Tradespace Exploration
Portfolios and Real Options
Source: McManus and Hastings [2006]
An ideal method to deal with uncertainty would: acquire knowledge about all the uncertainties
that a system faces; calculate all risks and opportunities inherent in them; model the effects of all
mitigations and exploitations strategies; and achieve all the desired system attributes. In the current
methods, quantitative methods, such as Risk Analysis, issue in quantifying known uncertainties and
unsubtle risks. In engineering practices, straightforward techniques, as margins and redundancy, are
used to mitigate less-characterized risks, due to a lack of knowledge or definition [McManus and
Hastings, 2006].
17
One of the emerging demands while dealing with uncertainty is to handle the “unknown unknowns”. If the effects of uncertainty on the performance of systems can be quantified, the associated
risk may be quantified, and mitigations applied [McManus and Hastings, 2006]. If one focuses on the
operational level of Atomedical, addressing the environment context uncertainty could be simplified
through the study of system impact of variations on inputs.
One central concept while dealing with uncertainty is how we express it, and the most widely used
formalism for classifying uncertainty is probability. To ensure that a probability is meaningful, it must
pass the clarity test, which means, an event or quantity must be well-specified for a meaningful probability distribution to be assessable [Morgan and Henrion, 1990]. One can define empirical quantities
as measurable properties of the real world. Other variables or quantities can also be defined, such
as: decision variables (a controllable input variable), value parameters (aspects of the preferences of
the decision maker), index variables (e.g. time and space), model domain parameters (e.g. model
index variables increments) and outcome criteria (variables used to rank or measure the desirability of possible outcomes). All possibly represent an uncertainty [Morgan and Henrion, 1990], that
may have multiple sources [McManus and Hastings, 2006; Morgan and Henrion, 1990]: Statistical
variation, Systematic error and subjective judgment, Linguistic imprecision, Variability, Randomness,
Disagreement, Approximations and Model structure.
Wittenberg [2009] surveyed senior executives in the practice of risk management. They identified
the tools currently employed or that should be employed to address the risk or uncertain situations,
from which result of the common use of combinations of different tools, in order to overcome a myriad
of sources of uncertainty [Wittenberg, 2009].
3.1.3
Appointment scheduling in health care units
One can separate the problem in Atomedical by its environment and operation, even if both closely
related. In its operation, Atomedical uncertainty and complexity is the result of the influence of
scheduling exam appointments in the system performance. The problem of appointment scheduling is one of the more important aspects in the operational management of any service. This problem
in Health care units has received a huge interest by the scientific community regarding its impacts
and optimization. Therefore, a review on the existing literature on this topic was performed, in order
to identify the methodologies used, specific contexts and results, through searching Science Direct
and Web of Knowledge for specified keywords1 . Each source query abstract was manually searched
to pre-screen the relevant articles. Afterwards, the references of each relevant paper was reviewed,
in order to identify published material that was not listed in the first place, or was not available in
searched databases. In order to better understand the diversity of context and approaches, the most
relevant articles were organized in a summary table, Table (A.1), in Appendix A.
1 Spyropoulos
[2000] defines scheduling as a part of planing. Therefore, main keywords used to screen articles were:
scheduling, medical exam* scheduling, outpatient scheduling, scheduling rules, scheduling procedures and planing patient
arrival. Asterisk stands for search all word or word fragment combinations. For instance, exam* finds either exam and its plural,
exams.
18
Health care units usually schedule “customer” arrivals in service. The performance of this appointment scheduling is considerably affected by the operating environments. Therefore, the performance
of different appointment rules may vary in different systems [Ho, 1999]. Their adaptability to the
available information of service and demand variability can simultaneously reduce waiting times and
provider idle time [Rohleder, 2000].
The problem of scheduling in health care focus in three points. First it is necessary to take into
account the randomness of consultation/examination times, where one can only obtain the mean
and standard deviation of this variable while finding a way to optimize an appointment system. This
randomness is in the origin of delays for patients and idle times for service providers, both prejudicial
to a health care unit performance. In second, appointment intervals are usually the way to overcome
the randomness of the system, making use of the distribution values of the consultation/examinations.
However, different rules of intervals also contribute to different waiting and idle times of the system.
Waiting time is generally considered the time from the patient schedule arrival until his departure. The
time spent in contact with the service provider is usually separated, since it does not contribute to the
patient perceived time of waiting. The time of patient earliness is usually not taken into account. The
idle time of the service provider is the time while the professional is not working, which is critical, since
staff represents one of the major cost in health care [Dexter, 1999]. Dexter [1999] also identifies three
factors that can also increase long patient waits: lack of patient punctuality, provider tardiness and
patients without appointments.
The basic trade-off question in any outpatients departments appointment system is patient waitingtime versus physician idle-time. In most cases, these tend to favor the physician at the expense of
the patient. However, with the increase of the competitive economic environment of those services,
many have started reviewing their appointment systems and seeking ways to optimize both variables
[Katz, 1969]. Cayirli et al. [2006] pointed various suggested appointment rules that have been target
of studies. For instance, the importance of the study of optimized scheduling systems is expressed in
existing patent applications of new systems and methods [Luzon et al., 2009].
The operations of Atomedical have recourse to the ability to integrate scheduling with batching
a mix of patients with different and corresponding types of exams, because patients can share the
same procedure setup, and the facility can process several exams simultaneously. Potts [2000] offers a review of comprehensive mathematical techniques in this integration, focusing in the design of
efficient dynamic programming algorithms for solving these types of problems. Scheduling problems
have also been addressed in literature using other methodologies, as multiobjective models (for example, in faculty scheduling assignments [Badri, 1996]) or dynamic programming (for instance, in crew
scheduling [Beasley and Caos, 1998]). Hoogeveen [2005] explores the same problem using multicriteria scheduling, looking for a solution that minimizes the given objective function. In the perspective
of resources, optimized staff schedules can provide enormous benefits if an organization is to meet
customer demands in a cost effective manner while satisfying requirements such as flexible workplace agreements, shift equity, staff preferences, and part-time work [Ernst et al., 2004]. Atabakhsh
19
[1991] reviews the use of artificial intelligence approaches in order to solve the problem of constraint
based scheduling. An artificial intelligence system in this field should not replicate the human scheduler but enhance his capabilities by doing more problem solving than was manually possible. The
study of queuing systems can be done with mathematical models. However, if one uses more general distributions and assumptions to describe the service, a more complex describing model or even
more complex control rules are employed, becoming extremely difficult, if not impossible, to obtain
analytical results [Kolesar, 1970]. This is the situation in Atomedical problem, thus being difficult to
use such methodologies to find a optimized scheduling of patients. Als [2007] pointed the difficulty
of scheduling in a Nuclear Medicine department. For instance, some scintigraphic exams require a
constant camera acquisition time in any clinical indication (myocardial perfusion, thyroid uptake and
imaging, pulmonary ventilation and perfusion as well as static and dynamic renal scans), while others
do not (bone scintigraphy).
In the reviewed literature, Table A.1 in Appendix A, the most common methodology uses simulation models. This methodology showed to be the suitable to the complexity of health care units.
Given the operations that characterize these places, there are some applications of Monte Carlo Simulations [Bailey, 1954; Denton et al., 2006a; Goitein, 1990; Rising et al., 1973], but DES is widely
used in the more recent simulation papers [Cayirli et al., 2006; Coelli et al., 2007; Harper and Gamlin,
2003; Hashimoto and Bell, 1996; Ho and Lau, 1992; Johansson et al., 2010; Katz, 1969; Klassen
and Rohleder, 1996; Klassen and Yoogalingam, 2009; Merode et al., 1996; Su, 2003; Wijewickrama
and Takakuwa, 2008], given problem complexity. Recent literature shows an increase in the use of
optimizations methodologies, such as, linear [Conforti et al., 2010; Kolesar, 1970; Patrick and Puterman, 2008] and integer programming [Chern et al., 2008; Santibáñez et al., 2007], multi-objective
optimization [Castro and Petrovic, 2011; Muthuraman and Lawley, 2008] or other types of optimizations methodologies [Billiau et al., 2010; Hannebauer and Müller, 2001; Min and Yih, 2010; Mittal and
Stiller, 2011; Podgorelec and Kokol, 1997]. However, in such methodologies, one is only allowed to
deal with a well defined uncertainty in a limited number of variables. DES methodology suits better to the complex multi-variable Atomedical problem. Even though, in opposition to more analytical
methodologies, DES alone fails to help one optimize configurations of a model. Therefore, it is expected to find combinations with other methodologies, namely as part of optimization techniques, for
instance, in the evaluation of the performance of a model in a given configuration, as an alternative to
the use of an analytical approach [Gulpnar, 2004].
3.1.4
Discrete event simulation models
DES models are one type of simulation models. Simulation models are proposed tools to model
and study complex systems involving uncertainty, for instance, using sensitivity analysis or Monte
Carlo analysis [Law and Kelton, 2007; Pidd, 2003].
Simulation techniques have been used to address problems of space or bed allocation. In com-
20
bination with Operation Research techniques, they have been used to look at the problems of staff
shift allocation, drug logistics, ambulance or operations theaters scheduling, while the combination
with Artificial Intelligence techniques only began more recently [Spyropoulos, 2000]. Other examples
in the health care context are provided by Angelis et al. [2003] and Masterson et al. [2004].
Simulation models can be classified along three different dimensions. They can be either static
or dynamic. In a static simulation model, one has the representation of the system at a particular
time. An example of this is the Monte Carlo model. On the other hand, a dynamic simulation model
represents a system as it evolves over time. In static simulations, one has static time increments, and
the model analysis is performed with the results obtained within that frames. In dynamic simulation,
one has event simulation model, where the model evolves when an event occurs 2 , with variable time
increments. Simulations models can also be deterministic or stochastic, where the latter contains any
probabilist (i.e. random) components. Stochastic models provide a output that is itself random, an
estimation of the true characteristics of the model. Finally, simulations models can be continuous or
discrete. The use of each type of model is dependent on the specific objectives of the study. If one
wants to study each individual characteristic, a discrete model should be used. If one wants to study
individuals in the aggregate, uses equations in a continuous model are more appropriate [Law and
Kelton, 2007; Pidd, 2003].
Regarding the specific problem in Atomedical, one is interested in using a dynamic, stochastic
and discrete models. As the focus of the study corresponds to events, such as, patients arrival or
patient examination, a dynamic model is best suited. The studied system is characterized by the
randomness of its variables, such as, waiting time or procurement, therefore, a stochastic models
applies to this situation. Because the events do not occur continuously in time, the use of a discrete
model is justified.
The process of problem analysis using a simulation model is usually an iterative approach, where
the current system study is modeled to be simulated. With the simulation results analysis, conclusions
can be drawn regarding the correct representation of the model. The model can be then modified to
better adapt to the original system, or to study the changes to the original system [Maria, 1997]. In
all the steps, decision has to be made, therefore, the role of the problem decision makers in all the
process is of major importance [Pidd, 2003].
Even if one could use simulation as a tool within other methodologies, it is pertinent to consider
the general steps involved in developing a simulation model, designing a simulation experiment, and
performing simulation analysis [Maria, 1997]: (1) Identify the problem, (2) Formulate the problem, (3)
Collect and process real system data, (4) Formulate and develop a model, (5) Validate the model,
(6) Document model for future use, (7) Select appropriate experimental design, (8) Establish experimental conditions for runs, (9) Perform simulation runs, (10) Interpret and present results and (11)
Recommend further course of action. These steps need to be taken into account in any methodology
using simulation models
2 An
event is considered to be a change in the state of one of the model variables.
21
3.1.4.A
Discrete Event Simulation Models in Health Care
DES models are widely found in literature regarding health care units since they present the complex system that this methodology intends to overcome. According to Standridge [1999], simulation
models are a convenient option in the study of health care units systems, namely because:
• Computer simulation conforms both to system structure and available data. This is better than a
pure abstracting of the system into a strictly mathematical form due to a high level of complexity.
• Simulations supports a low cost, and little risk study of health care systems.
• Simulations takes into account variations, that hugely matters in health services, given each
patient specific needs.
• Unique system requirements for information can be drawn from simulation experiment results.
Fone et al. [2003] reviewed the literature of use and benefit of DES models in population health
and health care delivery. The identified topics were in increasing order of popularity: infection and
communicable disease; costs and economic evaluation; screening and, in a greater number, hospital
scheduling and organization. When thinking specifically of health care delivery units, like Atomedical,
simulation applications may be classified into four categories: public policy; patient treatment processes; capital expenditure requirements and provider operating policies [Standridge, 1999]. Günal
and Pidd [2010] review of literature showed an increase number of papers, with an increased interest
in the focus on the patient problems (e.g. waiting time, service quality).
The literature focus in the use of DES in health care services studied staff scheduling in emergency
departments [Centeno et al., 2003; Evans and Unger, 1996], resources allocation in clinical contexts
[Kuban Altinel et al., 1996; Zaki et al., 1997], different screening methods in emergency departments
[Ruohonen et al., 2006; Wang, 2009] and clinical practice costing in the same context [Glick et al.,
2000]. One also finds a significant number of studies in the topic of scheduling, either of surgeries
[Dexter et al., 1999], or of appointments in outpatient services [Cayirli et al., 2006; Harper and Gamlin,
2003; Klassen and Rohleder, 1996; Rohleder and Klassen, 2002; Stahl et al., 2003; Wagner et al.,
2004; Wijewickrama and Takakuwa, 2005]. This methodology has been used also in other contexts,
for instance, in resource allocation and service planning at outpatient units [Côté, 1999; Williams et al.,
2009], in the schedule of staff in wards [Dean et al., 1999] or in the screening procedures for specific
diseases in outpatients units [Ramwadhdoebe et al., 2009; Rohleder and Klassen, 2002].
Regarding specific problems in diagnostic health care units, like Atomedical, one found scant
literature. For instance, Merode et al. [1996]; van Merode et al. [1995] explores the construction of a
decision support system for capacity planning in clinical laboratories, based in a simulation model of
the laboratory. In Nickel and Schmidt [2009], the case study focused on the analysis of the patient
flow and machinery utilization in a radiology department, under different scenarios. Particularly in the
field of Nuclear Medicine, where highly specific operation constraints were already pointed, almost no
literature is found, particularly outside general hospitals. Pérez et al. [2010, 2011] point this situation,
22
while developing a DES model of a hospital Nuclear Medicine department in order to study different
patients and resources scheduling rules. In other paper, Cameron et al. [2006] addressed the problem
of capacity planning in this type of services.
In the Portuguese context, one can found previous work about Nuclear Medicine units, as the one
in the unit of Hospital Privado de Almada [Fernandes, 2007] and more specifically in Atomedical, as
already addressed by Azevedo [2010], that showed how DES is suited to study this type of system
operation. The simple use of DES does not address the problem that Atomedical currently faces regarding the indefinition of its environment. To address this type of uncertainty, Chetouane et al. [2012]
proposes some tools to study simulation models response to variations using sensitivity analysis. But
how can one select the relevant variables to be studied and how can one define their variations?
One of the tools makes uses of scenarios construction in order to explorer the field of system inputs
uncertainty. Therefore it is concluded that there is a need for a methodology to consider scenarios
for Atomedical. Scenarios Planning is an existing tool to perform a more systematic approach of
scenarios construction.
3.2
Scenarios Planning in Health Care
Atomedical managers face a high complex system due to the multiple factors that might influence
operational performance increasing the uncertainty of the problem. Examples of systems analysis
methodologies, as already reviewed, showed how difficult becomes the construction of valuable alternative system simulations for decision support in high complexity system models. When one is not
able to use more objective tool, some “soft techniques” exist to support a more systematic and accurate procedure to provide valuable system alternatives. Scenarios Planning arises as the obvious
methodology to address the environment uncertainty in Atomedical problem. In order to perform the
review on the existing literature regarding the use of Scenarios Planning methodologies, the online article databases used before were searched, since not all are covering the same journals, for specified
keywords3 . Each source query was manually searched through the abstracts to pre-screen the relevant articles. The keyword “health” was used in order to help finding existing articles related to health
care contexts. Afterwards, the references of each relevant paper was reviewed, in order to identify
further published material that was not listed in first place, or was not available in searched databases.
Additionally, the book Ringland [2006] was used as framework to explore this methodology approach.
3.2.1
Scenarios Planning
Uncertainty in the business environment is a constant. A key aspect of strategy is making sense
of this uncertainty and respond appropriately in the pursuit of organizational objectives, which means
3 Main
keywords used to screen articles were: scenarios planning health care, scenario analysis in health care services.
23
multiple possible futures to an organization, that may be problematic. Scenarios Planning is a sensemaking approach, which aims to identify potential predetermined elements in the business environment, helping to explore and understand uncertainty [Burt, 2010]. Ringland [2006] defines Scenarios
Planning as: “That part of the strategic planning that relates to the tools and technologies for managing the uncertainties of the future”.
The end of the Second World War set the start of the technique of “future-now” thinking in USA,
increasing through the 1960s with the development of long-range planning for business incorporating
operations research, economics planning for business incorporating operations research, economics
and political strategy alongside hard science and military consulting [Ringland, 2006]. Major companies, like Shell, Corning, IBM and General Motors (GE) get exposed to this type of thinking, leading
to a peak of interest in the 1970s. GE used scenarios as part of its planning process, in order to think
about the environmental factors affecting its businesses. The method involved using Delphi panels
to establish and verify critical variables and indicators, while both trend-impacts analysis and crossimpact analysis would then help to assess the implications of the interactions among critical variables
and indicators. GE pioneered an approach whereby the cross-impact effects among likely developments are dealt with qualitatively, with plus or minus signs, which then lead to the development of
probable scenarios, as outlined in Georgantzas and Acar [1995] and used until early 1980s where
the technique began to be misused. Some confusion existed between scenarios and forecasts. In
forecasting the danger is in not knowing when it is right to forecast - expect the results to be accurate
- and when forecast cannot be relied on. In domains where forecasting can be reliable, the Delphi
method is widely used, but under uncertainty only a correct Scenarios Planning provide an useful tool
to management, as summarized in Table (3.2). However, only in the mid-1990s was seen a resurgence of the interest in Scenarios Planning [Ringland, 2006]. Royal Dutch/Shell is a classic example
of how Scenarios Planning helped an organization prepare for an uncertain future, referenced and
analyzed throughout literature [Cornelius et al., 2005; Rettig, 1998; Ringland, 2006]. This example
is of a great importance to Scenarios Planning since multiple organization loosely use Pierre Wack
Intuitive Logics, initiated by former Shell group planner Pierre Wack in the 1960s, which became the
mainstream scenarios approach [Postma and Liebl, 2005; Ringland, 2006].
Table 3.2: Characterization of Foresight Techniques.
Technique
Approach
Advantage
Limitation
Appropriate use
Projection
Extrapolation of
historical data
Simplicity; reliable
historical base
Unexpected events
Short-term and
pre-determined factors
Critical
technologies
Focused discussion
by experts
Economical; targeted
Available expertise,
influence factor;
criteria for choices
Preliminary examination
of issues; taps expert
views
Delphi
Large group
judgment
Influence free
process
Testing and confirmation;
mass involvement
Scenarios
Construction of
alternate possible
futures
Anti-forecast
decision guides;
explores uncertainty
Construction of
questions; resource
intensive
Plausibility;
viewpoints of writers;
imagination
Source: Mahmud [2011]
24
Coherent possible
futures; identify
interconnections
One of the earlier steps in most Scenarios Planning methods identifies the fundamental determinants actors of future developments. These so-called driving forces or casual factors are classified as
either constant, predetermined or uncertain [Postma and Liebl, 2005]. Predictable elements can be
more easily addressed by methods and techniques of forecasting. Scenarios Planning is more suitable to deal with a reasonable uncertainty in the not too far distant future. Simplifying the view of future, scenarios provide a clustering of possible future trajectories into distinguishable and meaningful
groups [Whitacre et al., 2008] since Scenarios Planning is well equipped to deal with predetermineds
and uncertainties. However, it usually leaves the unknowables out of discussion [Postma and Liebl,
2005]. Varum and Melo [2010] study shows evidence of use of the Scenarios Planning in literature
in multiples fields, such in economies, government and policies [Mahmud, 2011; Page et al., 2010;
Rawluk and Godber, 2011], product and service development [Burt, 2010], environment [Apeldoorn
et al., 1998; Karvetski et al., 2011], supply-chain management and logistics [Khor et al., 2008; Papageorgiou et al., 2009], technology [Islei et al., 1999], finance [Xie and Xie, 2008], change management
and strategic decision making [Chermack, 2004]. The majority of the literature focus in the process of
Scenarios Planning and methodologies. The scant literature in the success of this methodology application report a positive performance of firms [Johnston et al., 2008; Phelps et al., 2001; Visser and
Chermack, 2009], although organization strategic inertia was found to be the main cause in process
failure[Wright et al., 2008]. An application of Scenarios Planning in Nuclear Medicine unit operations
is something new, since this methodology is usually applied in institutions policies, and not in such
specific operational context to obtain scenarios and strategies.
The generic based Scenarios Planning process architecture is shown in Figure 3.1. While retaining a strong linear structure, the process is multistage, interactive, iterative and data driven, with
some steps needing a high level of creativity, where managers should be actively involved [Brien,
2003; Freeman and Pattinson, 2010]. Restrain the many “messy” diversions of thought and dialogue
that could stretch and derail the process is critical to have a strong structure. The process has no
specific time limits. Concise processes, for example as organized in an urgent reaction to organizational shock or crisis, can be accomplished in a couple of days while processes that explore complex
topics, for example the future of a nation, have to be crafted carefully and can take a couple of years
to complete. The interactive involvement of individuals and groups at different stages means that
contributions management through the process and in structural elements is critical to a successful
outcome wherein people move back and forth between interrelated phases and activities [Islei et al.,
1999; MacKay and McKiernan, 2010; Postma and Liebl, 2005]. Relevant topics to a planning process
will depend on the timescale over which planning is taking place and the level of focus. Over short to
moderate timescales (known as tactical and operational planning), the problem is viewed as one of
strategic positioning based on relatively small time horizons such that emphasis is placed only on plan
agility/flexibility and robustness. This is what one is looking in the Atomedical problem. As timescale
is extended out to longer periods, a planning process also needs to account for continuous learning
on the implementation strategy and practical challenges [Whitacre et al., 2008].
25
Figure 3.1: Generic architecture of a scenarios planning process. Source: [MacKay and McKiernan, 2010]
3.2.2
Scenarios Planning methodologies
Traditional narrative format seeks to create equally plausible and consistent storylines of how the
future might unfold from the present [Schoemaker, 1995].
The Scenarios Planning literature prescribes two modes for using scenarios which are described
below:
Exploratory: Encouraging the exploration of implication scenarios for strategic options using discussion, which are often the end result of the exercise [Schoemaker, 1991]. Any assessments of
existing options in this mode tend to follow flexible qualitative descriptions (eg. plus and minus
scales to assess the strength of opportunity or threat).
Formal Evaluation: Encouraging to explore scenarios implications for strategic options through the
formal evaluation of proposed options [Chermack, 2004; Godet and Roubelat, 1996; Klayman,
1993; Morgan et al., 1999; Wollenberg et al., 2000]. The options are fixed and used as inputs
usually quantitative analysis [Huss and Honton, 1987]. The coherent discipline is argued by
proponents as helping the decision-maker systematically think about choice, promoting a more
efficient use of available information (eg. objectives, constraints, external factors) [Goodwin and
Wright, 2001; Stewart, 2005], or even actively creating their future in a goal-oriented scenarios
planning [Tevis, 2010].
To obtain a set of meaningful scenarios and strategies to evaluate unit operations, one should,
therefore, follow a formal mode of this methodology. In Godet [2006] it is proposed a comprehensive
method to formal construction of scenarios. Some of the existing tools to perform a formal Scenarios
Planning consider a two-by-two matrix whose cells consist of the upper and lower bounds of two key
uncertainties [Geus, 1999]. Scenarios narratives may be also be constructed around themes based
26
on the impacts of decisions [Stewart and Scott, 1995] or on varying perspectives of desirable future
[Gordon, 2008]. Scenarios may also take the form of variations of parameters of a system model,
which can be mathematically defined [Tietje, 2005]. Examples of scenarios planning methods used
in multiple organizations are presented in Table (3.3), as reported by Ringland [2006].
Table 3.3: Example of scenarios planning methods used, steps and organizations origin [Ringland, 2006].
Methods
Method Steps/Phases
Organization
U-Process
(1) Convening necessary project resources (2) Constructing of relevant,
emergent, plausible and clear scenarios and visions. (3) Radiating vision
for and with the larger society
(1) Data Collection (2) Shaping Factors (3) Pilot Study (4) Expert
Workshops
Generon
Consulting
(1) Building the Database (2) Scanning the Range of Possibles and
Reducing Uncertainty (3) Developing the Scenarios
(1) Identify Focal Issue or Decision (2) Key Forces in the Local
Environment (3) Driving Forces (4) Rank by Importance and Uncertainty
(5) Selecting the Scenario Logistics (6) Fleshing Out the Scenarios (7)
Implications (8) Selection of Leading Indicators and Signposts
(1) Project Startup (2) Diagnosis, or Identifying the Focal Issue with
Interviews, Analysis, Synthesis, Desk Research and Feedback (3) Issues
Workshops with team (4) Development of Scenarios (5) Investigation,
Development and Evaluation of Strategic Options
(1) Detection of Key Factors (2) Development of Future Projections (3)
Combination of Future Projections to Scenarios (4) Analysis of
Scenarios and Interpretation of the “Future Space”
(1) Decision Focus (2) Research (3) Structured Scenario-Based
Decision Making (4) Monitoring and Response
French School
Shaping
Factors-Shaping Actors
Godet approach:
MICMAC
Scenario development
by using Peter
Schwartz’s
methodology
Future Mapping
Method
System, Future-Open
and Strategic Thinking
Scenario-Based
Strategy Development
European
Commission
The Global
Business Network
SAMI Consulting
ScMI
Stanford Research
Institute
Source: [Ringland, 2006]
Traditional planning techniques tend to perform less well when faced with high uncertainty and
complexity, in contrast with the Scenarios Planning method. Robust scenarios construction provides
internally consistency that, in addition, should support the consideration of plausible uncertainties,
even if not directly addressed, and challenge managerial thinking [Schoemaker, 1991]. Postma and
Liebl [2005] points that this approach do not prevent management surprise regarding the future.
3.2.3
Dealing with Uncertainty in Scenarios Planning
Also in Scenarios Planning it is important to understand how uncertainty is managed, namely
the relevance of unknowables. Although scenarios approach aims to provide some insight about
the unknown evolution of the present in the future, providing relevant information for early-warning
purposes, only future predetermined and uncertain variables can be addressed. The predetermined
variables exist, since one already knows the alternative future outcomes of events and developments
as well as their probabilities. In the case of uncertainties 4 , the outcomes are known but not their
probability of occurrence. In the case of unknowable, not even the outcomes are known, and therefore,
it is not possible being forecasted, however, they may become very relevant to a decision [Postma
and Liebl, 2005]. It is important to distinguish between what is uncertain to one, and what one ignore
[Ansoff, 1975]. Schoemaker [1995] distinguish three classes of knowledge: 1) things one knows to
4 Is important to notice that these uncertainties refers to possible futures, and, therefore, are different of quantitative uncertainties addressed in Section 3.1.2 where probabilities can be known.
27
know, 2) things one knows not to know and 3) things one does not know not to know. While the first
class is evident, and may be in the field of strategy, scenario building aims help to support the second
type of knowledge. Therefore, the main challenge is to reach the third class, as one is searching for
something without knowing what it is and where to find it. In spite of this difficulty, making assumptions
on the relevant issues or trends/events, and then discuss these, will able one to determine possible
implications and explore inconceivable elements of the problem [Schoemaker, 1995].
Many details which are not outlined at the level of a scenario, are needed to fully specify a particular path to the future. Filling in these details involves specifying the structure of a model (i.e. model
of the real environment) and specifying the initial conditions. Defining these model details is a sort of
problem instantiating, while running the model (i.e. simulating the dynamics of the real environment)
allows us to generate an actual path to the future. Due to the randomness of some events, each
simulation can take a unique path and result in different future conditions [Whitacre et al., 2008]. The
multiple existence of possible futures within a problem instance and multiple problem instances within
a scenario are illustrated in Figure 3.2.
Scenario!
Space!
Simulate
Dymamics!
Instantiate
Scenario!
Future Space!
Problem
Instance Space!
Figure 3.2: Illustration of multiplicity in possible futures, problem instances within a scenario. Adapted from:
[Whitacre et al., 2008]
The problem of uncertainty is not completely addressed by Scenarios Planning, mainly when that
uncertainty resides in great part inside the system itself. Therefore, proposed Scenarios Planning
methods include other methodologies in their steps.
3.2.4
Using Scenarios Planning with other methodologies
There is a lack of literature in the use of Scenarios Planning with other problem solving methodologies. Although, in order to support strategy, Scenarios Planning may be integrated with other tools,
namely System Modeling [Apeldoorn et al., 1998; Burt, 2010; Papageorgiou et al., 2009; Xie and Xie,
2008], Decision Analysis [Karvetski et al., 2011; Ram et al., 2011; Wright et al., 2009], Programming
[Khor et al., 2008] and Bayesian Networks [Cinar and Kayakutlu, 2010].
Lempert et al. [2003] report discusses how, under assumptions of deep uncertainty, a quantitative
approach to scenarios can be helpful. The use of quantitative scenarios allows a better use of other
methods. For instance, in Whitacre et al. [2008], a basic problem is solved using scenarios as base
for the study of solutions performance using meta-heuristics such as Evolutionary Algorithms, and in
[Apeldoorn et al., 1998], scenarios provide a set of parameters to a simulation model, in an iterative
process. Davis et al. [2007] introduces a way to enhance strategic planning through Massive Scenario
28
Generation, making use of a mathematical model of the problem in analysis as a way to produce large
scale number of scenarios. System modeling can be done in the form of behavior-over-time graphs,
causal mapping and feedback loops helping in structuring and linking variables and their interaction
to provide an understanding of the systemic drivers of these predetermined elements, supporting
methodological integration with Scenarios Planning [Burt, 2010]. In Papageorgiou et al. [2009], Scenarios Planning is used to produce scenarios of a transportation system, which are modeled and
evaluated using simulation, a similar approach of the one used in Apeldoorn et al. [1998].
Altough none in the specific context of health care services, combination of DES with a simple
Scenarios Planning methodology was explored successfully used as reported in existing works [Apeldoorn et al., 1998; Papageorgiou et al., 2009].
3.2.5
Scenarios Planning in health care
The use of Scenarios Planning in health care service context takes few attentions of scientific
literature. In the same way of other fields, Scenarios Planning in health care may not prevent the organizations from picking “the wrong future". Yet, it will prepare them to better deal with implications of
technology and payment/contracting change, the shift to ambulatory care and the decline in in-patient
days. Scenarios Planning is not about predicting the future. It is about preparing an organization for
a number of possible futures [Rettig, 1998]. Scenarios allow a pre-prepared game plan available for
ready use as the future unfolds. They allow a deliberative response rather than a hastily constructed,
urgent reaction in the opinion of Enzmann et al. [2011] which uses Scenarios Planning exploring the
future of the field of radiology. Therefore, Scenarios Planning shows to fit the Atomedical problem,
addressing the current uncertainty around its future operations environment.
In the case of Venable et al. [1993], Scenarios Planning is used in a local public health department, focusing in key health care and organizational issues, resulting in a set of plausible scenarios that aided in strategic planning, encouraged strategic thinking among managers, eliminated or
reduced surprise about environmental changes, and improved managerial discussion and communication. Neiner et al. [2004] uses Scenarios Planning, in a health department, to address chronic
disease prevention and control, based in behavioral key factors. In Woude et al. [2003] nursing future
is explored while Ellis et al. [1990] studies predicted models outcomes of an hospital in different scenarios to understand the interrelations among the fundamentals elements of hospital inpatient care.
Ultimately, Lexa and Chan [2010] discusses the scenarios analysis in the sequence of USA deficit
reduction policies effects in Health Policies and particularly in Radiology practices. These last two
studies present some similarities with the Atomedical problem although do not explore explicitly the
operation impacts as being proposed as the result of this literature review.
29
3.3
A combination of Scenarios Planning with Simulation
Increasing use of combination of tools from both within and across Operational Research and Management Science to support strategy process has been recently reported [O’Brien, 2011]. Although
existing references in Section 3.2 of how Scenarios Planning could combine with other methodologies to solve multiples problems a lack of literature exists in this area, namely in health care units. As
seen in Section 3.1, DES is widely used in systems with the type of complexity of diagnostic health
care units, like Atomedical. For instance, in problems regarding scheduling and resources management. However, it does not address all the problem uncertainty, namely the one regarding the unit
environment context. The impact of those uncertainties in the system performance can be assessed
using different alternate environments. This can be done using sensitivity analysis if the number of
variables are identified and in small number. However, the case of Atomedical, it lacks in the identification of those variables, and the problem complexity results in a not feasible approach without the
use of complementary tools. The use of Scenarios Planning provides multiple simulations conditions
to the system model, by providing a methodology that systematically addresses all uncertainty and
variables in the construction of meaningful scenarios and strategies, as a result of problem analysis
and structured construction methods. In Ellis et al. [1990], the interrelations of the fundamentals elements of a hospital inpatient care are studied through the outcomes of simulating different models
in different scenarios, while in Venable et al. [1993], changes to the health units system model are
simulated to evaluate performance in different system contexts. Therefore, Scenarios Planning is able
to address more operational problems, as Atomedical. However, scenarios are driven from a reduced
and predefined variables, and simulation is based in mathematical models due to the problem simplicity compared with Atomedical. The use of DES approaches were already implemented with positive
results in other contexts Apeldoorn et al. [1998]; Papageorgiou et al. [2009], however, in simplistic
approach and in simpler systems, with predefined variables.
Scenarios Planning aims to provide multiple future scenarios to institutions which prepare themselves through strategic planning for each possible situation. In Scenarios Planning literature, scenario terminology is usually used to describe the external system context, while strategies are related
to the internal system. But, in Atomedical problem, it is important to make use also of operational
scenarios. They are the result of the factors which managers could not interfere, and strategies,
which can be direct addressed by the managers. Therefore, a new framework of Scenarios Planning
needed to be developed to address this specific application of current techniques. The use of Scenarios Planning in the case of Atomedical needs to perform a complete problem analysis of multi variable
systems and be focused in the operations impact, rather in environment scenarios. Recollecting the
objective of this work, the purpose of a proposed methodology is to evaluate different possible strategies in different scenarios, in order to guide managers to forestall future scenarios with successful
strategies.
30
4
Proposed methodology framework
for Scenarios Planning
Contents
4.1
4.2
4.3
4.4
Scenarios Planning framework . . . . . . . .
Phase 1 - Analysis of the problem . . . . . . .
Phase 2 - Scenarios and Strategies . . . . . .
Phase 3 - Study of Strategies and Scenarios
.
.
.
.
.
.
.
.
.
.
.
.
.
.
.
.
.
.
.
.
.
.
.
.
.
.
.
.
.
.
.
.
.
.
.
.
.
.
.
.
.
.
.
.
.
.
.
.
.
.
.
.
.
.
.
.
.
.
.
.
.
.
.
.
.
.
.
.
.
.
.
.
.
.
.
.
.
.
.
.
.
.
.
.
32
33
40
42
31
4.1
Scenarios Planning framework
In Scenarios Planning methodology no standardized process exist. However the various approaches show a basic structure. As reported in literature review, Shell management way of thinking
on dealing with scenarios was the main reference to many other organizations and institutions, resulting in a broader literature in this Shell-scenario approach, and which was improved in Postma and
Liebl [2005] as a management tool. Godet [2006] provides complementary tools for specific steps
that are similar to Shell-scenario approach. It allows deep Scenarios Planning process, considering
realities full of unknowns as objectively as possible. The proposed tools enable users to ask the
right questions and identify key variables, analyze actors’ strategies, scan possible futures, reduce
uncertainty, obtain a full diagnostic of the company in terms of its environment, identify and evaluate
strategic choices and options. Therefore, an articulation of Postma and Liebl [2005] and Godet [2006]
frameworks for Scenarios Planning will be the backbone of this work methodology focusing in the unit
operations level. The proposed methodology, Figure 4.1, is adapted to the specificity of the Atomedical unit problem, focusing in the examination operations, using, in such way, some complementary
tools suggests by both authors. Since Postma and Liebl [2005] and Godet [2006] methodologies lack,
in some order, in the use of more quantitative tools, needed to the study of a unit processes, which
will rely in the use of a simulation model, some steps/tools will be introduce, as well as other relevant
considerations from other reviewed literature.
Tool!
Phase 1!
Analysis of the problem!
Step 1!
Structural Analysis!
Direct Classification of Variables –
Dependency Structure Matrix!
Problem Identification!
Identify the focal issue, question,
decision!
Identify the problem spectrum!
Identify objectives of the result!
Step 2!
Problem Analysis!
System analysis!
Retrospective analysis in environment!
Actors identification!
!
Step 3!
Problem Variables!
System Analysis!
Scenarios and
Strategies!
Study of Strategies and
Scenarios!
Phase 2!
System Analysis!
Phase 3!
Structural Analysis!
Indirect Classification of Variables
- MICMAC!
Tool!
Step 4!
Key Variables!
Impact vs Uncertainty
Analysis!
Step 5!
Tool!
Scenarios and Strategies
Construction!
Morphological Analysis!
Blocks Method!
System Analysis!
Tool!
Step 6!
Step 7!
Indicators and Signposts
selection!
Discrete Event Simulation!
System Analysis!
Evaluation of Strategies under
Scenarios!
System Performance under a set of
conditions!
Strategy Selection Decision!
Figure 4.1: Proposed Scenarios Planning Process.
32
Tool!
Tool!
Multicriteria Methodologies!
Godet [2006] reinforce that a scenario is not a future reality, but rather a way of foreseeing the
future, concerning for efficiency of coverage, and consistency and feasibility of the possible combinations, for which propose five necessary conditions for a rigorous scenarios construction: relevance,
coherence, plausibility, importance and transparency.
4.2
4.2.1
Phase 1 - Analysis of the problem
Step One - Identify the focal issue, question or decision
The first method steps aims to analyze the problem faces, and to set the system parameters to
be addressed. This step is generally performed through a workshop with the multiple visions of the
organization. In the case of Atomedical, this was performed through meetings with unit managers.
Both Postma and Liebl [2005] and Godet [2006] identify this step as the first one for theirs proposed
methods. One must clearly identify the spectrum of the problem that will be addressed, as well as,
the result of the question or problem motivating the work.
4.2.2
Step Two - Problem analysis
Step two is, at a certain level, identified in Godet [2006] as two steps: diagnosis of firm and
capture organization dynamics. However, both are joined in this step. In the case of Atomedical, the
focus was in the operations and its dynamics. This is a change regarding the use of Godet [2006]
methodology proposal. This step allows the identification of relations and interactions of components
set related to the problem, describing it as a system. Besides the recognition of inputs and output of
the system, internal relations and interdependencies are also pointed, in order to give assistance to
variables identification in the problem context (Postma and Liebl [2005] classifies variables as system
forces). Capturing also the organization dynamics can be done by a retrospective look at it in the
environment, its development, behavior, strengths and weaknesses face to face with main actors in
its strategic environment, from which key questions for the future may arise. It allows to still explore
the context of operations usually addressed in Scenarios Planning. The problem of Atomedical is in
the boundaries of the context and operations.
4.2.3
Step Three - Identification of problem variables
After an initial description of the processes related to problem, a process of teasing out variables
and reviewing the mechanisms connecting them is enriched through another workshop, which could
make use of diagrams representations for posterior validation by the participants, unit managers in
this case. Arcade et al. [1999] suggests, for didactic purposes, to group variables, respectively corresponding to: the internal system, the specific context and the global environment. By focusing in
the operations, makes sense to group variables based in the specific contexts of influence of problem
33
objectives. One has to remember also that in a systemic approach, a variable exists only through its
relationship with other variables.
To identify significant variables it is important to focus in the problem/decision objectives, and
identify what can contribute to its success or failure, by taking into account the previously steps on
system characterization Godet [2006]. In some way, it is difficult to establish where step two ends and
step three begins.
4.2.4
Step Four - Identification of Key Variables
In the Scenarios Planning methodology, identification of key variables is very important, as they
are the ones on which the system mainly depends. In this step, key variables of the organization
and its environment are identified (Postma and Liebl [2005] classifies key variables as driving forces).
Key variables identification in Scenarios Planning consists in isolate variables by their impact in the
system, uncertainty and independence [Postma and Liebl, 2005].
Key variables are the ones which have significant impact in the system. However, in this sort of
methodology, as scenarios are a set of possible futures for key variables, the variables’ impact is also
related to the dependence between variables, since a variable has a greater impact if it is independent,
and if it influence others (for instance, if a major variable has a huge impact in the system, but it is a
result of other variable behavior, we can consider them as one cluster of variables, characterized by
the last one behavior) [Postma and Liebl, 2005]. Also, key variables are those with some degree of
uncertainty, since others can be predicted or manipulated, and therefore, are either a unchangeable
of the problem, or can be addressed in a strategic approach [Godet, 2006].
In this step, a set of tools are suggested in order to help the decision maker to establish the key
variables. The use of these tools is complementary to the process, however, they are essential to
structure the ideas. The proposed tools cover all key variables criteria, and will help the judgment
of workshop members. Despite providing tools to organize the process, it is rather subjective and
the result will always depend on the workshop members choices, and may change when considering different persons, or visions. A way to overcome this situation, inside a organization, is to use
quantitative tools to take into account different views to the final result, which can be done with the
different views of each of the decision managers. Similar approach can be made in the qualitative
tools, providing to a decision maker a set of different results, which may help to think about alternative
configurations. Therefore, some of the Godet [2006] and Postma and Liebl [2005] proposed tools are
introduced and complemented, which can be used in this step in order to identify the key variables of
the system as:
Scenario: A scenario variable is a key variable, therefore it must have impact or importance to the
dynamics of the problem system. It must be also an influential variable to the system. This
type of variable is characterized by a lack of knowledge or control, being therefore a system
34
uncertainty. It is also relevant to represent some degree of possibility, thus having the possibility
of change in the future, or associated to frequent events.
Strategy: A strategy variable is also a key variable, so it must also have impact or importance to the
problem system dynamics. It may be also an influential variable to the system. However, this
type of variable is characterized by a possibility of control by unit managers. Therefore, it makes
no sense to think in possibility of frequency, since it is ultimately a strategic decision.
Signpost: A signpost in not usually a key variable, but has contributions to the problem objectives,
having then importance or impact in the problem. Therefore, it usually presents a high dependence of other variables, and is prior unknown and uncontrollable by unit managers.
4.2.5
Variables selection tools in Scenarios Planning
Structural Analysis Tool for classification of variables dependence and influence - Dependency Structure Matrix and Direct Classification: One of the structural analysis tools allows to
perform a direct classification of variables, by the construction of two-dimensional matrix called a
structural analysis matrix in Godet [2006]. Similar tools can be found in literature, originally regarding project management and corporate organization, usually called of a Dependency Structure Matrix (DSM) [Yu et al., 2009] (design structure matrix, dependency source matrix, dependency map,
interaction matrix, incidence matrix, precedence matrix, and others names are also used in the literature [Browning, 2001]). They can also be found in the study of complex software architectures [Sangal
et al., 2005] as it can be applied in system decomposition and integration problems [Browning, 2001].
DSM taxonomy Scenarios Planning methodology uses a static DSM, which is essentially the
square matrix: N 2 (with N being the system variables). The construction of a DSM starts from the
initial pool of variables, distributed either in the rows and in the columns of a matrix. Each matrix
position represents the direct influence between each variable. [Godet, 2006] suggest the use with
workshop participants of the qualitative intensities: strong (3), average (2), weak (1) and potential (P).
The potential intensity (P) is used to introduce an influence which can vary in different scenarios. This
procedure of systematic interrogation allows the decision makers to avoid errors, and also to rank and
to classify ideas. In doing so, it creates a common language to the problem and allows one to redefine certain variables and therefore refine the analysis of the system [Godet, 2006]. While building the
DSM is important to avoid [Arcade et al., 1999]:
• the existence of a direct relation from a variable to another and vice versa. In such a case, one
must favor the most direct or operational relation in DSM filling up.
• recording a direct variables relation, when relation is established through another listed variable.
• considering a relation between variables, if the correlated evolution is only due to the action of
a third variable at the same time on both of them.
35
AC/UNU Millennium Project
Futures Research Methodology
Figure 3 : the structural analysis matrix and its graphs
Figure 4.2: DSM and the spontaneous graph representation. Source: Arcade et al. [1999].
The DSM is built in a way that looking into a row, one sees which variables the respective variable
influence, and looking into a column, one see which variables the respective variable depends on.
A first analysis of the DSM could be made by forming a graph whose vertices correspond to the
variables and whose arrows or edges correspond to the pointed relations in the matrix, as indicated
(spontaneous graph) in Figure 4.2 [Arcade et al., 1999].
Despite allowing a more clear representation of relations and influences, by capturing pair-wise dependencies of the problem, static DSM can be turned into higher order interactions (linkage groups).
One way is toT.-L.
rearrange
the DSM
order
identify
group
of close related variables, as one can see
Yu, D. E. Goldberg,
K. in
Sastry,
C. F.toLima,
and M.
Pelikan
in Figure 4.3, in a process denominated as clustering [Yu et al., 2009].
In this framework, one can use a simple algorithm to create a graph into a hierarchy under the shape
of a tree.
This algorithm, whose stages are described in frame 1 hereafter, can moreover be realized
Figure 2: DSM clustering examples.
without
necessarily
using
information
processing
tools.
clustering
of variables
(b) and
an alternative
rearrangement
with the same objective (c). Source: Yu et al. [2009].
Figure 4.3: Example of a DSM for a set of variables, in its original (a) shape, after a rearrangement to evidence
components within a module maximally interact with each other (Fernandez, 1998).
As an example, consider the DSM shown in Figure 2(a). One can see from Figure 2(b)
that thecould
original
DSM
rearranged by permuting
rows and columns
contain most
DSM analysis
also
bewas
complemented
with a graphical
view oftovariables
relative level of
of the interactions within two separate modules: {A, F, E} and {D, B, C, G}. However,
interactions(direct
are leftclassification),
out of any modules.
An alterative
arrangement
is suggested
influence
andthree
dependence
for instance
as Figure
4.4 [Godet,
2006].
Structural
Analysis
in Figure 2(c). This arrangement suggests the forming of two overlapping modules:
{A, F, E} and {E, D, B, C, G}. It eliminates two left-out interactions by introducing a
bigger but sparser module. Generally speaking, a clustering arrangement is considered
to be “good” if only few (or none) interactions are left out and clusters are dense.
The DSM representation of a system/product architecture has been shown to be
useful because of the visual appeal and simplicity. Numerous researchers have used
it to propose architectural improvements by manipulating the order of rows and/or
columns in the matrix (McCord and Eppinger, 1993; Pimmler and Eppinger, 1994).
In an attempt to automate this manual process of DSM inspection and manipulation,
Fernandez (1998) used the simulated annealing search technique to find good DSM
clustering arrangements. In his approach, each component starts out by being an individual module and evaluates bids from all the other modules. If any module is able to
36
make a bid that is better than the current base case, then the component is moved inside
the module. The objective function is therefore a trade-off between the cost of being
inside a module and the overall system benefit. Sharman et al. (2002) attempted using
Fernandez’s algorithm on an industrial gas turbine. However, they showed that this
12
The variables are plotted on a two-dimensional matrix whose axes are defined as
influence and dependence. Therefore, each variable is defined by these two criteria
according to its position on the matrix.
Figure 4.4: Variables influence versus dependence chart. Source: Godet [2006]
Figure 4 – Different types of variables on the matrix with axes influence and dependence.
To draw the influence-dependence chart, assume that tij (i, j = 1, 2, . . . , n) are the elements of a
The
variables
are highly
influential
and
independent.
DSMinput
of variables
T . The(1)
following
levels for
variables can
be also
defined
in it [Lee et al.,These
2010]: variables
tend to describe the system under study and condition the system’s dynamic. When
at all possible, these variables must be considered a priority when considering
1. Influence (I) of a variable as the row sum of values:
strategic plans of action.
n
X
At the intermediate variables (2)Iiare
and highly dependent.
= both
tij (i highly
= 1, 2, . .influential
. , n)
(4.1)
j=1
Thus, they are, by their nature, unstable. Any action taken on these variables will
cascade
throughout the rest of the system, profoundly affecting the system’s
2. Dependence (D) of a variable as the column sum of values:
dynamic.
n
X
Dj =influential
tij (i = 1,but
2, . . .very
, n) dependent. Their behavior
(4.2)
The resultant variables (3) are not
i=1
therefore explains the impacts resulting from other variables, principally input and
intermediate
variables.
Influence versus
dependence chart, as shown in Figure 4.4, can be framed into five categories of
Excluded
variables
(4) are
neither
influential
norin dependent.
Therefore,
theyet have
variables. Those
are based
on the
included
variable’s role
the system’s dynamics
[Arcade
al.,
little
on2010]:
the system under study. Often times these variables simply describe
1999;impact
Lee et al.,
inertial or prevailing trends which change little over time. Other times, these
variables
are simply autonomous, and therefore have little impact on the system.
• (1) Input determinant or “influent” variables - They are very influent and little dependent variExcluding these variables therefore will have few consequences for our analysis.
ables, in which the system mainly depends.
Finally,
there are the
clustered
variables
(5)
congregate
These
• (2) Intermediate
or relay
variables
- They are
at which
the sametend
timeto
very
influent and together.
very dependent,
variables
are not sufficiently influential or dependent to be included among the
and a source of instability, by amplify or forestall an influence to their dependent variables.
• (3) Resultant or depending variables - They are at the same time little influent and very dependent, being especially sensitive to the system evolution of influent variables. They are usually
exit variables of the system.
37
• (4) Excluded or autonomous variables - They are both little influent and dependent, therefore
some how appear quite out of the line with system, and might be excluded in further analysis.
• (5) Clustered variables - They are not well defined in the previously categories, since they have
either an average influence, an average dependence, or both. They are so, variables that usually
behave in a similar way with others, and can be therefore clustered.
AC/UNU Millennium Project
Futures Research Methodology
A final analysis of the influence versus dependence chart can be taken from the variables-points
configuration, as illustrated in Figure 4.5.
Figure 7 : the shape of the system
As illustrated in the chart above, the more the cloud of points spreads along the axis (L
Figure 4.5: Shape of variables-points
configuration as a way to determine the system stability. The more the
shape), the more it can be considered as quite determined (stable). This means that the system's
cloud of points spreads in a L shape, the more it can be considered as quite determined (stable), left configuraanswer (in terms of evolution) to a given impulse of determining variables can be anticipated with a
tion, since system evolution
to a given impulse (given in a input variable) can be anticipated with a certain degree
certainty.spreads along the first bisecting line, the more intermediate variables
of certainty. However, certain
whendegree
the ofcloud
will be important to the system dynamics, introducing, therefore, a level of uncertainty to the anticipation of its
On the other hand,
the cloud spreads Source:
along first bisecting
line,ettheal.
system
can be
evolution based in the input variables,
rightwhen
configuration.
Arcade
[1999]
considered as quite undetermined (unstable). All the more so when the points are located in the
north-east frame. The variable points, characterized by their strong influence and dependence, will
play an ambiguous role in the system. They are factors of uncertainty to anticipate its evolution
according to that of variables considered determining.
Structural Analysis Tool for classification of variables dependence and influence - Indirect
The system of the African country-environment as studied by the "African Futures/NLTPS"
Classification of Variables:
While for a simple DSMs one can easily identify groups of highly reis rather unstable.
lated variables, as one shows in Figure 4.3, in a DSM with a higher number of variables is much
difficult. This analysisStructural
canAnalysis
be performed by DSM clustering techniques [Jain22et al., 1999; Yu et al.,
2009]. To reduce the computation time, one may make use of heuristics as genetic algorithms [Rogers
et al., 2006]. Similar information in system variables indirect relationships can be found, which can be
an alternative to a clustering methodology, Godet [2006] proposes a method to get more information
from the initial DSM as a part of the tool called as MICMAC 1 [Godet and Durance, 2008].
MICMAC uses a matrix calculation of DSM to determine a new level of influence and dependence
of variables (indirect classification), exploring influence paths.The result is a rank of key variables,
as the one obtained in the direct classification. However, quite often, is shown that initial hypothesis
concerning the variables relationships from the direct classification are misleading, lack evidence, or
are ranked with an unexpected dependence or influence [Godet and Durance, 2008]. In MICMAC,
by multiplication of the DSM with itself, a new matrix is created which entails the first order indirect
influences, which for example is an influence of variable A on C via B. Further multiplication of the
new matrix with the original DSM delivers the second order indirect influences (e.g. A on D via
1 MICMAC is the French acronym for Matrix of Crossed Impact Multiplications Applied to a Classification. It is available as a
software, which can be downloaded in http://en.laprospective.fr/methods-of-prospective/softwares/59-micmac.html .
38
C and B) and so on [Eelman, 2006]. In MICMAC, it is also possible to evaluate the result when
considering potentials (P) influences, which are substituted by the higher influence classification,
allowing to compare the influence in calculations.
The MICMAC software starts with the DSM, named as Matrix of Direct Influences (MDI), from
which is calculated a Matrix of Indirect Influences (MII) that allows one to obtain, together with the
MDI: the rank of direct variable influence and dependence, the rank of indirect variable influence and
dependence and also the graph representation of variable-to-variable influence/dependence level,
based either in the direct or in the indirect matrix.
Variables Impact versus Uncertainty Analysis:
Postma and Liebl [2005] proposes the use of
variable or cluster analysis for its “level of impact” (high/low) and on its “level of (un)certainty” (high/low), as one can see in Figure 4.6. However, regarding uncertainty it is important to explore another
field, that is the possibility of occurrence, not addressed neither in Postma and Liebl [2005] or Godet
[2006]. This can be seen as a third dimension on the analysis, allowing one to discard those that must
164
T.J.B.M. Postma, F. Liebl / Technological Forecasting & Social Change 72 (2005) 161–173
not see significant changes
in the future. Those variables, may be uncertain, but are not expected to
have a significant variability, or are associated to rare events with little expression in the system.
Postma and Liebl [2005] only chooses the two most important and most unpredictable (uncertain)
cluster/variables. However, due to the complexity of the problem, the number of selected cluster/variables, the key variables, will only depend in the defined threshold region. A more restrict selection
will result in a higher number of considered variables to scenarios construction, and subsequently a
more complex process, but will comprise a wider range of possible futures. This tool allows exclusion
of the predictable and/or irrelevant variables, reducing the final number of key variables. It is used in
Fig. 1. A possible representation of the process of scenario development [1,15].
parallel with StructuralNote
Analysis.
Final selection is a result of workshop members subjective judgment
that this is essentially the approach proposed by P. Schwartz [13]. By playing out these
uncertainties as if they had occurred, each scenario depicts another future state. In doing so, the
highlight the importance and consequences of these uncertainties. By making
plausible scenario plots or stories [13] and by looking for causal structures, each scenario is filled with
based in both tools indication.
scenarios together
Fig. 2. Scenario construction, adapted from Ref. [17].
Figure 4.6: Scenarios and Strategies resulting in multiple test conditions. For each strategy, multiple s multiple
simulations conditions resulting of the [Postma and Liebl, 2005]
39
4.3
4.3.1
Phase 2 - Scenarios and Strategies
Step Five - Scenarios and Strategies construction
Scenarios and strategies construction is based in the set of key variables identified for the Atomedical problem. On one hand, one must attempt to reduce key scenarios questions uncertainty. For
example, this can be made using a survey of experts opinions regarding prevailing trends, faultlines
or breaks, in order to identify the most probable variables’ behavior. On the other hand, one must help
unit managers considering strategic options for modifying the system in the identified problem. The
procedure of scenario construction is rather subjective, but the use of a set of tools can help decision
maker to better obtain possible future scenarios in which the described system will perform on. Since
this methodology is applied to a more operational context, in opposition to major literature, the focus
of scenarios will not be the events itself, but the result of those events in operation scenarios. Different events may be gathered in a similar behavioral scenario regarding operations, for instance, the
number of patients that reach the unit. Reducing the importance of completely defining of the story
behind scenarios, reduces the need for complex analysis of the unit environment.
In strategy construction, one uses the key variables not considered to scenario construction,
namely those which behavior could be solely changed or influenced by the decision maker. Only
important and predicable variables which behavior decision maker can control are relevant to strategic options, since others will be part of the system model parameters, and will not change in different
scenarios/strategies. Variables with low system importance/impact have low interest since they not
promote significant changes. In spite of the multiple possibilities, is important to look for coherence
in strategic options, looking for compatibility with corporate identity and objectives, as well as, to the
considered scenarios. This allows the reduction of the final set of strategic options to be evaluated
under each scenario.
Morphological Analysis and the Blocks Method:
For scenarios and strategies building, Godet
and Durance [2008] suggests, among other possibilities, the use of morphological analysis, which
use was already documented in multiple case studies (see Godet [2006]). Although it was designed
to be used in technological forecasting, it fits well in complex setups construction. Characterization
of different components could be made with a certain number of possible states, or hypotheses, as a
sort of configurations of the key variables representative possibilities, in the form of blocks. As a tool,
blocks methods allows one to build a scenario/strategy that would be a path, by bringing together a
possible configuration for each component, can be seen in Figure 4.7. Afterwards relevant, coherent
and plausible scenarios/strategies are chosen through morphological analysis.
40
cal analysis for the two classic stages: scenario building and strategic
planning. The first analysis provided development scenarios related to
what would be at stake in the future of corn growing, especially the
technological, economic and regulatory environments of this particular sector. Each scenario asked corngrowers strategic questions which
could have different possible answers. Once again morphological analysis enabled the participants to organize their thinking as a group on
the most relevant and consistent strategic responses.
Relevance, Coherence and Plausibility of Scenario-Building
through Morphological Analysis
? stands for all other possibilities
At least 320 possible scenarios : 4 x 5 x 4 x 4
Figure 7 – The Blocks Method Using Partial Scenarios
(a) Scenarios
Partial
Scenarios
The following scenarios (b)
are created
by dropping
down through each level like a
pachinko ball, though non-adjacent hypotheses may be selected. (see figure 7 below)
Figure 4.7: Scenarios resulting in relevant, coherent and plausible configurations of uncertain key variables
possibilities. The use of the blocks methods is identical in strategies. Source: Godet [2006]
In very complex systems, or a system with the need of a very fine level of analysis, two types of
scenarios are produced [Godet and Durance, 2008]. The first type is partial and built for a subsystem
of variables. As before, a set of hypotheses are determined for each variable and potential combinations defined, as one can see in Figure 4.7(b). The partial scenarios/strategies for each subsystem
are then grouped in the global system block method, in which the different
71 partial possibilities will
be combined in global setups, as illustrated in Figure 4.7(a). This method allows one to reduce the
number of considered scenarios and strategies, either in the subsystem analysis, either in the final
setups, by allowing unit managers focusing in meaningful possibilities to the problem in study, yet
avoiding blind spots in the process.
In this phase is important to systematically stimulate imagination and possibilities field scan. For
each key variable, possible states or options must be determined, using problem analysis and data
trends, decision maker suggestions or literature/experts forecasts. However, one may be swamped
by the various combinations. This reinforce the need for a selection criteria, exclusion or preference
constraints factors, which one can have to choices regarding coherence and enhancement of the
information level [Godet, 2006].
41
4.4
4.4.1
Phase 3 - Study of Strategies and Scenarios
Step Six - Selection of leading indicators and signposts
In order to evaluate the performance of the system in the possible scenarios and strategies configurations, one must identify the leading indicators and signpost of the Atomedical system. These
will allow one to determine the behavior of each strategy under each scenario in the pursue of the
problem objectives. Leading indicators and signposts must be, therefore, relevant to the Atomedical
problem, and allow to directly or indirectly gage the defined objectives parameters set in Step One, in
Section 4.2.1.
4.4.2
Step Seven - Evaluation of Strategies under Scenarios
The proposed final step methodology is to evaluate the strategic options under the different scenarios, for which performance indicators are determined. In this work, due to the type of system
under study, the proposed evaluation is made throughout DES of Atomedical unit model. In order to
use DES, the system must be represented by a model, focusing in the unit operation and including
the key variables under study. The model includes the influences and dependencies between them
and allows to follow and measure the defined leading indicators and signposts. The model must allow
the definition of a set of parameters in order to represent the scenarios and strategies defined before.
For each strategy and scenario, a simulation is made in the defined set of conditions. After the
evaluation, one obtains a set of multiple results for the defined indicators and signposts for each
condition. At this level, in a robust Scenarios Planning methodology, one is able to analyze the results
in order to predict the evolution of the system under different context/scenarios. Scenarios Planning
allows at this level a sort of sensitivity analysis, that provides unit managers additional knowledge
about their unit, and options impacts, supporting eventual decision. It also allows a better preparation
to act accordingly even if scenarios not exactly equal to the ones consider arise in the future. This is
important in Atomedical, since in multi variable problems it is difficult to scenarios and strategies totally
represent real situations. However, in such cases, it is important not to perform a choice of constructed
strategies based directly on the performance results. For instance, in the realization of one scenario,
[Godet, 2006] proposes an optional final approach in strategy decision support using a multicriteria
methodology, which helps one to define the importance of each performance component in the final
decision. The objective of any used method is to correctly weight each component performance in
the pursue of decision maker objectives. However, since the proposed methodology does not aim to
propose future solution as the studied strategies, this approach was not developed during this work.
42
5
Scenarios Planning Phase 1:
Analysis of Atomedical problem
Contents
5.1 Step Two: Problem analysis . . . . . . . . . . . . . . . . . . . . . . . .
5.2 Step Three: Variables in Atomedical problem . . . . . . . . . . . . . .
5.3 Step Four: Systematization and classification of identified variables
ables of the problem . . . . . . . . . . . . . . . . . . . . . . . . . . . .
.
.
.
. . . . . .
. . . . . .
key vari. . . . . .
44
51
54
43
5.1
Step Two: Problem analysis
As the first step in Scenarios Planning, one has already identified the Atomedical problem in
Section 2.4, which supported the development of the used methodology. The second set was the
analysis of the problem. In order to perform it, one followed a set of meetings with the decision
makers and unit visits, where the unit operations were characterized and the problem components
identified. In the result analysis one is focused in the identification of the operation components of the
problem rather in fully describe the unit operation, already addressed in Azevedo [2010].
5.1.1
Analysis of the Atomedical unit operations
Atomedical operations are a system with some complexity. So, in order to present a clear representation, a flow chart of the main unit processes, Figure B.1 in Appendix B, is presented to identify
main processes, existing relations, and possible management interventions on it. Some more specific processes, for instance, for the Myocardial Perfusion exam and RF treatments are not directly
included. To better understand the flow chart, each process is briefly presented and analyzed, using
references to the corresponding flow chart object. This analysis allowed one to find the problem variables that directly result from the unit examination operation. These were not necessarily the same
variables to were addressed in scenarios and strategies.
5.1.1.A
Exam scheduling
Scheduling of patient exam:
Exam scheduling is the first contact that the patient (E.1) has with
Atomedical. This contact occur in Atomedical Reception (R.1). Waiting time until attendance (W.1) is
currently significant short due the number of existing reception staff. Usually the exam is appointed to
the next vacancy, starting in the day after the contact, or available days are suggested in the case of
patient mean a later date.
The exam is scheduled according with the Schedule Plan of the unit, available in the unit informatics management system. Patients have a significant flexibility to the suggest appointment. When the
exam needs some home preparation (for instance come in absolute fast), instructions are given to the
patient by the receptionist at this point. Typically waiting time until the exam (W.2) in shorter than 5
working days. Some exams procedures require the presence of the patient in different days, one for
administer the RF and other for image acquisition (for instance, images with 67 Ga or Metaiodobenzylguanidine (MIBG)), in which two appointments are performed in the same week according the indicated time gap for that specific examination. Some exams, like the Myocardial Perfusion Study (MPS)
need the presence of a cardiologist, so appointments are done in the days/periods they are present
in the clinic.
44
Scheduling plan: Through previous activity data and anticipation of future situations, unit operations are set to address expected demand, either regarding total number of exams, either regarding
each exam type number. Unit managers are able to distribute the exams in the working day, with a
defined exam scheduling plan, used to suggest one existing vacancies. Exams scheduling plan (I.1)
is weekly set, empirically, by the Clinical Director, for a period of 2/3 months, allowing early appointments for later dates by the patients. Scheduling plan must be able to adjust needed resources to
the level of expected demand, considering each exam needed RFs and level of activity. An important
constrain is the unit capacity, defined by the existing equipments and their specific functionalities.
Scheduling plan focus the unit response in the exam that generates more income, which usually
corresponds to the more demanded (currently the MPS is the more significant). Week scheduling plan
must have some flexibility to bear exceptions and unusual occurrences (like emergencies exams). If
necessary, the unit managers may asks staff to perform extra working hours in order to address a
demand peak or unit unexpected delay. This was a frequent procedure in the past, but now it is a
rare situation (occurs only in a case of an equipment failure). Some other occurrences can overcome
the scheduling plan, like a delay of the RFs delivery, long equipment failure, in which cases the often
solution is delaying the exam for a later time (if limitations are not impeditive of exam execution) or
reschedule the exam (if limitations would last long or another equipment could not be used, being so,
impeditive of exam accomplishment).
Scheduling plan time slots are defined in intervals of half an hour, from 9h00 until 17h30/18h00.
For each time slots the Clinical Director defines what types of exams and number of patients are going
to be attended. This way, patients start their exams in half an hour intervals, since multiple exams
can be performed and most of them need previous preparation (for instance RFs administration) after
which the patient may need to wait some time inside (W.4). During this time, other other patients can
be prepared or examined. There is a time window to the image acquisition after RFs administration,
so waiting inside the unit is managed by the staff along with the equipment vacancy (W.5). In order
to sequential administration of the RF of a specific exam, several patient for the same type of exam
are scheduled to the same time slot. Because the extra time needed for children, specific slots
are made available to them. Longer exams are planned for having priority in early morning, and if
possible, in early afternoon. Planning the exam schedule imply adjusting the arrival of new patients
with the needed procedures for each exams and with equipments and staff response capacity in
order to reduce the internal waiting time to the minimal of procedure necessity and increase the total
of number of exams performed, decreasing the costly non working periods of staff and equipments.
Radioactive compounds constraint: The key point of examination is the radionuclide availability and activity. As seen, radionuclide are perishable, therefore, their properties (namely their activity)
decrease with time. So, all unit operation have to address this limitation, scheduling the exams according with the level activity needed. Since each exam needs a certain level of activity, the quantity of
product administrated increase over the time, so the fit between schedule and product delivery mainly
45
influence the quantity of product needed for an equal number of exams.
Purchasing the radionuclides (I.3), done by the unit Clinical Director, must be an efficient process
in order to diminish the unused product (product which lose activity without being used in a patient).
The most important nuclide is the
99m
T c produced by a generator made of
99
M o, which reach the
unit at Saturdays and Wednesdays, so exams that needed more RF activity are performed closer
to the generator arrival. Those that need less activity, like children exams and kidney scintigraphy
are performed in the last days of the generator timespan. Specific radionuclides, like MIBG, are
delivered once a week, as long as ordered until the previous day, so those exams that need them are
performed in the arrival day, which is usually at Tuesday. In emergencies radionuclides are ordered to
the supplier, who deliver them as soon as possible, which may not be always possible.
Currently only 3 production sites in the world are able to produce this radioactive products. Global
shortages of
99m
T c emerged in 2009 because two aging nuclear reactors (NRU and HFR) that pro-
vided about two-thirds of the world’s supply of 99 M o, were shut down repeatedly for extended maintenance periods. This situation originated supply interruption to Atomedical, being in the origin of exam
cancellations. That crisis also resulted in an increase of product price. In present the possibility of occurrence of a similar crisis still exists, as the nuclear reactors continue to get older, and no production
alternatives had become available meanwhile.
5.1.1.B
Patients’ check-in
The check-in is performed also in the Reception (R.2). During it, all necessary data are asked to
the patient (for instance if it is the first time in Atomedical a patient chart is open), and the payment
is done, and arrival information is given to Nuclear Medicine Technicians (NM Technicians). Patients
delays are rare, as the majority reach early to the clinic, and staff can easily overcome them in the
examination process (for instance start an imaging capture of another patient first or increasing the
time inside the internal waiting rooms).
The total waiting time in the unit depends on the type of exam performed, as well as the number
of ongoing appointments (which may increase possible delays). Generally patients are called shortly
after the internal communication of arrival, and are orientated to the specific internal room. In here
they will wait for the exam starting or preparation (W.3). In some occasions priority is given to patients
that have a current equipment vacancy (for instance by another patient delay).
Sometimes patients arrive without an appointment, often channelized from Hospitals or clinics
with emergencies circumstances (E.3). Since this is a predicted situation, scheduling plan already
allows to accommodate some of this occurrence in the same or next day. In this case, other patients
procedures waiting time are adjusted to open vacancies, and causing minimal disturbance.
46
5.1.1.C
Patient preparation
Preparation of RF: Most RFs depend on the Technetium generator. Others are prepared with
different radionuclide. RFs are prepared from the radioactive products previously to the administration (F.6) by NM Technicians (R.3), used to mark the pharmaceutical compounds (often called “Cold
Kits”). This process takes place in the radiopharmacies in the beginning of each working day, and the
prepared RFs are taken to the examination room or passed on to the RF administration room.
Administration of RFs and other pharmaceuticals: The RFs administration (F.5) is performed
by the NM Technicians in the RF administration room, if it is needed some waiting time before the
image acquisition, or directly in the Gamma Camera. In RF treatments only a RF administration is
performed in the RF administration room.
MPS can be performed within a strain situation. Although this could be done inducing physical
strain, as the patients are mainly elderly, Atomedical makes use of pharmaceutical compounds in
order to induce myocardial strain, achieving a more independent result from the patient physical condition. Needed pharmaceuticals are administrated in the MPS room, in the presence of a cardiologist.
Myocardial perfusion image acquisitions are performed in the both conditions.
5.1.1.D
Image acquisition:
Image Acquisition is the main process flow at the unit, which depends on costly equipments (R.5).
Since unit expansion, unite managers report as increase in machine idle time, making hence easier
avoiding delays and dealing with emergencies. Operational costs and specialized staff (R.6) represent
significant cost, so it is important to make the most use of the machinery possible and avoiding nonworking hours. Patients can be taken to any equipment if it satisfy the needs of this exam type.
After image acquisition, the process continues with image pre-processing, which is dependent on
the computational performance equipment. NM Technician verifies the image quality, falling back to
the NM Doctors if needed. If the image is not found to have a good quality, NM Doctors indications
are made to repeat the image acquisition, which increase the exam time, reduces the equipment
vacancies, and in some rare cases can involve a new RF administration, if patient is already out
of the optimal window of activity. Only after NM Doctors image approval the patients can leave the
acquisition room, and the image goes to final processing step.
5.1.1.E
Exam reports:
After image approval, patients can go home (E.4), and a report (E.5) is made by the NM Doctors
(R.8). Usually, exam reports are ready within 3 working days (W.6). In the case of an emergency
exam, it receives priority on the report process. Exam reports are delivered (F.11) in an independent
desk in the reception (R.9).
47
5.1.1.F
Environment context of atomedical unit
Competitors: Competition in the field of Nuclear Medicine is done mainly by price, availability
and quality. Currently, Atomedical is able to offer a good availability of service. Unit managers identify
the main source of competition in other institution that by lowering exam quality offer lower prices,
sometimes getting below the minimal cost value of the service. Currently, in the geographic region
of Atomedical, it does not exist this type of competition, however some private hospitals are potential
competitors by being able to support losses in Nuclear Medicine services, in order to attract clients to
other profitable services.
Regarding the public health system, the agreement price is fixed by public administration, therefore competition is made mainly in quality. However, other agreements exist with corporation and
insurance services, the ability to maintain those agreements is dependent on the prices, hence competitions at this level are very important. Atomedical has been able to maintain prices of these agreements in the past years by reducing cost due to higher service efficiency.
Clients: Atomedical clients are mainly patients intending to perform diagnostic exams or to monitor a health condition. First time patients come to Atomedical largely by doctor recommendation,
based in exam quality. After the first visit, in those patient needing a continuous monitoring, the
choice of Atomedical becomes essentially patients decision, based in service quality in previously
visits. Clients composition is a mixture of first time patients and frequent patients.
The main variables that influence the number of clients are the exam price, service quality and
prestige among clients and doctors and finally availability to clients needs. Current decrease of clients
in Atomedical is identified with the price variable. This influence is not due to price competition, but
reduction of patients forwarded by public hospitals, as seen before.
5.1.2
Identifying influential variables in problem objectives
System analysis must also focus in the problem objectives, to identify variables that influence
them, since many of them do not reside in the unit operation but in its context. In Chapter 2, the
problem is defined, as well as, the objectives that decision makers aim to achieve. Therefore, those
objectives should be the focus of the identification of problem variables, in step three of the first phase
of Scenarios Planning methodology. In order to finish problem analysis, one had to understand the
contributions to the objectives of reducing operating cost and maintain or improve the defined current
service quality, which can be done using cause and effect diagrams. The called “Fishbone” was
used to the operational cost, Figure 5.1. Since exam quality and patient waiting time are the core
contributors of the service quality, a process-type analysis, based in the core flow processes of Figure
B.1 in Appendix B, was used for patient waiting time, Figure 5.2 and exam quality, Figure 5.3.
48
Equipment!
People!
Unit Staff!
Equipment Maintenance!
Equipment Acquisition!
Equipment Repairs!
Number!
Staff Training!
Equipment Calibration!
Working Hours!
Facility Maintenance!
Extra Working Hours!
Administrative Staff!
99mTc
Radionuclide Generator!
Purchasing and Delivery Costs!
Other supplies!
Material Manipulation!
Unused Decayed Product!
Individual Doses of other Radionuclide!
Purchasing and Delivery Costs!
Unused Decayed Product!
Pharmaceutical Compounds – “Cold Kits””!
Spoiled Material!
Patient Preparation!
Radiopharmaceutical patient dose!
Image Acquisition!
Capture of New Images!
Delivery Costs!
Materials!
Operational
Costs!
Methods!
Figure 5.1: “Fishbone" cause-effect diagram for the operational costs.
Figure 5.1 presents the main sources of operational costs at Atomedical. These sources are divided into people, equipment, materials and methods. Since Atomedical provides services, people
is one of the major contributor to the operational costs. On one hand is important to take into account costs with training staff and unit administrative support staff. On other hand, the cost with unit
staff are dependent of their number, the number of hours they work (since some work also in other
places) and finally extra working hours, used in the case of service delays as previous stated. No
direct cost was associated to the Atomedical unit environment, but revenues are highly dependent of
it, namely due to competitions and the established agreements. Equipments are also a major source
of cost, namely: equipment acquisition, outside of this problem; the maintenance and repairs, either
by the vendor, either by NM Technicians in the daily calibration performed in the beginning of each
working day; and finally the common facility maintenance costs. Regarding materials/products, the
99m
T c generator, individual doses of other radionuclides and pharmaceutical compounds purchasing
and delivery costs represent a significant cost to the unit. The costs can be addressed managing
stock, by balancing high quantity price discount versus unused decayed product. Namely in the pharmaceutical compounds, with usually 6 months of life. Finally, the cost in flaw proceedings, either in
material manipulation resulting in spoiled material, either in patient preparation, due to higher quantities needed to achieve the desired doses, either in the need to repeat the image acquisition process,
will result in the accumulation over time of significant operation costs.
A qualitative analysis of Figure 5.1 points the main cost sources of Atomedical operation. Equipment and Methods are considered by unit managers efficiently optimized. Therefore, a unit cost
reduction can be possibly tackled through optimizations of the use of RFs products, reducing the
unused product and minimizing the deliveries needed, a better usage of the diagnostic equipment,
decreasing the non-working time, and human resources, setting the staff in an efficient match to the
49
demand. The profit objective also depends on the type of exam, so giving priority to exam with higher
margins of profit should be also a way to achieve the objective.
Radiopharmaceuticals
Preparation!
Reception Workload!
Type of Delivery!
Equipment Performance!
Room Availability!
Schedule Availability!
Report Priority!
Previous Scheduled
Exam Delays or retakes!
Patient Availability!
Exam Procedures!
NM Technician Workload!
F.1!
F.2!
F.5!
F.7!
F.8!
Schedule
Exam!
Check-In!
Patient
Preparation!
Image
Acquisition!
Image Processing F.11!
F.10!
Medical!
Report!
Medical!
Report!
Delivery!
Waiting!
Time!
NM Technician Workload!
Reception Workload!
Patient Earliness or Delay!
Emergency Patients!
Equipment Availability!
Equipment Malfunction!
New Images Acquisition!
NM Doctor Workload!
Exam Type and Quality!
Image Complexity!
Figure 5.2: Process-type cause-effect diagram for the total patient waiting time since the initial contact until the
report delivery. Highlighted variables can be address by unit managers. Processes are based in the main flow of
Figure B.1 in Appendix B.
Figure 5.2 connects each unit flow process to possible contributions to an increase to waiting
time. Patient total considered waiting time begins in the exam schedule and ends in the exam report
delivery, and is a result of the time spent in the identified processes, as well the time spent in the
waiting queues (W.#) pointed in Figure B.1 in Appendix B, which result mainly from patients not being
able to move to the next process, due to lack of availability of the needed resources. It is important
to take into account the expected waiting time, due to medical procedure in normal situations and the
process delays due to unit operation. The resources limitation may be of staff, due the high level of
workload, or of equipments, due lack of availability or malfunctions. The type of exam and complexity
also determines the duration of the process, and may origin possible delays either in examination
procedure, either during medical reporting (patients with emergency situation are given priority in
report production).
From the analysis of Figure 5.2 one can identify delaying causes that are independent of the unit,
therefore from the unit manager intervention, and causes that can be changed as a result of unit
manager interventions (highlighted variables).
50
Radiopharmaceuticals
Preparation Quality!
Exam Pre-Requisites
Patient Information!
Data Quality!
Mismatch Report Delivery!
Software Functionalities!
Exam Procedures
Fulfillment!
F.1!
F.2!
F.5!
F.7!
F.8!
Schedule
Exam!
Check-In!
Patient
Preparation!
Image
Acquisition!
Image&
Processing&
Exam Pre-Requisites
Fulfillment!
F.11!
F.10!
Medical!
Report!
Medical!
Report!
Delivery!
Exam
Quality!
Radiopharmaceuticals
Suited Radioactive Activity !
Image Retake Possibility!
NM Technicians Experience
and Performance !
NM Doctor Experience!
Image Complexity!
Previous Image Approval!
Equipment Malfunctions!
Figure 5.3: Process-Type Cause-Effect Diagram for the Exam Quality. Processes are based in the main flow of
Figure B.1 in Appendix B.
Figure 5.3 analysis allows one to conclude that exam quality is mainly a result of the fulfillment
of exam procedure (however it is not a common situation), as well as from the equipment and staff
performance. The management of the needed RF activity, dependent of the optimal exam period is
performed changing the administrated quantity. A succession of events in the overall process can
cause image quality reduction. Some of them could only be downplayed, like equipment failures,
and procedures have to be able to detect errors and correct them. Unit managers pointed that exam
quality is related to the ability to perform good diagnosis reports based in good images. This may
require extra time in the procedure, for instance, due to the need of getting statistical significance of
the acquisition of photons, which increases the time in lower levels of activity, or in the case image
acquisition has to be repeated, in order to obtain a better image. Lack of time to staff perform correctly
their tasks was also pointed as a significant cause of failures. Since service quality is an objective,
forsake experienced staff or reducing equipment maintenance or products quality were not considered
as options for this problem.
5.2
Step Three: Variables in Atomedical problem
The system analysis performed in previous sections is important either to support the construction
of the DES model of Atomedical in Chapter 7, either to support the identification of system variables
to be considered, and study, in the following Scenarios Planning methodology. In this third step of the
methodology, a set of operational and environment context variables were drawn from the previous
problem analysis and presented to decision makers, related to different domains of the problem. They
were discussed and reviewed in order to describe the sources of variability and the level of control,
regarding Atomedical problem. The variables in the remaining of this section are identified by an index
51
number in the text to ease the reference to Table B.1, on Appendix B, where they are systematized
and described. Problem analysis support the identification of the variables related with the problem
objective, and was around them that this methodology variables were drawn, following the categories
presented in Figures 5.1, 5.2 and 5.3: People, Equipment, Materials and Products, Methods and
Procedures, Unit Environment and Unit performance.
5.2.1
People
The role of People in Atomedical operations has a great importance, since staff is its major cost,
and is closely attached to the unit operations, while patients are the core of the service. Regarding
the staff, one identified some variables related with the allocation and scheduling of staff, and their
relation with planned capacity and demand: # 1 Number of Administrative Staff, #2 Schedule - Number
of unit staff, # 3 Schedule - Unit staff working hours and # 4 Schedule - Extra working hours of
unit staff. Staff workload variables are a representation of how capacity fits to demand, so one has
to consider the limitations to operations of a demand higher than capacity, and the costs of staff
idle time: #5 Reception Staff Workload, #6 Nuclear Medicine Technicians workload and #7 Nuclear
Medicine Doctor workload. Staff workload is also a result of how patient arrival is planned (and
how it occurs): #8 Patients scheduling and #9 Patients scheduling. Other variables in this domain
contribute to changes in the planning and flow of operations, such as: #10 Staff assiduity, #11 Lack
of prerequisites fulfillment by patients and #12 Exams not performed due patient. A final variable that
contributes to the unit operation work flow is: #13 Nuclear Medicine Technicians experience.
5.2.2
Equipment
Another important domain regards unit equipments, since they are essential in all exams, and
represent a significant investment and maintenance cost. #14 Equipment malfunction may contribute
to errors in the obtaining of images, and examination delays. The capacity of the unit can be reduced
because the need of #15 Equipment repairs, that can be prevented with a regular maintenance, therefore a relevant variable is the #16 Frequency of equipment Maintenance. Managers may address a
central variable: #17 Number of equipments. The number of equipments available to exams has a
contribution to the #19 Equipment workload. Malfunctions of equipment and image quality are dependent of a convenient #18 Equipment calibration, by the unit staff previous to opening. Examination
time is also in the dependency of the #20 Image processing equipment performance.
5.2.3
Materials and products
Products and materials used are other important domain in Nuclear Medicine. They are expensive,
and most have a few number of providers, that introduces relevant concerns about its availability (#21
Technetium generator availability, #25 Other radionuclides availability and #29 “Cold Kits” availability )
52
and cost (#22 Technetium generator cost, #26 Other radionuclides cost and #30 “Cold Kits" cost). The
delivery frequency (#23 Technetium generator delivery frequency, #27 Other radionuclides delivery
frequency and #31 “Cold Kits"s delivery frequency ) need to be articulated with the products expected
life, and consider the delivery costs (#24 Technetium generator delivery cost, #28 Other radionuclides
delivery cost and #32 “Cold Kits" Delivery Cost). The quantity of product bought in each delivery can
possible reduce the price of each unit (#33 Quantity of Technetium Generators bought, #34 Quantity
of other radionuclides bought and #35 Quantity of “Cold Kits" bought), but increases possible losses
of unused product (#36 Unused technetium, #37 Unused radionuclides and #38 Unused “Cold Kits").
5.2.4
Methods and procedures
The unit operations are the result of the used methods and procedures that articulates the available staff, equipments, products and materials to address patient needs and demand. Even using
standard protocols, some aspects may be relevant to the final unit performance. Extra procedures
costs may arise from: #39 Used product in each exam/treatment or #40 Product spoiled during preparation. In some cases, an image has to be retaken, with additional spending of time, or even product
costs, so one should be aware of the number of #41 Image retake. #42 Priority reports also induce
a disruption in normal reporting operations. The #43 Exam reporting duration is a relevant variable,
since is may lead to report delivery delays or costly idle time, because each patient has a specificity.
It is related to the NM Doctor experience and the #44 Report complexity.
One variable with a contribution to the core cost of the exam is #45 Exam duration. In standard
protocols, one can use different procedures, that lead to reduction or increase of the duration. Exam
procedure is dependent of the patient RF bioactivity, since less activity results in a longer exam.
However, even with an excepted activity, RF bioactivity inside the patient can fail to follow the expectation due to #46 Biologic reactions or #47 Staff error. Other costs in procedure are related with the
staff allocation in product and equipment preparation: #49 Duration of equipment calibration and #50
Duration of radiopharmaceutical compounds preparation.
Managers can reduce costs by reducing unit capacity or adjusting the scheduling plan, changing
this way the #48 Schedule availability of exams to patients. Due to the operation scale factors regarding the use of products, the #51 Number of examinations performed in the unit can be, for instance,
focused in the more lucrative exams and adjust the schedule more profitable setups.
5.2.5
Unit environment
Atomedical unit operations can never be separated from its environment context. It mainly influence the demand, number of patients looking for Atomedical service, and the revenue, dependent of
the prices that Atomedical can or need to practice for each examination. Regarding environment, one
must take into account competition, namely: #52 Number of competitors, #53 Price of competitors
53
service and #54 Quality of competitors service. Based in the positioning of the unit among competitors, one is able to understand #55 Atomedical unit reputation and the effects in the #58 Number of
patients per exam and performed prices.
Another important environment analysis is related to how people reach Atomedical. Unit reputation
is the main source of affluence, supported by the existing agreements, by which the majority of the
people come to the unit. Therefore, the #57 Number of agreements and established #59 Price of
exams in agreements influence the potential number of patients and revenue. However, some may
come independently, which usually represent a higher profit, so the #62 Number of standalone exams
needs to be considered. Revenue is also dependent of the major agreement of Atomedical, the
National Health System, since it defines the #61 Price of the exams. Demand is highly affected by
the #60 Number of asked exams in National Health Care System. It can be reduced due to economic
factors, or alternative examinations, for instance the use of non radioactive methods in children, which
look Nuclear Medicine namely for renograms. The number of #56 Emergency patients is also an
environment variable that may contributes to disruptive situations to planned Atomedical operations
and extra costs.
5.2.6
Unit performance
Although the multivariability of Atomedical unit performance, managers can set specific level of
performances addressing part of the presented variables. #63 Atomedical Service Quality, #64 Exam
Quality and #65 Patient Waiting Time in Unit have a direct relation with the internal variables, and also,
an indirect relation with the system inputs. Revenues are related with the examinations performed,
and one the level of the #66 Atomedical operations costs allows one to fully characterize the unit
profit.
5.3
Step Four: Systematization and classification of identified
variables - key variables of the problem
A system is described not only by its components, but also by the relationships between them. In
this work, one is looking to identify a set of variables of interest of being used in the formulation of
scenarios and strategies. This set of variables corresponds to key variables, isolated by their impact
in the system, level of uncertainty and independence. To fully characterize them, one must establish
the relations between different variables, and determine those criteria for each variable. In order to
accomplish this, in step four of Scenarios Planning, it was used the tools available in the MICMAC
software to classify variables regarding their influence and dependency, as proposed by Godet [2006],
together with a complementary impact vs uncertainty analysis tool, as proposed in Postma and Liebl
[2005].
54
5.3.1
Direct classification of variables - Dependency Structure Matrix using
MICMAC
In MICMAC, the variables are identified by the same index used in previous section. In order to
establish the relationships among variables, Atomedical unit managers were asked to fill in a DSM of
all the identified variables. For each variable, by looking row by row, they were asked to give a value
corresponding to that variable level of influence in the remaining, listed the in the columns. The level
values used were: none influence (0), low influence (1), high influence (2). No intermediate level was
considered in order to reduce the subjectivity of the classification. This option represents a decrease
of the level of detail of further DSM analysis. However, it reduces the subjectivity by compelling the
choice of a high or low level of influence, helpful in the resulting matrix size (66x66). Another possible
value to the level of influence was a potential one (P), but unit managers did not identify none among
relationship variables, so it was not considered.
MICMAC received the variables, and the relationships expressed in the DSM. The result was a
visualization of those relations, with the direct level of total influence/dependence of each variables in
the systems, as stated in the Equations 4.1 and 4.2. A variable has a greater influence as it directly
influence more variables, and that level of influence is higher. The opposite happens with a variable
with high dependence, as a result of direct dependence of a greater number of variables, with a high
level. Figure 5.4 allows one to visualize the results, in which, variables are represented in an influence
versus dependence plan.
Figure 5.4: Plan of direct influence versus dependence of Atomedical system variables using MICMAC. Level of
influence is represented in the y-axis and the level of dependence in the x-axis.
55
Identification of possible key variables in Figure 5.4 regards variables with a high influence, and
low dependence. Those are the system inputs, on which system mainly depends. The behavior of
variables with a high dependence should be described by the behavior of others. With low influence
and low dependence are autonomous variables. One cannot identify or exclude them as key variables
with this tool, but they are candidates to be excluded in further analysis if not shown to be important
to the system. Finally, variables with low influence and high dependence are usually the outputs of
the system, and good candidates to be considered signposts. Figure 5.5 provided a more clear view
of the direct relations between the individual variables using a graph of the direct DSM.
Figure 5.5: Graph of direct influence of some Atomedical system variables using MICMAC. Not all variables
and influences are shown, since a level of zoom of 25% was applied, in order to provide a neat representation
to decision makers, given the high number of variables in question. Red line represent high levels of influence
(classified with 2), while dot lines represent low level of influence (classified with 1).
Due to the used threshold, only the most significant variables are represented in Figure 5.5. It is
possible to, qualitatively, identify some variables that are the focus of others influence: #51 Number
of examinations performed in the unit, #58 Number of patients per exam, #64 Exam Quality, #60
Number of asked exams in National Health Care System, #63 Atomedical Service Quality and #66
Atomedical operations costs. It is also possible to identify variables source of influence: #14 Equipment malfunction, #15 Equipment repairs and #49 Duration of equipment calibration. This provides a
better understanding of the pointed relations in DSM, so, if necessary, correct the values in order to
better characterize the system. In this case, results were validated by decision makers.
56
5.3.2
Indirect classification of variables - Dependency Structure Matrix using
MICMAC
Direct level of influence/dependence do not allow one to see more than one level of relationships.
Therefore, the previous analysis failed in the identification of several variables that intuitively have
great influence or dependence in the system. MICMAC allows to explore results of indirect level of influence/dependence. They provide a deeper analysis of the system variable relationships, which can
be complemented by a comparison with the direct results. To obtain indirect levels of influence/dependence among variables, MICMAC software uses a matrix calculation of DSM. The number of
iterations used depend on the size of the DSM matrix, in order to allow one to explore all the possible
levels of influence. The suggested number by MICMAC to the provided DSM was 7 iterations, but
after 3 all the path were already explored, as a result of shallow relationships. To understand the
differences between direct and indirect variables classifications, Figure 5.6 provides one the influence
rank in the direct and indirect classification of variables. One can see how some variables become
more influential when considering all their influence path in an indirect classification.
Figure 5.6: Compared classification of variables influence in direct (left) and indirect (right) classification using
MICMAC. Variables that become less influential have a red line to their new classifications, while a green line
indicates new classification of variables that become more influential in the indirect analysis.
In indirect classification, similar representations were drawn to those in direct consideration. Figure
5.7 shows variables positions in the influence versus dependence plan in indirect classification. Notice
that DSM calculations amplifies the differences of influence/dependence levels between variables.
MICMAC results allows one to identify the system inputs, having a high level of influence, and a low
dependency, and system outputs, having a low level of influence and a high dependency. The results
57
were analyzed with decision managers, and was observed that many influential/dependent variables
were beneath the average lines of classification (similar in the direct classification results). Some
variables present higher values, due to deeply description of some system parts, given the existing
subjectivity of the in variables identification. Therefore, it was decided to also classify variables as
influential or dependent after a reasonable lower threshold. Classification was in the end reviewed by
unit managers, that provide the final sets of key variables.
The thresholds where empirically defined after finding a level where variables start becoming
really less influential/dependent. Those identified as having a high level of influence in the system
were marked in red, and those having a high level of dependence were marked in blue, in the Figures
5.7 and 5.8. Some variables show mixed behaviors, while both the levels of influence/dependence
show to be significant to the system. The performed identification is systematized in Table B.1 in
Appendix B, where variables are either classified as influential, dependent, and neutral, if no relevant
behavior.
Figure 5.7: Plan of indirect influence versus dependence of Atomedical problem variables using MICMAC. Manually, variables marked in red were identified as system inputs, with a predominant level of influence, while those
marked in blue are system outputs, with a predominant level of dependence. For this purpose, a threshold on
the level of influence/dependence was considered.
In a similar way to the analysis of the direct classification results in MICMAC, a graph of some of
the indirect relations between variables was provided to support the analysis, as shown in Figure 5.8.
It provides one individual paths, instead of a global classification of the indirect influential/dependence
level. This helped the analysis of results in Figure 5.7, showing that indeed, those variables beneath
the average line had a predominant influence in the other variables, for instance, in the case of #17
Number of equipments, #60 Number of asked exams in National Health Care System or #53 Price of
competitors service.
58
Figure 5.8: Graph of indirect influence of some Atomedical problem variables using MICMAC. Not all variables
and influences are shown, since a level of zoom of 25% was applied, in order to provide a neat representation
to decision makers, given the high number of variables in question. Variables marked in red were identified
as system inputs, with a predominant level of influence, while those marked in blue are system outputs, with
a predominant level of dependence. Numbers on the side of lines represent non normalized level of influence
between those variables, taking into account the full path of influence to other variables.
With the use of MICMAC tool, decision managers were able to evaluate the level of independence
of the identified variables, and understand clearly how the systems variables influence each others.
Many times, due to system complexity, and to the high number of variables, it is not notorious without
the help of tools like MICMAC software. The results of indirect analysis were used to identify key variables at the expenses of the direct ones. At this level, one still lacks in the variables characterization
of impact in the system and level of uncertainty in order to fully identify the key problem variables.
5.3.3
Impact versus Uncertainty Analysis
To perform an impact and uncertainty analysis, as proposed by Postma and Liebl [2005], one
needs to evaluate the level of system impact/importance of each variable and also the level of knowledge/control by the unit managers. In order to accomplish this, unit managers were asked to classify
each variable according to the level of importance/impact in the system, and to the level of knowledge/control they had.
59
Prof. Dr. Fernando Godinho work is more focused on the management level of the unit, and Dr.ª
Guilhermina Cantinho work is more focused on the unit operational level. Therefore, both were asked
to separately classify the set of variables, allowing one to compare their different perceptions of the
unit operations. The results of each classification are shown in Figures 5.9 and 5.10. In Figure 5.10,
the different variables classifications, regarding the ones presented in Figure 5.9, were highlighted
in green, and arranged in the lower half of each classification box. Results were represented in
a discrete plan of impact/importance versus certainty/control, with several variables having similar
classifications.
Level of Impact/Importance
(1- Low, 5- High)!
5!
2!
17!
18!
37!
39!
54!
55!
63!
33!
45!
49!
20!
60!
66!
29!
47!
14!
23!
51!
53!
6!
22!
61!
65!
38!
40!
21!
42!
43!
58!
11!
25!
52!
64!
3!
4!
8!
62!
1!
30!
36!
50!
57!
10!
12!
15!
56!
59!
13!
34!
35!
19!
31!
41!
7!
16!
32!
48!
5!
9!
26!
27!
24!
4!
#!
1 – Not Excepted/
Rare!
#!
5 – Highly
Possible/Frequent!
#!
NA – Not
Applicable!
44!
3!
28!
Level of
Possibility/
Frequency!
46!
2!
1!
1!
2!
Level of Certainty/Control
3!
4!
5!
(1-Known or Controllable 5-Unknown or Uncontrollable)!
Figure 5.9: Plan of level of impact/importance versus level of certainty/control of Atomedical problem variables in
a management vision of the unit. Also the level of possibility/frequency of uncontrollable variables are illustrated
using a gray scale.
Some changes in a variable may have great importance, but represent rare events, thus, influencing little large periods of unit operations. So, for those variables that are not controllable by the
managers, unit managers were asked to classify them regarding the level of possibility/frequency of
significant variable changes, either if it is uncertain or known. For instance, a patient not being able
to perform an exam due to the lack of pre-requesites fulfillment is an uncertainty and can have a
great impact in operations, however, being a rare event with low chance of change in the future, the
60
variable#11 Lack of prerequisites fulfillment by patients does not represent an interesting problem key
variable, since it is not significantly relevant to Atomedical unit operations. The used classification
was from Not Excepted/Rare (1) to Highly Possible/Frequent (5), in a similar scale to other evaluated
criteria. An indication of Not Applicable (NA) was used in the controllable variables. Each classification result was also included in the Figures 5.9 and 5.10 using an increasing gray scale of background
in each variable representation.
Level of Impact/Importance (1- Low, 5- High)!
5!
47!
66!
2!
17!
18!
39!
63!
64!
20!
62!
61!
50!
23!
33!
34!
35!
14!
38!
21!
42!
60!
45!
55!
10!
36!
51!
3!
59!
37!
43!
44!
65!
22!
29!
30!
53!
Level of
Possibility/
Frequency!
6!
4!
11!
16!
19!
41!
8!
12!
58!
7!
54!
57!
1!
48!
56!
4!
15!
5!
9!
27!
40!
26!
31!
52!
#!
1 – Not Excepted/
Rare!
#!
5 – Highly
Possible/Frequent!
#!
NA – Not
Applicable!
3!
49!
24!
28!
25!
32!
46!
2!
13!
1!
1!
2!
3!
4!
5!
Level of Certainty/Control (1-Known or Controllable 5-Unknown or Uncontrollable)!
Figure 5.10: Plan of level of impact/importance versus level of certainty/control of Atomedical problem variables
in a operational vision of the unit. Also the level of possibility/frequency of uncontrollable variables are illustrated
using a gray scale.
Most differences are mainly insignificant, representing mostly a shift in the perception of scale.
Although, some of the variables’ classification do not agree at all, such as, #11 Lack of prerequisites
fulfillment by patients or #61 Price of the exams. One can use this mismatch to validate the classification, since, some times it represents miss identifications of importance or frequency by one of the
persons.
61
5.3.4
Key Variables
Variables identification was complemented with system analysis, as systematized with the tools
used. Those results were assembled in Table B.1 in Appendix B. Unit managers were asked to provide a final classification and identification of the key variables. They can be either associated to
scenarios, if representing a system uncertainty, or be either associated to strategies, if representing a
controllable system variable. Unit managers were also asked to classify variables of interest of being
considered signpost. While influence and dependence classification was based solely in one contribution, impact/importance, control/certainty and possibility/frequency classifications had two distinct
visions contributions, which provided higher information to the problem. System and problem analysis, besides assist unit managers’ classification of variables, provide a deeper insight of the problem,
preparing them to the next phases.
Methodology tools and their results aimed only to assist this classification. Unit managers had the
final word when choosing what were the key variables and those that should stop being considered
at this point. Therefore, some final classifications may not fully follow previous descriptions, since it
was defined that complementary results information do not suit the real importance of the variable to
further problem analysis. During the classification process, some of the chosen strategic variables
presented also a high dependence. That was despite the possibility of control by unit managers,
they may act in response to other variables changes, like staff scheduling may respond to changes
in the number of incoming patients. This is a difficult distinction to make directly in the MICMAC
tools results, since identified strategic variables in such cases show also to highly dependent, such
as #2 Schedule - Number of unit staff or #8 Patients scheduling. In signpost identifications, some
are characterized as being controllable, but are the result of the control of other variables. This
misidentification was considered to be correct in classifying some signposts, such in the case of staff
workload: # 4 Schedule - Extra working hours of unit staff, #5 Reception Staff Workload and #6
Nuclear Medicine Technicians workload. The result of this classification is expressed in Table B.1 in
Appendix B.
62
6
Scenarios Planning Phase 2:
Atomedical Scenarios and Strategies
Contents
6.1
6.2
6.3
6.4
Step Five: Scenarios constructions for the Atomedical problem
Step Five: Strategies in the Atomedical problem . . . . . . . . .
Step Six: Signposts for the Atomedical problem . . . . . . . . .
Scenarios and strategies in the Atomedical problem . . . . . . .
.
.
.
.
.
.
.
.
.
.
.
.
.
.
.
.
.
.
.
.
.
.
.
.
.
.
.
.
.
.
.
.
.
.
.
.
.
.
.
.
64
68
71
72
63
6.1
Step Five: Scenarios constructions for the Atomedical problem
Construction of Scenarios for the Atomedical problem is based in the scenarios key variables
identified in Chapter 5. Methodology framework suggests the use of morphological analysis such as
block method to the multiple options. This methodology aims to reduce to a group of meaningful,
coherent and broad enough final scenarios. These tools were used to help unit managers to analyze
variables and establish the scenarios to be studied.
Blocks method suggest gathering variables within subsystems. Those subsystems can be drawn
from the system components of Atomedical operations, represented in the process flow chart of Figure B.1 in Appendix B. It identifies main system components that may be used to group the variables,
based in component that they influence or are associated. Scenarios are connected to those components where management cannot intervene, and some level of uncertainties may arise, namely inputs
and processes or tasks. Therefore, given previous key variables, one can separate them into systems
components as suggested in Table 6.1.
Table 6.1: Scenarios key variables separation into Atomedical unit subsystems. Subsystems are driven of
systems flow chart of Figure B.1 in Appendix B, representing system inputs or tasks where key variables uncertainties is expressed.
E.1 - Patient Looking for Exam
# 52 Number of Competitors
# 55 Atomedical Unit Reputation
# 57 Number of Agreements
# 58 Number of Patients per Exam
# 60 Number of asked exams in National Health Care System
E.3 - Emergency Patient
# 56 Emergency Patients
F.5 - Patient Preparation
# 21 Technetium Generator Availability
# 25 Other Radionuclides Availability
# 29 “Cold Kits" Availability
F.7 - Image Acquisition
# 15 Equipment Repairs
F.9 - Need new image?
# 14 Equipment Malfunction
F.10 - Medical Reporting
# 42 Priority Reports
# 43 Exam Reporting Duration
# 44 Report Complexity
Others variables remain since they are not directly associated with the unit processes. They influence at a financial level, being connected to the costs and revenues of the performed exams. Because
the scenario construction is aimed to be used in a simulation model, regarding unit operations, the
influence of these variables may be inferred outside model simulation, in a post analysis of the resulting data of exams performed, and resources used. Those variables can be separated by Operational
Costs (# 22 Technetium Generator Cost, # 26 Other Radionuclides Cost and # 30 “Cold Kits" Cost)
and Unit Revenues (# 53 Price of Competitors Service, # 61 Price of exams of National Health Care
System and # 62 Number of standalone exams).
Scenarios Planning is not a forecasting tools, therefore, scenarios do not represent all possible
unit future conditions, neither all possible evolutions. The objective is to identify scenarios that could
represent future challenges to unit managers. Thus, helping their preparation by identifying impacts
64
in the system, and suggesting overcoming strategies. Evaluating those strategies in the different
scenarios brings more knowledge to prepare unit manager to the future. In this work, scenarios are
focused in operations. So, rather than explore the possible events, this exploration of scenarios focus
in the events impacts on the considered scenario variables and the attached result in unit operations.
Therefore, instead of drawing a storyline for scenario variables as a final result, the variables uncertainties are analyzed so that scenarios considerations focus in the effects in operations, even if they
are a common result to distinct events. Following the morphological analysis with unit managers, one
analyzed each group of variables, to suggest possible futures of interest. The resulting variations
in the inputs of the unit subsystem are then drawn as partial scenarios. Further analysis allows to
exclude scenarios that do not represent relevant changes for the study problem.
6.1.1
Subsystems Scenarios analysis
E.1 - Patient Looking for Exam: It is important to analyze how the system inputs are influenced
by different scenarios regarding the number of patients coming to Atomedical.
In competition, one has #52 Number of Competitors and #55 Atomedical Unit Reputation. While
an increase in the number of competitors might decrease the incoming patients, the unit reputation
(service quality and price) is important in the reduction of it. Although it is not excepted new competitors, big players, as big private health care companies, may in the future increase their capacity and
offer. Regarding #57 Number of Agreements, the total and size of agreements with health systems
influence the number of potential clients. National Health System is the source of the majority of the
patients. However, due to recent constraints in the situation of national economy, unit managers noticed a decrease of the number of exams required by doctors, as they are asked to undertake more
saving concerns in their practice. This results in a reduction of the #60 Number of asked exams in
National Health Care System. #58 Number of Patients per Exam represents a variation in the number
of patients per exam. On one hand, this reduction is constant for all exams, due to the general environment of Atomedical. On the other hand, patient per exam distribution may also change, through
a variation in specific exams. Since Nuclear Medicine exams expose patients to radiation, children
exams are being substituted by other technologies, as they face more risk in exposure to radioactivity.
In sum, it exists the possibility of a change of the number and distribution of patients per exam,
to be considered in the construction of partial scenarios by unit managers. The operation of 2009,
already in current machinery setup, is a representation of full capacity operation. This represents a
optimal scenario of a future comeback from current patient decrease. In the opposite, the environment
can represent a stabilization of the number of patients, or a continuous decrease to drastic values if
the environment context further deteriorates. As a major system input, a study of step evolution allows
to perform a sensitive analysis on this variable [Chetouane et al., 2012].
The distribution of number of exams is not significant in operations, despite the reduction in children renograms. However, bone studies had seen a greater reduction than the other exams with no
65
visible explanation, starting from August 2011. e is an interest to understand the impact of further
reductions.
E.3 - Emergency Patient:
# 56 Emergency patients in Atomedical are patients for whom a exam
was asked in short notice. Atomedical schedule those exams even if the normal scheduling is full.
The number of emergency patients is unpredictable, but, by the unit experience, it is correlated with
the total number of patients. However, despite the impact in operations, they are flexible and have a
low frequency of occurrence resulting in low perturbations. Therefore, no scenario was considered
here.
F.5 - Patient Preparation: # 21 Technetium Generator Availability, # 25 Other Radionuclides
Availability and # 29 “Cold Kits" Availability may affect patient preparation. Nuclear Medicine units
are dependant on a short number of suppliers, and in the past the availability of technetium generator
suffered already from shortage. For possible disruption of product supply, if it does not comprise the
operation, the only consequence may be an increase of the product costs. In an extreme scenario,
the unit will not be able to perform exams. However, the consequences are easily predicted and there
is no interest to study in this approach a drastic scenario of unit stoppage. The impact of an increase
of product cost may be considered in a system financial analysis.
F.7 - Image Acquisition:
The Gamma Camera have a central role in unit operations. For in-
stance, lowering the level of maintenance may result in an increase need of # 15 Equipment repairs,
reducing unit capacity. Due to the existence of three full Gamma Cameras, a repair is easily managed. However, in the reduction of the equipments, the impact of stoppages becomes needs to be
evaluated. One may also study the impact of an increase in the number of repairs needed, currently
negligible.
F.9 - Need new image?:
Image quality is guaranteed, since acquisition is made until significance
in the result. However, lack of equipment maintenance can result in # 14 Equipment malfunction, and
in poor image which results in new images being taken. This is usually made while the patient is still
inside the examination room, so one can consider an increase of the duration of each procedure.
F.10 - Medical Reporting:
# 43 Exam reporting duration influence the time for patients to receive
the medical report. This variable depends on the experience of the NM Doctors and on the # 44
Report complexity, since each exam has its own specificities. The # 42 Priority reports, that are
produced first than previous exams, may also delay other reports. However, the impact of an increase
in the report production average time can be directly obtained. Evaluation results can be used to
determine if NM Doctors are enough in different procurements, and to study the impact in reporting
66
time variations. Therefore, it does not represent an interesting scenario, since can be inferred from
other data.
6.1.2
Scenarios
Previous analysis of subsystem scenarios allowed unit managers to engage in the construction
of scenarios for the Atomedical unit. Proposed methodology aims to provide a sort of sensitivity
analysis under uncertainty context, when the system is too far complex, due to the number and range
of variables. Therefore, the previous analysis provided a structured thinking to meaningful scenario
construction, so, there is no need to study all possible scenarios. Therefore, the resulting interesting
system variables for study under the scenarios variables were:
E.1 - Patient Looking for Exam Number and per exam distribution of incoming patients
F.7 - Image Acquisition Probability of equipment stoppage for repair
F.9 - Need new image? Probability of need for image retakes resulting in an increased exam time
The proposed methodology does not aim to study the effects of extreme scenarios for Atomedical,
since their results in operations do not result in major uncertainty. For instance, if all equipments
stopped working, the unit would be unable to perform exams, or if the incoming patients came below
a drastic number, it was clear unit inviability. Therefore, and instead of the extreme variable conditions consideration used in most Scenarios Planning literature, this work focused in the intermediate
scenario conditions as they have higher interest in studying unit operations. Since one is focused
in an operational problem, from the implementation of Scenarios Planning methodology, it arises the
common influence of most contexts in few system variables. So, as an identified major system input,
one suggested considering the number of incoming patients as an anchor variable scenario building
and study. Therefore, for each partial scenario in F.7 - Image Acquisition and F.9 - Need new image?,
full scenarios will result from the combination with drawn scenarios for E.1 - Patient Looking for Exam.
One may consider the following partial scenarios for patients procurement:
• 2011 Number of Exams and Distribution (Current Scenario)
• 2009 Number of Exams and Distribution (Optimist Scenario)
• 75% of the Number of Bone Studies Exams from the 2011 Number of Exams
• 75% of the 2011 Number of Exams and 2011 Distribution
• 50% of the 2011 Number of Exams and 2011 Distribution (Pessimist Scenario)
Regarding more operational variables, in F.7 - Image Acquisition, one considered the partial scenario where Gamma Cameras have a malfunction probability resulting in an increase of the stoppage
time by year, from a neglected value to 2%. For the F.9 - Need new image?, in a pessimist scenario,
one might consider an increase on 10% in the average time of images acquisition comparing the current examination times. These scenarios are only relevant when the unit is close to its capacity, where
those stoppages and delays could affect significantly the operations. Therefore, the scenario drawn
67
from these variables were only combined with the current and 2009 patient procurement scenarios.
As a final result of scenario construction, one ends with 9 final scenarios combinations:
2009 2009 Exams Data (Optimist Scenario)
2011 2011 Exams Data (Current Scenario)
2011-75 75% of the 2011 Exams Data
2011-75B 75% of 2011 Bone Studies
2011-50 50% of the 2011 Exams Data (Pessimist Scenario)
2011-Chamber 2011 Exams Data and Gamma Camera malfunction probability of 2%
2009-Chamber 2009 Exams Data and Gamma Camera malfunction probability of 2%
2011-Time 2011 Exams Data and 10% increase on the average time of images acquisition
2009-Time 2009 Exams Data and 10% increase on the average time of images acquisition
6.2
Step Five: Strategies in the Atomedical problem
Scenarios Planning at an operational level are useful for decision makers to construct and evaluate possible interventions strategies in the system under the considered scenarios. This step does
not intends to provide a definitive strategy setup, but to give Atomedical unit managers a view of how
their actions can influence the system, and its impact in different scenarios, as an approach of sensitivity analysis. For this purpose, one must take into account the strategic key variables. Again, the
use of morphological analysis, and a blocks method framework, allows one to reduce the number of
final strategies in a structured and meaningful way. As before, process flow chart, of Figure B.1 in
Appendix B, was used to put key variables in operational context groups. Strategies are connected to
those components which unit managers can directly influence, or where their decisions can indirectly
change the range of uncertainty of the system. Some strategies may be target similar system components as scenarios, so, they should be taken into account, avoiding redundant considerations for
system setups. One can gather previous key variables as suggested in Table 6.2.
Table 6.2: Strategies key variables separation into Atomedical unit subsystems. Subsystems are driven from
the systems flow chart of Figure B.1 in Appendix B, from system inputs or tasks connected to key variables
uncertainties.
I.1 - Scheduling Plan
# 8 Patients scheduling
# 45 Exam duration
I.2 - Staff Management
# 2 Schedule - number of unit staff
# 3 Schedule - unit staff working hours
I.3 - Radioactive Material Purchasing
# 23 Technetium generator delivery frequency
# 27 Other radionuclides delivery frequency
I.4 - Equipment/Facilities Investment
# 16 Frequency of equipment maintenance
# 17 Number of equipments
# 18 Equipment calibration
# 20 Image processing equipment performance
# 39 Used product in each exam/treatment
E.1 - Patients Looking for Exam
# 54 Quality of competitors service
# 63 Atomedical service quality
# 64 Atomedical exam quality
As considered in scenarios construction, financial strategies may be evaluated outside model
68
simulation, namely, with variables that influence unit revenues, but can be drawn based in the total
number of exams, for instance, the # 59 Price of exams in agreement.
6.2.1
Subsystems Strategies analysis
I.1 - Scheduling Plan, I.2 - Staff Management and I.3 - Radioactive Material Purchasing: The
schedule, staff managements and product purchasing were gathered since they are always managed
together. They are optimized through combinations performed by the unit managers given all system
constraints and mainly based in their experience. Since the construction of alternative optimization
methods for this purpose are not part of this work, one is limited to consider those that were used
before in the unit, or were newly defined by the unit managers.# 8 Patients scheduling plan of exam
appointments is the main unit managers strategic intervention, allocating equipment and staff in articulation with the excepted # 45 Exam duration. Exam duration depends in staff experience, equipment,
and exam procedures. # 2 Schedule - number of unit staff contribute to the design capacity of the
unit, however it is established a minimum number of workers to perform each tasks. # 3 Schedule
- unit staff working hours relates with the unit working period, to settle shifts, in order to cover the
full working period of the unit. The # 23 Technetium generator and # 27 Other radionuclides delivery
frequency influence and result of the schedule. The Technetium generator is delivered only two times
a week, and exam schedule is optimized to best fit to the activity decrease of the products. Other
radionuclides are only delivered when exams are asked.
Atomedical unit examination schedule changed to better adapt to the changes in the incoming
patients. Therefore, it is difficult to consider the previous unit schedules outside their context, since
their performance is connected to the match that exists with the distribution of patients per exam. As a
strategy to overcome a reduction in the number of clients, unit managers considered as new schedule
strategy decreasing the unit working period from the actual 8h00/21h00 to 8h30/18h00. This allows
the decrease in 2 NM Technicians and 1 Reception Worker in a new shift organization, reducing staff
idle time. This was based in initial schedule used in calibration (2011), so, more Scenarios should be
considered for this strategy regarding a reduction a reduction to 75% and 50% of the 2011 Number
of Exams and Distribution should be considered for this strategy.
I.4 - Equipment/Facilities Investment:
In a Nuclear Medicine unit, equipments are a key part of
the procedures and unit performance. # 16 Frequency of equipment maintenance may influence the
possibility of the need of repairs, which may reduce temporarily the number of available equipments.
However, this influence is already expressed in scenarios, so lowering costs to reduce the level of
maintenance becomes redundant in this analysis.
Acquisition equipment are the main unit capacity driver. Equipments are relatively new, but represent significant costs in annual maintenance (comparable to the cost of three staff persons). Equipment stoppage is already a reality in competitors units to save in maintenance costs. However, it is
69
considered an extreme option, due the severe degradation of the equipments out of maintenance. Although, given being a drastic strategy, it is important to evaluate the effects current unit performance
and optimist scenarios where unit capacity becomes again a major issue.
Another possibility to unit managers is to make equipment improvements, for instance, upgrading
existent equipment, in order to reduce the time of image acquisition and processing, that can be
significant if combined with a higher administrated activity. In cardiac studies, the majority of exams
performed, these improvements could represent a reduction of 20% in the total time of the acquisition
time. However, one has to consider the costs in the upgrade, and that the use of higher activities are
more prejudicial exam to patients.
E.1 - Patients Looking for Exam:
Unit managers can choose to compete with the # 54 Quality of
competitors service by providing a better service, or following the strategy of lowering price, possible
if costs are reduced. However, this is only possible by reducing # 64 Atomedical exam quality and
# 63 Atomedical service quality. Less quality may reduce the number of patients, but lower prices
might compensate, or even increase the final number is some contexts. Service and exam quality
was set as an objective to retain or improve, since current unit quality assure a very good reputation
among competitors. Therefore, only price variations can be considered to attract more patients. The
procurement variation is already addressed in scenarios, and the impact of exam price variations
might be explored in a financial evaluation of simulations results.
6.2.2
Strategies
Each considered subsystem strategies have to be now combined in global unit strategies. Strategies complement scenarios in future analysis of system situation. Therefore, it is important to spread
possibilities, avoiding redundant consideration, since one already draw the scenarios to be studied.
Strategies are aimed to overcome such scenarios, through unit managers’ intervention, that have
to be coherent, feasible and respect the established values and objectives. Again, this methodology aims to explore the effects of meaningful strategies on the system, not all strategies possibilities
and combinations. From the strategies analysis, and the drawn scenarios, result interesting system
variables to be study under the strategic variables:
I.1 - Scheduling Plan, I.2 - Staff Management and I.3 - Radioactive Material Purchasing: Articulated
weekly exam schedule with number of staff in each period (Reception and NM Technicians) and
available radioactive products (technetium and other radionuclides)
I.4 - Equipment/Facilities Investment: Number of equipments and time duration of exam acquisitions
Under the guidance of block method framework in variables analysis, it was chosen a set of strategies that will be evaluated together with the drawn scenarios. Morphological analysis aims to provide
70
in the Scenarios Planning Framework an increase of final information together with a reduction of
the complexity. A set of combination of scenarios and strategies have to make sense in providing unit
managers more understanding about Atomedical, preparing them to the future. In order to simplify the
strategies focused in the examination part of the system, they are only evaluated against an optimist,
current and pessimist scenario of procurement. The set of strategies and scenario to be considered
together are presented below:
Strategy 0 Current Strategy (as defined in model calibration for 2011)
Scenarios for evaluation:
2009 2009 Exams Data (Optimist Scenario)
2011 2011 Exams Data (Current Scenario)
2011-75 75% of the 2011 Exams Data
2011-75B 75% of 2011 Bone Studies
2011-50 50% of the 2011 Exams Data (Pessimist Scenario)
2011-Chamber 2011 Exams Data and Gamma Camera malfunction probability of 2%
2009-Chamber 2009 Exams Data and Gamma Camera malfunction probability of 2%
2011-Time 2011 Exams Data and 10% increase on the average time of images acquisition
2009-Time 2009 Exams Data and 10% increase on the average time of images acquisition
Strategy 1 Reduction on the working period of the unit from 8h30 until 18h00
Scenarios for evaluation:
2011 2011 Exams Data (Current Scenario)
2011-75 75% of the 2011 Exams Data
2011-50 50% of the 2011 Exams Data (Pessimist Scenario)
Strategy 2 Decrease the number of Gamma Camera to 3
Scenarios for evaluation:
2009 2009 Exams Data (Optimist Scenario)
2011 2011 Exams Data (Current Scenario)
2011-50 50% of the 2011 Exams Data (Pessimist Scenario)
Strategy 3 20 % reduction on the image acquisition duration in Cardiac Studies
Scenarios for evaluation:
2009 2009 Exams Data (Optimist Scenario)
2011 2011 Exams Data (Current Scenario)
2011-50 50% of the 2011 Exams Data (Pessimist Scenario)
6.3
Step Six: Signposts for the Atomedical problem
Signposts are a preparation to the next phase of Scenarios Planning. They are important to evaluate system performance in the constructed scenarios and strategies. Since they result of the problem
analysis, they were included in the phase 2 of this work. Signposts need to be coherent with the
problem objectives, allowing to evaluate the influence in operations of the different studied setups, in
71
order to prepare unit managers to better react to future and present problems. In the analysis of the
problem and the system, some variables were identified as signpost. They were mostly variables with
identified impact/importance to unit managers, usually with a significant dependence and not directly
controllable. Others make sense due to the lack of prior behavior knowledge. Being scenarios planning an iterative method, other signpost might have arisen directly from the strategies and scenarios
constructed. Although, no more signpost were considered. Signpost are of extreme importance in
the simulation model design and its implementation, since simulation results must provide information
about them. One can divide the previously identified signpost variables in the following categories:
Resources Workload # 4 Schedule - Extra working hours of unit staff, # 5 Reception staff workload,
# 6 NM Technicians workload, # 7 NM Doctors workload and # 19 Equipment workload
Used Products # 33 Quantity of Technetium generator bought, # 35 Quantity of “Cold Kits” bought,
# 36 Unused Technetium, # 38 Unused “Cold Kits”
Patients # 48 Schedule availability, # 65 Patient waiting time in unit
Operational Performance # 41 Image retake, # 51 Number of examinations # 66 Atomedical operations costs
Some of those signposts result directly from the systems inputs, while others are embedded in
scenarios and strategies assumptions, as # 41 Image retake. It is important to notice that Atomedical
operations costs are the result of the design capacity, from which arises the resources’ workload, and
the used products. Revenues, are related to the number of examinations and their distribution, which
may be used afterwards to study the financial performance of the unit regarding different prices of
exams. Although, the study of the financial performance of the unit is not part of the scope of this
work.
6.4
Scenarios and strategies in the Atomedical problem
Scenarios Planning methodology was used to analyze the Atomedical problem and construct scenarios and strategies to address it. They result from the identified key variables of the problem,
therefore, aimed to provide more information to the unit managers regarding their problem. The
methodology used allowed to perform this task in a systematic way, aiming a final coherence and
deeper tools to explore the uncertainty of the problem.
The resulting scenarios explore the results of changes in the Atomedical context, as well as,
explore significant internal changes that can escape the unit managers control. Therefore, focusing in
the unit operations, it was possible to fully integrate with the DES model. In reviewed literature, similar
studies used a lighter methodology approach to simply draw simulation scenarios and strategies.
However, as novelty, one was able to fully use Scenarios Planning to wide the unit managers views
of their operations and challenges, while focusing in an operational type of problem.
72
7
Scenarios Planning Phase 3:
Evaluation of Strategies and
Scenarios - Discrete Event
Simulation Model
Contents
7.1
7.2
7.3
7.4
Atomedical Simulation Model . . . . . . . . . . . . . . . . . .
Atomedical DES Model Calibration and Validation . . . . . .
Implementation of Scenarios and Strategies into the Model
Simulation results . . . . . . . . . . . . . . . . . . . . . . . . .
.
.
.
.
.
.
.
.
.
.
.
.
.
.
.
.
.
.
.
.
.
.
.
.
.
.
.
.
.
.
.
.
.
.
.
.
.
.
.
.
.
.
.
.
.
.
.
.
74
78
80
81
73
The use of a DES model provides one a tool to address the uncertainty related with the unit
processes by considering in the model a statistical variation of its events. This complements environment uncertainty, in the Atomedical problem in study, addressed in the construction of scenarios and
strategies. Scenarios and strategies were combined with DES using the model inputs and parameters, which allowed the definition of different simulation setups instances.
7.1
Atomedical Simulation Model
For the purpose of evaluating scenarios and strategies drawn in the previous part of scenarios
planning methodology, one used a DES model of Atomedical. Previous work of Azevedo [2010] in
Atomedical resulted in the development of a DES model of the processes. The processes described
in 2010 remain the same nowadays, despite the changes of environment. The used DES model of
Atomedical was reviewed and enhanced in order to satisfy the needs of the actual problem. The
simulation model was implemented in Simul8 Simulation Software 1 .
The Atomedical model focus in the processes of unit examination (administrative operations were
not modeled). They can be divided into three sub-systems: Scheduling; Examination and Reporting.
Those subsystems connect between them through a sequence feeding of work and through resource
sharing, as one can see in Figure 7.1. Model calibration, validation and result analysis need to
take into account the existence and importance of all those parts and their connections. Those subsystems may respond differently to the contexts, but the final system evolution results of the interaction
of sub-systems responses through the existing connections or through resource usage.
Examination!
Scheduling!
Reception Staff!
Exam !
Schedule!
Reporting!
NM Technicians!
NM Technicians!
Exams!
!
Info!
RF Preparation! RF!
Radiopharmacy!
Patients!
Exam!
Reporting!
Patients!
Patient Check-in! Patients!
Exams!
RF Administration
Cabinet!
Patients!
Reception Desk!
NM Technicians; !
NM Doctor;!
Processing Equip.!
RF
Administration!
Reception Staff!
Patients!
NM Technicians; !
Pre-Processing Equip.;!
Reception Desk!
Gama Chambers;
Stress Test Room!
Patients!
Report Cabinet!
Reports!
Figure 7.1: Systems and sub-systems of simulation model. Modeled tasks are represented inside sub-systems.
The Scheduling sub-system models the way that, after a patient arrival, Reception Staff schedule
the patient exam to the next available slot in the exams schedule plan. At the level of Examination,
1 Simul8 Simulation Software is a commercial software focused in process improvement from the Simul8 Corporation. A
student license was used for the purpose of this work. More information available in http://www.simul8.com/
74
it was modeled the way that resources (equipment and staff) accomplish the event tasks of the patients’ exam procedures. In the model, the number of exam procedures was restricted by directly
simulating the most important exams in terms of revenues and gathering the remain into two typical
type of procedures (more information on Table 2.1, Section 2.1). The model explicitly simulates the
following exams: Bone Scintigraphy, Myocardial Perfusion Study, Thyroid Scintigraphy, Renograms.
The Renogram procedure in the model represents the different types of renograms performed.
Exams that were not explicitly modeled were simulated into two groups: exams that are dynamics,
which means that the image acquisition is made immediately after the injection of the RF; and exams
that require a waiting time between RF administration and image acquisition. In the residual exams
with waiting period in the clinic after the RF administration were also included the exams where RF
administration is done one or more days prior to the exam, since, as simplification, only the exam
part is considered in the model. More information about the unit exams included in the model can
be found in Azevedo [2010]. In the grouped exams, different times of waiting and acquisition exist.
Therefore, for model calibration, it is considered statistical distributions of times in those events, based
in the sample of exams included. The purpose of including these exams is not their modeling, but the
consideration of inference in unit operations, but to consider the interference in unit operations. Thus,
they will not be considered in the exams types analysis of result.
The model uses the statistical variation in modeled events times to address not explicit time components, such as patient and/or staff travel inside the clinic, or patients preparation. Also, if patients
remain inside the clinic after the closing hour, staff remains extra hours to complete the day exams. After the Examination, the patients exit the clinic, and the exams produced pass to the final sub-system,
Reporting. Here, the NM Doctor performs the reports for the finished exams.
A complementary procedure related with the radiopharmacy was also included, where the RF are
prepared, in order to model the occupancy of a NM Technician in this procedure. The workload of the
radiopharmacy vary with the number of exams in each day. The individual preparation of RF before
administration is included, in the model, as part of the time of the injection procedure.
As a simplification of the real system, the simulation model was built based in some simplifications
and assumptions, in order to reduce the complexity of the model to a set of variables that mainly
define and influence the problem in study. Some of those are related to the scheduling of exams,
procedures, and staff that was considered in the model. More information about the construction of
the model of Atomedical operations and exams can be found in Azevedo [2010].
7.1.1
Simul8 DES Model Implementation
The implementation of the Atomedical DES model was performed in Simul 8 Simulation Software.
Simul 8 software is based in Work Centers (WC), Resources (RES) and Queues (SB), that were
used to represent the different model tasks, staff and the waiting rooms/waiting periods, respectively.
75
The Work Items represents the Patients and flow through the model following a Job Matrix. This
matrix defines different paths for each type of exam through the existing Work Center. Since the tasks
performed in each Work Center depend on the type of exam, the Job Matrix provides also information
relative to time spent in tasks. The implemented model in Simul8 is represented in Figure 7.2.
Figure 7.2: Atomedical Simul8 Simulation model. Simulation model is based on three types of items: Work
Centers (name started with WC), Resources (name started with RES) and Queues (name started with SB).
Work Centers can need a Resource to perform a task, and they are connected to each other through Queues,
where the Patients wait for Work Centers and/or Resources, availability. Work Items, defined as Patients, flow
through the model, following the arrows that connect the represented items. They start at an initial point, WEP
Patients, an exit the model at WEPex Patients, following the path described for their type of exam in the Job
Matrix.
In the background of the model, simulation runs different events (for instance the entry or exit of a
Work Item through Queues and Work Centers, or Resource allocation). Time between events, such
as, the duration of a task, is set by statistical distributions, from which is randomly drawn to each event.
Also in the background, Simul8 allows the implementation of complementary Visual Logic routines.
They are attached to events or runs in a timely base, and can read, define or change the model
variables. Therefore, Visual Basic was used to perform complex tasks in events, like scheduling, to
personalize parameters for tasks, or to update the number of available of resources. One can see an
example of the used Visual Logic routines in Code Snippet 7.1.
Visual Basic was also used to connect the Simul8 to Excel, in order to import and to extract the
data of the simulation (variable values or tables of data), due to the limitations of the Simul8 version.
One defined the simulation to run the model during 52 weeks, in order to simulate the unit operations
during a year. However, in the first weeks results were not collected. This is called the warm-up
period, during which the simulation is evolving to correctly reproduce the reality of unit that is already
76
in operation, allowing that model parts, as queues, to acquire normal operating conditions.
Code Snippet 7.1: Illustration of Visual Logic Code used. This code runs in a timely base. At specific times the
calculations of parameters are performed for other routines or output produce.
1 VL SECTION : Time Check L o g i c
’ Repeated a t a s e t t i m e i n t e r v a l
I F HOUR[ S i m u l a t i o n Time ] < 21.5
SET RES NM T e c h n i c i a n s . Max A v a i l a b l e = ss s h i f t s [DAY[ S i m u l a t i o n Time ] , h ]
SET nmt = ss s h i f t s [DAY[ S i m u l a t i o n Time ] , h ]
6
SET h = h+1
I F HOUR[ S i m u l a t i o n Time ] = 21
I F MINUTE [ S i m u l a t i o n Time ] = 0
SET v a r _ e n t r y = bd e n t r y
BreakDown
WEP P a t i e n t s , 0
11
I F HOUR[ S i m u l a t i o n Time ] = 7
I F MINUTE [ S i m u l a t i o n Time ] = 30
SET nday = [ [ 5 * [WEEK[ S i m u l a t i o n Time ] − 1 ] ] +DAY[ S i m u l a t i o n Time ] ]
SET nexamesday = RF[ 1 , nday ]
SET r f v a r = 0
16
WHILE r f v a r <= RF[ 1 , nday ]
Add Work To Queue
P a t i e n t s , SB Day RF
SET r f v a r = r f v a r +1
SET h = 1
BreakRestart
WEP P a t i e n t s
21
I F HOUR[ S i m u l a t i o n Time ] >= 21
I F NOT ( n p a t i e n t s o u t = nexamesday )
SET RES NM T e c h n i c i a n s . Max A v a i l a b l e = ss t u r n o s [DAY[ S i m u l a t i o n Time ] , 2 7 ]
SET d a y e x t r a w o r k i n g h o u r s = d a y e x t r a w o r k i n g h o u r s +0.5
I F HOUR[ S i m u l a t i o n Time ] = 23
26
I F MINUTE [ S i m u l a t i o n Time ] = 30
SET ss daysummary [ 1 , d a y l i n e ] = DAY[ S i m u l a t i o n Time ]
SET ss daysummary [ 3 , d a y l i n e ] = d a y e x t r a w o r k i n g h o u r s
SET ss daysummary [ 4 , d a y l i n e ] = n p a t i e n t s o u t
SET ss daysummary [ 1 8 , d a y l i n e ] = dw_c4
31
SET ss daysummary [ 2 2 , d a y l i n e ] = t _ d a y s t r e s s i n g
SET ss daysummary [ 2 7 , d a y l i n e ] = h o u r p a t i e n t e x i t
...
SET d a y l i n e = d a y l i n e +1
SET n p a t i e n t s o u t = 0
36
SET d a y e x t r a w o r k i n g h o u r s = 0
SET dw_c4 = 0
SET t _ d a y s t r e s s i n g = 0
SET h o u r p a t i e n t e x i t = 0
The implementation of the used Atomedical DES model was enhanced by solving detected errors, optimizing routines and providing a deeper level of operational indicators for the purpose of the
problem in study. The enhancements were made at the level of:
Simulation: The warm-up period is usually set in Simul8. However, to allow a more flexible result
analysis, all results were set to be collected. The result analysis in Excel uses a week of simulation filter that allows to set the warm-up period.
Model: The model was set to start RF preparation after the patient arrival. However, this procedure
is done based on the total exam scheduled for the day. Therefore, it was set that RF preparation
was made during 2 hours in the beginning of the morning and of the afternoon, from an initial
pool based in all the exams scheduled to the day.
Model: Only the Renograms and the Thyroid Scintigraphy exams are performed in Camera 4. Using
a common Queue for all the Camera Work Centers, the model failed to follow the Job Matrix,
so, all types of exams might use Camera 4. To correct this, one used two Queues, for which
exams are directed by the Job Matrix, according to their type. Only the Queue that receives the
Renograms and the Thyroid Scintigraphy allows the access to Camera 4.
77
Visual Logic: The way as Visual Logic code saves the information of a Patient item was very slow
because needs to search its information in a table. This time increased during simulation with
the size of table. Instead of a search routine, an index direct to the location was used.
Visual Logic: Previously, only waiting time in queues were collected. To provide more performance
information, all Waiting Time (WT) and time of tasks in the simulation are collected.
Visual Logic: To support used product analysis from the simulation, the used resources in each day
are collected in day summaries.
An Excel spreadsheet is used to import data to the model and extract simulation results. In the
Excel spreadsheet, the user introduces a set of model inputs, like the Schedule Plan, the Job Matrix
or the NM Technicians shifts. Together with the Simul8 software parameters, one is able to control all
the variables connected to scenarios and strategies, as stated in Sub Section 6.1.2 and Sub Section
6.2.2. The Visual Basic routine allows to extract every detail of the simulation, as the time between
events for every Patient, or the use of resources. This data is at the end of the simulation exported
to an Excel document that performs the statistical analysis of outputs (per type of exam and weekday
analysis), which completes the extraction of all the signpost identified in Section 6.3. A comprehensive
resume of the outputs implemented is presented in Table 7.1.
Table 7.1: Simulation Model Outputs and Signpost.
Type
Output
Signposts
Staff Workload
# 7 NM Doctors workload, # 6 NM Technicians workload and # 5 Reception
staff workload
# 6 NM Technicians workload
Productivity
Staff Workload
Distribution
Work Centers Workload
Last Patient Out
Number of Reports
Number of Exams
Quality
Financial
Time in Clinic
Waiting Time for Exam
day
Waiting Time in Queues
Waiting Time for Report
Exam Duration
Exam Profit
"Cold Kits" Expenditure
Technetium Expenditure
7.2
# 19 Equip. Workload and # 66 Atomedical operations costs
# 4 Schedule - Extra working hours of unit staff
# 51 Number of Examinations
# 65 Patient waiting time in unit
# 65 Patient waiting time in unit
# 65 Patient waiting time in unit and # 41 Image Retake
# 35 Quantity of "Cold Kits" bought, # 38 Unused "Cold Kits" and # 66
Atomedical operations costs
# 33 Quantity of Technetium generator bought, # 36 Unused Technetium and
# 66 Atomedical operations costs
Atomedical DES Model Calibration and Validation
In order to correctly simulate the Atomedical operations in the Simul8 DES Model, one has to
calibrate it using the model parameters and inputs, so it represents the actual procedures. For this
purpose, the existing real data or information provided by the staff was used.
In model calibration one used the parameters described in Azevedo [2010] for the times of the
tasks inside the unit. Parameters for procedures and tasks times were considered together with unit
managers to remain the same since 2009. They are intrinsic to the unit operations, despite changes
78
in that values may be used for new setups in scenarios/strategies evaluation. Parameters associated
with a significant variability were considered stochastic, in order to take advantage of the possibility
to model stochastic events provided by the DES. It was needed to define the context of the number
patients that look at Atomedical services, and the distribution of the type of exams. For this purpose,
one used the data regarding the year 2011, in which 21265 exams were performed. Regarding the
exam schedule plan and staff shifts, the ones used in September 2011 were considered.
The calibrated model was simulated for one year runtime and half-year warm-up period. The
resulting output values were discussed with the unit staff, in order to validate the model for the real
system in study (Table 7.2). Results allow the comparison of the simulation model with the data of real
performance of Atomedical. However, the year 2011 saw a change in the unit environment context.
The calibration parameters were adapted during the year, namely agenda and shifts. However, the
model assumes the same setting to the entire period of simulation, what limits the validation.
Table 7.2: Calibration Model Simulation Results. Results are based in current context of Atomedical in 2011. The
total exams performed are related to the entire year operation while the renaming indicators are only relative to
half-year exams results, after a warm-up period. The standard deviation (SD) do not follow a normal distribution.
Exams
Indicators
Patients per Day
Total Exams
Average
SD
79.4
20571
16.5
Bone Scintigraphy
Days Until Exam (days)
Time in Clinic (min)
WT in Clinic (min)
WT for Exam (min)
1.7
163.93
16.92
5.58
0.79
14.12
13.65
7.21
Myocardial Perfusion
Days Until Exam (days)
Time in Clinic (min)
WT in Clinic (min)
WT for Stress Test (min)
WT for Exam (min)
13.05
93.12
21.14
7.41
1.62
1.99
15.12
14.86
6.60
3.18
Thyroid Scintigraphy
Days Until Exam (days)
Time in Clinic (min)
WT in Clinic (min)
WT for Exam (min)
1
52.35
15.35
0.12
0.00
13.76
13.58
0.54
Renograms
Days Until Exam (days)
Time in Clinic (min)
WT in Clinic (min)
WT for Exam (min)
1
48.63
9.23
1.99
0.00
10.54
7.86
3.11
7.40
0.14
99.83
8.67
0.74
133.14
WT in RF Administration (min)
WT in Preprocess (min)
WT for Report (min)
Results allow to observe if the set of parameters are correctly expressed in the simulation (i.e.
number of patients and exams, examination time) and if the model outputs present similar behavior to
those described by the unit managers. The number of patients and exams followed what was set as
parameter for the simulation. Despite of that, the total of performed exams is a decreased. That fact
result of the a warm-up period in simulation and the increased waiting time in scheduling Myocardial
perfusion exams, compared with what happened in Atomedical. The time of the examination (resulting from subtracting the waiting time from the total time in the unit) is according the type of exams
procedures, and the excepted duration from the used calibration parameters. From the analysis of the
model outputs, as already stated, the time for scheduling a Myocardial Perfusion exam is above the
79
real time. This fact is due to the agenda used (from September 2011) do not fit the exams distribution
of 2011, since the number of exam decreased after the summer of that year. Therefore, the agenda
designs a unit capacity that targets an environment context of inferior procurement than simulated.
However, since one is mainly looking to evaluate model variations in different scenarios/strategies,
this shift from the real unit operation values was not relevant. Regarding the remaining waiting times
results, they are in line with what happens in Atomedical.
The model was considered to be a valid approximation of the real system in 2011, being therefore,
able to sustain further work in scenarios/strategies evaluation in Scenarios Planning.
7.3
Implementation of Scenarios and Strategies into the Model
At this point one has a base model for this work. However, that base model has to be adapted to
represent the drawn scenarios and strategies. In each of them, specific system parts are addressed,
and its initial situation changed accordingly to the scenarios/strategy in study. There is a need to
define how those changes will be expressed in the model in order to be simulated. It is important to
notice that previous model design had already taken into account the needed adaptation to scenarios/strategies in the inclusion of parameters or inputs for simulation model setup.
Regarding scenarios, different exams’ procurement (number of patients and distributions) were
defined as a change on the time between patient arrival and the distribution of the exam types for those
patients. The scenario of an increase stoppage time of Gamma Cameras was defined by reducing the
Gamma Cameras Work Centers efficiency (efficiency defines the amount of time in which equipment
will work). As set in the strategy definition, the efficiency level of one Gamma Camera was set to
98%, corresponding to doubling the maximum stoppage time currently. For simulating an increase in
the average time of image acquisition, one defined an increase of 10% in all Gamma Cameras exam
time from the initial values defined during calibration.
Regarding strategies, Strategy 1 one has a change in the unit working hours. For this purpose,
the reception working time was reduced to the time between 8h30 and 18h00. The time between
patient arrival was adjusted in each scenario for this new working period (in order to preserve the
same patients arrivals per day that value has to decrease). A new Schedule Plan input to the model
was set by unit managers to fit the new working time, in order to the last patient entry occur about 3
hours before closing hour. The NM Technicians shifts were also adjusted to this new schedule. For
implementing Strategy 2, the reduction in the number of equipment, the work of one Gamma Camera
is suspended (since the Gamma Camera 4 is used only in some exams, one of the other Cameras
is chosen). For the purpose of simulating Strategy 3, the decrease in the exam duration in Cardiac
Studies, the time of the image acquisition inside the Gamma Camera is reduced by 20 %. The DES
model was this way set to simulate and evaluate the design scenarios and strategies.
80
7.4
Simulation results
In this work, one introduced the use of full Scenarios Planning methodology focusing in an operational problem. As a result, unit managers were able to better understand the problem and their unit.
The challenge from the unit context uncertainty was addressed successfully. However, the behavior
of the unit was difficult to predict. This level of uncertainty still needs to be tackled. For that purpose,
one used the Simul 8 DES model to evaluate the constructed scenarios and strategies. Therefore,
different simulation models were built to represent them. The results of the simulations allowed unit
manager to gain further insight about the different impacts in their unit. The quantity of data that can
be extracted from a simulation can be enormous and difficult to analyze. However, this methodology
does not imply a fully study of the unit operations. Focusing in the trends in the selected signpost,
one was able to provide more information about the problem reducing the complexity of analysis.
Therefore, the presented results are focused in the data of interest to the problem.
Simulating only some scenarios for the obtained strategies provides a simpler, but robuster, sensitivity analysis of the problem. For this purpose, the results are compared to a control simulation.
This simulation changes, based on the main change that the scenario/strategy combination provides.
Strategy 0 in the 2011 scenario was considered a base simulation. For the remain, the results in
Strategy 0 were compared with the 2011 one, since it was only changed the number of patients. For
the remain Strategies, other variables are changed. Therefore, in order to remain focused, those
simulations are compared with Strategy 0 in the equivalent scenarios of procurement. Changes are
highlighted using arrows near the comparison values. They represent 10% to 20% different, highlighted as yellow, and more than 20%, highlighted as green (increase) and red (reduction). The
analysis of results focused in the data statistical analysis of each patient performed exam, scheduled
to a day after the warm-up period. More data was also extracted from the day summaries in the result
collection period. Further detail focus in different type of exams.
Simulation variability was included by the study of multiple exams results, rather than just on one
final result. The used signposts indicators for results can be divided into three groups: service quality,
unit performance and unit workload. Therefore, the results were analyzed considering those groups,
by comparing the evolution of indicators along the different simulations. That way, the aim was the
identification of the impacts in the indicators on each simulation conditions.
7.4.1
Unit performance indicators
Unit performance indicators are focused in the unit response to the number of incoming patients.
Tables 7.3, 7.4, 7.5 and 7.6 show the total amount of patients, and the number of patients per day, in
the result collection period (half a year). Those values mostly resulted from the defined parameters.
However, if the available vacancies in the schedule plan are almost complete, the number of exams
could be less than the expected number of incoming patients, due to the unit not being able to fulfill all
81
requests in a timely manner. For instance, in 2009, the percentage of Schedule, Table 7.3, indicates
almost none vacancies in the schedule. The resulting total number of exams is below the setting, as
a result of a significant waiting list. Schedule fulfillment decreases with the procurement.
Table 7.3: Unit performance results for Strategy 0 under the procurement scenarios, regarding the average
(AVG) of exams within the collection period.
Each day exit hour of the last patient does not change accordingly to the decrease of the number
of patients, due to the model not being flexible and adjusted to day vacancies. However, the existing
decreases are due to the change on the waiting time in unit tasks. A significant increase of the waiting
times resulted in later exit hours, Table 7.4. The waiting times follow the number of exams performed,
due to a fixed unit capacity. Reports follow the same reduction of the number of patients, as expected.
Table 7.4: Unit performance results for Strategy 0 under the operational scenarios, regarding the average (AVG)
of exams within the collection period.
Table 7.4 focus in the operational scenarios, for the same number of patients and schedule. The
scenario of lower availability of Gamma Camera had significant impact on patients waiting time, but
only under the context of almost full schedule. The increase in 10% of the time of image acquisitions
had less impact, and only regarding the patient waiting time.
Table 7.5: Unit performance results for Strategies 1 and 2 under the procurement scenarios, regarding the
average (AVG) of exams within the collection period.
82
Table 7.5 addresses the results of Strategies 1 and 2 results. The reduction of the working period
(Strategy 1) fits well to maintain the level of performance while the procurement decreases to half of
the levels of 2011. However, the use of such schedule in the scenario of 2011 had a significant impact
in the unit performance, and the unit was not able to perform all the exams before the expected closing
hour, 18h00. Using a schedule with lower total vacancies, the total number of exams performed
decreased, while comparing to the control simulations. For Strategy 2, the reduction of the number of
cameras resulted in doubling the waiting times of the patients, for all scenarios. However, in the 2009
scenario, only the exit time of the last patient increased, since less patients are schedule to the end
of the day.
Table 7.6: Unit performance results for Strategy 3 under the procurement scenarios, regarding the average
(AVG) of exams within the collection period.
Table 7.6 focus in Strategy 3, the reduction of the time of the Myocardial Perfusion exam. It
allowed a slight reduction in the patient waiting time. But further analysis of the impact of this strategy
is needed regarding only this type of exams.
7.4.2
Service quality indicators
Service quality indicators are focused in the patients waiting time. They detail the unit performance indicators regarding each type of modeled exams. They explore the time to the examination
day and the time inside the clinic, namely the waiting times for main tasks such as: Exam and RF
administration. The last one is similar to all type of exams.
The waiting time for RF administration decreased with the procurement. The Myocardial Perfusion
represents about half of the examinations. Therefore, it was the only one to see a significant decrease
in time to the examination, with lower procurements. In 2011-75, 2011-75B and 2011-50, it decreased
to values of two working days. These results show that the used schedule sets an insufficient capacity
for the procurement of 2009 and 2011 for some exams. In 2009 simulation, a new agenda was used,
so, the results show a better fit to the exams distribution. Consequently, the waiting time did not
increased significantly, as it would be expected, and in some cases, decreased, namely in the two
most performed exams: Myocardial Perfusion and Bone Scintigraphy. In the scenario 2011-75B, only
Bone Scintigraphy exams decreased, but without significant values.
83
Table 7.7: Service quality results for Strategy 0 under the procurement scenarios, regarding the average (AVG)
of exams within the collection period.
Time in Clinic changes with the variation of the waiting time inside the unit, Table 7.7. The impact
of procurement in the waiting time was more significant in the Myocardial Perfusion exam. This was
mainly due to the level of waiting time for the Stress Test, performed individually in just one room. The
waiting times in clinic were not the same for all exams, due to the schedule fit of different exams entry
hours to the unit capacity. Even in lower procurements than the 2011 scenario, the total waiting in
clinic, and wait for exam, presented low reductions.
Table 7.8: Service quality results for Strategy 0 under the operational scenarios, regarding the average (AVG) of
exams within the collection period.
84
Table 7.8 focus in the operational scenarios. Both exam duration increased and a low Gamma
Chamber availability resulted in an increasing waiting time for the exam in those more frequent. The
increase in the waiting time for performing the image acquisition was more significant than the one
in the total wait in clinic. The increase of the global waiting time is mainly due delays of image
acquisition. The reduction of availability of Gamma Cameras allowed to free NM Technicians for
the task of RF administration, reducing it waiting time, namely, in a scenario of high procurement
(2009). The increase of the examinations times had the opposite effect, reducing the availability of
the NM Technicians and increasing the waiting time for RF administration.
Table 7.9: Service quality results for Strategies 1 and 2 under the procurement scenarios, regarding the average
(AVG) of exams within the collection period.
At this level, the indicators impacts of Strategies 1 and 2 are shown in Table 7.9. Strategy 1
increased the time to the exam day in all scenarios. This change was more significant in higher
procurement scenarios, given the reduced capacity in the new schedule. This strategy also increased
the waiting times. In Bone Scintigraphy, a reduction of the waiting time for performing the image
acquisition was due to the new schedule fit to unit capacity for this exam. Therefore, if it allows a
higher entry of patients comparing with the unit capacity, it will result in the deterioration of the waiting
times. In Strategy 2, as in the Strategy 0 operational scenarios, the increase of NM Technicians
availability contributed to the reduction of the waiting time in other tasks: RF administration and Stress
test. However, the total waiting time increased, as a result of the waiting time for image acquisition.
85
Table 7.10: Service quality results for Strategy 3 under the procurement scenarios, regarding the average (AVG)
of exams within the collection period.
Table 7.10 states Strategy 3 results. Its impacts were the excepted reduction of the waiting time
for the exam in Myocardial Perfusion. As a consequence, one can observe a small decrease also
in the same waiting time for the other exams. However, the change in the total waiting time was not
significant, given the lack of optimization of the schedule to this reduction in the examination time.
7.4.3
Unit workload indicators
Unit workload indicators provide information about the use of the unit capacity. Unit capacity is
set by its equipment and staff availability. An analysis of the different simulation results supports the
understanding of the need or surfeit of resources in the study contexts. Tables 7.11, 7.12, 7.13 and
7.14 provide the overall results.
Table 7.11: Unit resources workload results for Strategy 0 under the procurement scenarios, regarding the
average (AVG) of exams within the collection period.
86
Table 7.12: Unit resources workload results for Strategy 0 under the operational scenarios, regarding the average
(AVG) of exams within the collection period.
Table 7.13: Unit resources workload results for Strategies 1 and 2 under the procurement scenarios, regarding
the average (AVG) of exams within the collection period.
Table 7.14: Unit resources workload results for Strategy 3 under the procurement scenarios, regarding the
average (AVG) of exams within the collection period.
For Strategy 0, Table 7.11, the workload was directly proportional to the procurement. The resources were not in use most of the time, even on low procurements, giving room to resources reduction. However, a low level of workload does not correspond necessarily to lower waiting times. In
Table 7.12, the reduction of the availability of Gamma Cameras resulted in an increase of the remaining working times. From Table 7.13, Strategy 1 implements a reduced schedule, which means that
less patients enter the unit, resulting in the decrease of the resources workload. Unit seems to better
use of their resources with more patients. The flexibility of the operations allows to manage better
the continuous use of equipments, under that conditions. Strategy 2, as the Strategy 0 operational
scenarios, presented a higher use of the remaining Gamma Cameras. In Strategy 3, Table 7.14, as
the duration of exams was reduced, the use of the Gamma Cameras was reduced.
87
7.4.4
Results Summary
Some insights arise from the results analysis. The impact on operations, by variations on the
examination times, is minimized by flexibility of the operations, influencing only the resulting waiting
time of the patient (see Figure 7.4). The number of Gamma Cameras are the key to the flexibility of the
exam management (see Figure 7.6). The option of their reduction, in the context of low procurement,
allows to decrease costs, but sacrifices the service quality regarding patients waiting time. Table 7.8
shows that it mainly results from the wait for image acquisition. Waiting time for RF administration
mainly results from the level of availability of NM Technicians. Even if the schedule fulfillment is not
near completion, it may result in the reduction of the number of exams (see Figure 7.5). The fit to
unit capacity of the schedule of patient entry in the unit, influence the waiting times inside it (see
Figure 7.9). A constraint in the number of free equipment or free staff, at a given moment, results
in the block of operations. This can occur in different periods. Therefore, a better organization of
the resources and schedule would allow an optimization of resources workload (see Figure 7.11).
Myocardial Perfusion must be the focus of unit management due to the higher impacts in the service
quality indicators. To increase the capacity of the unit to this exam, is important to address the number
of simultaneous stress tests performed (currently just one).
Strategy 0 was the base for scenarios evaluation. The reduction on the level of procurement
reduced the number of performed exams (2009, 2011-75 and 2011-50). Fitting the schedule might
result in lack of response to all the patients, increasing the unit waiting list. Changes in number of
exams of Bone Scintigraphy (2011-75B) resulted in a reduced impact to service quality indicators
(see Table 7.7). Increase in the examination time (2011-Time and 2009-Time) or Gamma Camera
availability (2011-Chamber and 2009-Chamber) resulted in the increase of the waiting times.
Strategy 1 allows to reduce the working period, and therefore costs. However, the studied schedule plan was not optimized, which resulted on increased waiting times and inefficient resources use.
This strategy is not recommended to procurements above 75% the scenario of 2011, due to significant loss in the number of exams and service quality. Strategy 2 allows to increase the usage of the
Gamma Cameras, however, it increases the waiting times on all procurement scenarios tested. Given
the irreversibility of this option, the cost reduction might not justify the loss of service quality. Strategy
3 allowed the improvement of service quality, namely regarding the Myocardial Perfusion exam, however, with the studied schedule, the improvements in the general unit performance indicators were not
significant.
The results of this simulation evaluation provided clear insights about Atomedical operations. Most
of the results supported what unit managers already knew from their experience. Nevertheless, DES
helped to them preview some of the strategies they were considering. Despite corroborating some
effects of the options in study, the level of impact of some of them sustain further review and study
regarding the efficiency and effectiveness in current and future scenarios.
88
8
Final remarks
89
During this work, the Decision Problem of Atomedical unit managers was explored using a new
Scenarios Planning methodology. This framework provided a tool to address the uncertainty of the
problem, both in the Atomedical context and in unit operations. This was possible by integrating in the
study of Atomedical operations a full procedure of Scenarios Planning with the methodology of DES.
The Scenarios Planning methodology provides a framework to study the complexity of the problem
that unit managers face in Atomedical. The process of understanding Atomedical as a system, and
identifying the variables of the problem provided to the unit managers further insight of it. The identification of all variables is impossible, but a deep analysis of the unit operation dynamics allowed to
explore main variables that influence the patients examination. It is depended of the internal variables,
where the operational uncertainty resides, but also on the input variables, that are influenced by an
uncertainty of the unit context. Problem objectives were highly based in the operations. Therefore,
one could identify the problem variables as those that might influence operations. They are directly
related to unit examination tasks, resources, and inputs. Structuring the problem and the operations
as a systems allows to simplify its analysis.
Variables in a system are dynamic, as they establish relations between them. The influence and
dependence between variables is of extreme importance to understand the system behavior. It allows the focus in a core of interesting variables that guide the system response to internal and external
changes. The use tools to explore the relations between variables revealed of high interest on underlying relations that were not intuitive to unit managers, but significant to understand the problem.
The results were obtained from the subjective classification of variables by unit managers. Although,
they resulted to be very objective, by correctly describing the known and the background relations
that drive the problem in Atomedical. The use of tools that allow to quantify the description of the
problem is very important to address the subjectivity inherent to a Scenarios Planning methodology.
The identification of the key variables of the problem is the core part of the methodology. They allow
to simplify further the system analysis, without losing from it important information about the problem.
The parameters of choice of the key variables were already presented in an informal way in the process of identification of the system variables. Therefore, the number of variables excluded in that step
was reduced.
From the key variables, one was able to construct scenarios and strategies. This part is highly
subjective. The aim is to identify scenarios and strategies that allows one to study the system, getting
the possible information towards the futures of the unit. For this purpose, few tools exist, and they only
provide support to structure the process. By successfully analyzing the problem and the characterization of the system in the initial steps of Scenarios Planning, unit managers were provided with enough
information to support a more objective choice of each variable options. However, the construction
of scenarios and strategies in such operational problem, as the one of Atomedical, needs to focus in
fewer, but coherent and complementary, scenarios. Scenarios and strategies need to cover the field
of possible changes in the context and quantify them at the level of the system inputs and parameters.
Exploring systematically all the possibilities in such multi-variable problem was a limitation of the pro90
posed methodology. It missed, sometimes, to remain objective, since it was depended almost only on
the unit managers perspectives and knowledge. This limitation is common to all Scenarios Planning
methodologies and only minimized by the deeper knowledge of the system from the previous analysis. Nevertheless, the scenarios and strategies constructed from the Atomedical problem were able
to provide a wide exploration of the system uncertainty, minimizing the number of total scenarios and
strategies to be simulated. Using this methodology one has to balance the number of scenarios to
be evaluated and the additional information provided. Applying Scenarios Planning in strategic problems, and focused in operations, one has to take into account the short time to explore the several
scenarios. This was the case of this work in Atomedical.
With the Atomedical proposed scenarios and strategies, one was able to explore the internal
uncertainty regarding the unit response to context changes. DES model allowed to represent the
system complexity, its variables and interactions. The problem objectives could have been addressed
using mathematical models, in order to support the use of optimization tools, for instance, on the
scheduling plan. However, they could not represent the complexity of the Atomedical system in a
feasible manner. However, using DES within the Scenarios Planning methodology, it supported a
sort of sensitivity analysis of the system, that enrich the knowledge obtained. Despite of that, further
work could be used to study the financial performance of Atomedical and to optimize unit operation
parameters, now that the existing uncertainties were identified and characterized.
The results of the evaluation of simulations provided further information regarding the impacts of
the scenarios and strategies in the objectives of the decision problem. The schedule plan is the more
important tool of the management. Patients of the Myocardial Perfusion exam are the more affected
by operational changes. The analysis of results should support the development of new and better
strategies in Atomedical.
The proposed framework of Scenarios Planning allows to overcome much of the subjectivity of
the exploration of uncertainty. Further work could take advantages of the integration of data and
information from the different stakeholders to tackle it. An integration of optimization techniques,
focused in the variables identified in Scenarios Planning would be an important development in the
support of unit managers, if combined with the DES that addresses the complexity of the system.
Regarding the application of the methodology in Atomedical, the results of DES could have been
used to explore the financial aspect of the unit operations. Using the resulting data of number of
exams and resources used, one might in a future work provide unit managers more information about
the cost of individual exams, to guide their prices strategies.
The results of this methodology do not aim to provide unit managers a solution for their problem,
but rather a deeper understanding of it. The Scenarios Planning methodology was successful in
exploring the uncertainty of Atomedical problem, and providing a framework to deal with it in their
choices. Learning how different contexts influence the unit, and the impact of different strategies,
provides unit managers the tools to tackle future realization of path explored in scenarios.
91
92
Bibliography
Als, C. (2007). Optimizing patient throughput in nuclear medicine: a semi-quantitative tool for scheduling bone scintigraphy. European journal of nuclear medicine and molecular imaging, 34(12):2145–
6.
Angelis, V. D., Felici, G., and Impelluso, P. (2003). Integrating simulation and optimisation in health
care centre management. European Journal of Operational Research, 150(1):101–114.
Ansoff, H. I. (1975). Managing strategic surprise by response to weak signals. California Management
Review, 18(2):21–34.
Apeldoorn, R. C., Knaapen, J. P., Schippers, P., Verboom, J., Van Engen, H., and Meeuwsen, H.
(1998). Applying ecological knowledge in landscape planning: a simulation model as a tool to
evaluate scenarios for the badger in the Netherlands. Landscape and Urban Planning, 41(1):57–
69.
Arcade, J., Godet, M., Meunier, F., and Roubelat, F. (1999). Structural analysis with the MICMAC
method & Actor’s strategy with MACTOR method. Futures Research Methodology, American Council for the United Nations University: The Millennium Project, pages 1–69.
Atabakhsh, H. (1991). A survey of constraint based scheduling systems using an artificial intelligence
approach. Artificial Intelligence in Engineering, 6(2):58–73.
Azevedo, A. (2010). Melhoria de Processos em unidades de cuidados de saúde : Desenvolvimento
de modelos com aplicação a uma unidade de Medicina Nuclear Atomedical Engenharia Biomédica.
Tese de mestrado, Instituto Superior Técnico.
Badri, M. (1996). A two-stage multiobjective scheduling model for [faculty-course-time] assignments.
European Journal of Operational Research, 94(1):16–28.
Bailey, N. (1954). Queueing for medical care. Applied Statistics, 3(3):137–145.
Barros, P. P., Machado, S. R., and Simões, J. D. A. (2011). Portugal: Health system review. Health
Systems in Transition, 13(4).
Beasley, J. and Caos, B. (1998). A dynamic programming based algorithm for the crew scheduling
problem. Computers and Operations Research, 25(7-8):567–582.
93
Billiau, G., Chang, C., and Miller, A. (2010). Support-based distributed optimisation: an approach to
radiotherapy patient scheduling. Studies in health.
Brien, P. O. (2003). Scenario Planning A Strategic Tool. Forestry, 152(3):185–195.
Browning, T. (2001). Applying the design structure matrix to system decomposition and integration
problems: a review and new directions. Engineering Management, IEEE Transactions, 48(3):292–
306.
Burt, G. (2010). Towards the integration of system modelling with scenario planning to support strategy: the case of the UK energy industry. Journal of the Operational Research Society, 62(5):830–
839.
Cameron, R. G., Dugdale, R. E., and Page, M. (2006). A capacity planning simulation model and its
application to a nuclear medicine service. In European Simulation and Modelling Conference (ESM
2006), pages 68–72, Toulose, France.
Castro, E. and Petrovic, S. (2011). Combined mathematical programming and heuristics for a radiotherapy pre-treatment scheduling problem. Journal of Scheduling, (Mackillop 2007).
Cayirli, T., Veral, E., and Rosen, H. (2006). Designing appointment scheduling systems for ambulatory
care services. Health Care Management Science, 9(1):47–58.
Centeno, M. A., Giachetti, R. R. L., and Ismail, A. M. (2003). A simulation-ILP based tool for scheduling ER staff. In Proceedings of the 2003 Winter Simulation Conference, number 1998, pages
1930–1938. Ieee.
Charnetski, J. (1984). Scheduling operating room surgical procedures with early and late completion
penalty costs. Journal of Operations Management, 5(1):91–102.
Chermack, T. (2004). Improving decision-making with scenario planning. Futures, 36(3):295–309.
Chern, C., Chien, P., and Chen, S. (2008). A heuristic algorithm for the hospital health examination
scheduling problem. European Journal of Operational Research, 186(3):1137–1157.
Chetouane, F., Barker, K., and Viacaba Oropeza, A. S. (2012). Sensitivity analysis for simulationbased decision making: Application to a hospital emergency service design. Simulation Modelling
Practice and Theory, 20(1):99–111.
Cinar, D. and Kayakutlu, G. (2010). Scenario analysis using Bayesian networks: A case study in
energy sector. Knowledge-Based Systems, 23(3):267–276.
Coelli, F. C., Ferreira, R. B., Almeida, R. M. V. R., and Pereira, W. C. (2007). Computer simulation and
discrete-event models in the analysis of a mammography clinic patient flow. Computer methods
and programs in biomedicine, 87(3):201–7.
Conforti, D., Guerriero, F., and Guido, R. (2010). Non-block scheduling with priority for radiotherapy
treatments. European Journal of Operational Research, 201(1):289–296.
94
Cornelius, P., Putte, A. V. D., and Romani, M. (2005). Three Decades of Scenario Planning in Shell.
California Management Review, 48(1):20.
Côté, M. (1999). Patient flow and resource utilization in an outpatient clinic. Socio-Economic Planning
Sciences, 33(3):231–245.
Davis, P. K., Bankes, S. C., and Egner, M. (2007). Enhancing Strategic Planning with Massive Scenario Generation - Theory and Experiments. Technical report, RAND Corporation.
Dean, B., van Ackere, A., Gallivan, S., and Barber, N. (1999). When should pharmacists visit their
wards? An application of simulation to planning hospital pharmacy services. Health care management science, 2(1):35–42.
Deloitte (2011). Saúde em análise Uma visão para o futuro. Technical report.
Denton, B., Rahman, A., Nelson, H., and Bailey, A. (2006a). Simulation of a multiple operating room
surgical suite. In Proceedings of the 38th conference on Winter simulation, pages 414–424. Winter
Simulation Conference.
Denton, B., Viapiano, J., and Vogl, A. (2006b). Optimization of surgery sequencing and scheduling
decisions under uncertainty. Health Care Management Science, 10(1):13–24.
Dexter, F. (1999). Design of appointment systems for preanesthesia evaluation clinics to minimize
patient waiting times: a review of computer simulation and patient survey studies. Anesthesia and
analgesia, 89(4):925–31.
Dexter, F., Macario, A., Traub, R. D., Hopwood, M., and Lubarsky, D. a. (1999). An operating room
scheduling strategy to maximize the use of operating room block time: computer simulation of
patient scheduling and survey of patients’ preferences for surgical waiting time. Anesthesia and
analgesia, 89(1):7–20.
Eelman, S. (2006). An enhanced scenario approach assessing uncertaintes in the realization of new
aircraft and technologies. In 25th International Congress of The Auronautical Sciences.
Ellis, B. W., Rivett, R. C., and Dudley, H. A. (1990). Extending the use of clinical audit data: a resource
planning model. BMJ (Clinical research ed.), 301(6744):159–62.
Enzmann, D. R., Beauchamp, N. J., and Norbash, A. (2011). Scenario planning. Journal of the
American College of Radiology JACR, 8(3):175–179.
Ernst, A., Jiang, H., Krishnamoorthy, M., and Sie, D. (2004). Staff scheduling and rostering: A review
of applications, methods and models. European Journal of Operational Research, 153(1):3–27.
Evans, G. W. and Unger, E. (1996). A Simulaton Model for Evaluating Personnel Schedules in a
Hospital Emergency Department. In Charnes, J. M., Morrice, D. J., Brunner, D. T., and Swin, J. J.,
editors, Proceedings of the 1996 Winter Simulation Conference, pages 1205–1209.
95
Fernandes, J. a. T. S. (2007). Discrete-Event Simulation as a Decision-Support Tool to Help Management of a Private Nuclear Medicine Unit NuclearMed: Hospital Particular de Almada. PhD thesis,
Instituto Superior Técnico.
Fone, D., Hollinghurst, S., Temple, M., Round, A., Lester, N., Weightman, A., Roberts, K., Coyle, E.,
Bevan, G., and Palmer, S. (2003). Systematic review of the use and value of computer simulation
modelling in population health and health care delivery. Journal of Public Health, 25(4):325–335.
Freeman, O. and Pattinson, H. M. (2010). Exploring client scenarios associated with scenario planning. Futures, 42(4):304–312.
Georgantzas, N. C. and Acar, W. (1995). Scenario-Driven Planning. Quorum.
Geus, A. D. (1999). The Living Company: Growth Learning and Longevity in Business. Nicholas
Brealey Publishing.
Glick, N. D., Blackmore, C. C., and Zelman, W. N. (2000). Extending simulation modeling to activitybased costing for clinical procedures. Journal of medical systems, 24(2):77–89.
Gocgun, Y., Bresnahan, B. W., Ghate, A., and Gunn, M. L. (2011). A Markov decision process approach to multi-category patient scheduling in a diagnostic facility. Artificial intelligence in medicine,
53(2):73–81.
Godet, M. (2006). Creating Futures: Scenarios Planning as a Strategic Management Tool. Economica.
Godet, M. and Durance, P. (2008). Strategic Foresight La Prospective Use and Misuse of Scenario
Building.
Godet, M. and Roubelat, F. (1996). Creating the future: the use and misuse of scenarios. Long range
planning, 29(2):164–171.
Goitein, M. (1990). Waiting patiently. The New England journal of medicine, 323(9):604–8.
Goodwin, P. and Wright, G. (2001). Enhancing Strategy Evaluation in Scenario Planning: a Role for
Decision Analysis. Journal of Management Studies, 38(1):1–16.
Gordon, A. (2008). Future Savvy: Identifying Trends to Make Better Decisions, Manage Uncertainty,
and Profit from Change. Amacom, New York.
Gulpnar, N. (2004). Simulation and optimization approaches to scenario tree generation. Journal of
Economic Dynamics and Control, 28(7):1291–1315.
Günal, M. M. and Pidd, M. (2010). Discrete event simulation for performance modelling in health care:
a review of the literature. Journal of Simulation, 4(1):42–51.
Hannebauer, M. and Müller, S. (2001). Distributed constraint optimization for medical appointment
scheduling. Proceedings of the fifth international conference on Autonomous agents - AGENTS
’01, pages 139–140.
96
Harper, P. and Gamlin, H. (2003). Reduced outpatient waiting times with improved appointment
scheduling: a simulation modelling approach. OR Spectrum, 25(2):207–222.
Hashimoto, F. and Bell, S. (1996). Improving outpatient clinic staffing and scheduling with computer
simulation. Journal of general internal medicine, 11(3):182–4.
Ho, C. (1999). Evaluating the impact of operating conditions on the performance of appointment
scheduling rules in service systems. European Journal of Operational Research, 112(3):542–553.
Ho, C. and Lau, H. (1992). Minimizing Total Cost in Scheduling Outpatient Appointments. Management Science, 38(12):1750–1764.
Hoogeveen, H. (2005).
Multicriteria scheduling.
European Journal of Operational Research,
167(3):592–623.
Huss, W. and Honton, E. (1987). Scenario planning: What style should you use?
Long range
planning, 20(4):21–29.
Islei, G., Lockett, G., and Naudé, P. (1999). Judgemental modelling as an aid to scenario planning
and analysis. Omega, 27(1):61–73.
Jain, A., Murty, M., and Flynn, P. (1999). Data clustering: a review. ACM computing surveys (CSUR),
31(3):264–323.
Johannes, J. D. and Wyskida, R. M. (1978). A nuclear medicine patient/instrument scheduling model.
Omega, 6(6):523–530.
Johansson, B., Jain, S., Montoya-Torres, J., and Hugan, J. (2010). Outpatients appointment scheduling with multi-doctor sharing resources. In Johansson, B., Jain, S., Montoya-Torres, J., Hugan, J.,
and Yucesan, E., editors, Proceedings of the 2010 Winter Simulation Conference, pages 3318–
3329.
Johnston, M., Gilmore, A., and Carson, D. (2008). Dealing with environmental uncertainty: The value
of scenario planning for small to medium-sized entreprises (SMEs). European Journal of Marketing,
42(11/12):1170–1178.
Karvetski, C., Lambert, J., Keisler, J., and Linkov, I. (2011). Integration of decision analysis and
scenario planning for coastal engineering and climate change. Transactions on Systems, Man and
Cybernetics, 41(1):63–73.
Katz, J. H. (1969). Simulation of outpatient appointment systems. Communications of the ACM,
12(4):215–222.
Khor, C., Elkamel, A., Ponnambalam, K., and Douglas, P. (2008). Two-stage stochastic programming with fixed recourse via scenario planning with economic and operational risk management
for petroleum refinery planning under uncertainty. Chemical Engineering and Processing: Process
Intensification, 47(9-10):1744–1764.
97
Klassen, K. J. and Rohleder, T. R. (1996). Scheduling outpatient appointments in a dynamic environment. Journal of Operations Management, 14(2):83–101.
Klassen, K. J. and Yoogalingam, R. (2009).
Improving Performance in Outpatient Appointment
Services with a Simulation Optimization Approach.
Production and Operations Management,
18(4):447–458.
Klayman, J. (1993). Thinking about the future: A cognitive perspective. Journal of Forecasting,
(12):161–168.
Kolesar, P. (1970). A Markovian Model for Hospital Admission Scheduling. Management Science,
16(6):B–384–B–396.
Kuban Altinel, I., Ulas, E., Altmel, K., and Ula, E. (1996). Simulation modeling for emergency bed
requirement planning. Annals of Operations Research, 67(1):183–210.
Law, A. M. and Kelton, W. D. (2007). Simulation Modeling and Analysis. Mc Graw Hill, third edition.
Lee, Y.-C., Chao, Y. H., and Lin, S.-B. (2010). Structural approach to design user interface. Computers
in Industry, 61(7):613–623.
Lempert, R., Popper, S., and Bankes, S. (2003). Shaping the Next One Hundred Years: New Methods
for Quantitative, Long-term Policy Analysis. Technical Report 3, RAND, Santa Monica.
Lev, B. (1976). Patient flow analysis and the delivery of radiology service. Socio-Economic Planning
Sciences, 10(4):159–166.
Lexa, F. J. and Chan, S. (2010). Scenario analysis and strategic planning: practical applications for
radiology practices. Journal of the American College of Radiology : JACR, 7(5):369–73.
Luzon, Y., Penn, M., and Mandelbaum, A. (2009). Fluid based resource allocation and appointment
cheduling system and method.
MacKay, B. and McKiernan, P. (2010). Creativity and dysfunction in strategic processes: The case of
scenario planning. Futures, 42(4):271–281.
Mahmud, J. (2011). City foresight and development planning case study: Implementation of scenario
planning in formulation of the Bulungan development plan. Futures, 43(7):697–706.
Maria, A. (1997). Introduction to modeling and simulation. In Andradóottir, S., Healy, K. J., Withers,
D. H., and Nelson, B. L., editors, Proceedings of the 1997 Winter Simulation Conference, pages
7–13.
Masterson, B. J., Mihara, T. G., Miller, G., Randolph, S. C., Forkner, M. E., and Crouter, A. L. (2004).
Using models and data to support optimization of the Military Health System: a case study in an
intensive care unit. Health care management science, 7(3):217–24.
98
McManus, H. and Hastings, D. (2006). A framework for understanding uncertainty and its mitigation
and exploitation in complex systems. IEEE Engineering Management Review, 34(3):81–94.
Merode, G. V., Hasman, A., Derks, J., Schoenmaker, B., and Goldschmidt, H. (1996). Advanced
management facilities for clinical laboratories. Computer methods and programs in biomedicine,
50(2):195–205.
Min, D. and Yih, Y. (2010). Scheduling elective surgery under uncertainty and downstream capacity
constraints. European Journal of Operational Research, 206(3):642–652.
Mittal, S. and Stiller, S. (2011). Robust Appointment Scheduling. mit.edu.
Morgan, M., Kandlikar, M., Risbey, J., and Dowlatabadi, H. (1999). Why conventional tools for policy
analysis are often inadequate for problems of global change. Climatic Change, 41(3):271–281.
Morgan, M. G. and Henrion, M. (1990). Uncertainty: A Guide to Dealing with Uncertainty in Quantitative Risk and Policy Analysis. Cambridge University Press.
Muthuraman, K. and Lawley, M. (2008).
A stochastic overbooking model for outpatient clinical
scheduling with no-shows. IIE Transactions, 40(9):820–837.
Nagar, A., Haddock, J., and Heragu, S. (1995). Theory and Methodology Multiple and bicriteria
scheduling : A literature survey. European Journal Of Operational Research, 81:88–104.
Neiner, J. A., Howze, E. H., and Greaney, M. L. (2004). Using scenario planning in public health:
anticipating alternative futures. Health promotion practice, 5(1):69–79.
Nickel, S. and Schmidt, U.-A. (2009). Process improvement in hospitals: a case study in a radiology
department. Quality management in health care, 18(4):326–38.
O’Brien, F. (2011). Supporting the strategy process: a survey of UK OR/MS practitioners. Journal of
the Operational Research Society, 62(5):900–920.
Ozcan, Y. (2009). Quantitative methods in health care management: techniques and applications,
volume 36. Jossey-Bass Inc Pub, second edition.
Page, S. J., Yeoman, I., Connell, J., and Greenwood, C. (2010). Scenario planning as a tool to understand uncertainty in tourism: the example of transport and tourism in Scotland in 2025. Current
Issues in Tourism, 13(2):99–137.
Papageorgiou, G., Damianou, P., Pitsillides, A., Aphamis, T., Charalambous, D., and Ioannou, P.
(2009). Modelling and Simulation of Transportation Systems: a Scenario Planning Approach. AUTOMATIKA: Journal for Control, Measurement, Electronics, Computing and Communications, 50(12):39–50.
Patrick, J. and Puterman, M. L. (2008). Reducing Wait Times through Operations Research: Optimizing the Use of Surge Capacity. Healthcare policy = Politiques de santé, 3(3):75–88.
99
Pérez, E., Ntaimo, L., Bailey, C., and McCormack, P. (2010). Modeling and simulation of nuclear
medicine patient service management in DEVS. Simulation, pages 1–28.
Pérez, E., Ntaimo, L., Bailey, C., Wilhelm, W., and McCormack, P. (2011). Patient and resource
scheduling of multi-step medical procedures in nuclear medicine. IIE Transactions on Healthcare
Systems Engineering, 1(3):168–184.
Phelps, R., Chan, C., and Kapsalis, S. (2001). Does scenario planning affect performance? Two
exploratory studies. Journal of Business Research, 51(3):223–232.
Pidd, M. (2003). Tools for thinking: modelling in management science, volume 1987. Wiley, second
edition.
Podgorelec, V. and Kokol, P. (1997). Genetic algorithm based system for patient scheduling in highly
constrained situations. Journal of medical systems, 21(6):417–27.
Postma, T. J. B. M. and Liebl, F. (2005). How to improve scenario analysis as a strategic management
tool? Technological Forecasting and Social Change, 72(2):161–173.
Potts, C. (2000). Scheduling with batching: a review. European Journal of Operational Research,
120(2):228–249.
Ram, C., Montibeller, G., and Morton, A. (2011). Extending the use of scenario planning and MCDA
for the evaluation of strategic options. Journal of the Operational Research Society, 62(5):1–13.
Ramwadhdoebe, S., Buskens, E., Sakkers, R. J. B., and Stahl, J. E. (2009). A tutorial on discreteevent simulation for health policy design and decision making: optimizing pediatric ultrasound
screening for hip dysplasia as an illustration. Health policy (Amsterdam, Netherlands), 93(2-3):143–
50.
Rawluk, A. and Godber, A. (2011). Widening the Scope of Scenario Planning in Small Communities:
a Case Study Use of an Alternative Method. Ecology and Society, 16(1):11.
Rettig, P. (1998). Scenario planning: a tool for healthcare organizations. The Bristol Review, 2:3–4.
Ringland, G. (2006). Scenario Planning. John Wiley & Sons, second edition.
Rising, E. J., Baron, R., and Averill, B. (1973). A Systems Analysis of a University-Health-Service
Outpatient Clinic. Operations Research, 21(5):1030–1047.
Rogers, J., Korte, J., and Bilardo Jr, V. (2006). Development of a Genetic Algorithm to Automate
Clustering of a Dependency Structure Matrix. Technical Report February, NASA Technical Reports
Server (NTRS).
Rohleder, T. (2000). Using client-variance information to improve dynamic appointment scheduling
performance. Omega, 28(3):293–302.
100
Rohleder, T. R. and Klassen, K. J. (2002). Rolling horizon appointment scheduling: a simulation study.
Health care management science, 5(3):201–209.
Ruohonen, T., Neittaanmaki, P., and Teittinen, J. (2006). Simulation model for improving the operatio
of the emergency department of special health care. In Perrone, L. F., Wieland, F. P., Liu, J.,
Lawson, B. G., Nicol, D. M., and Fujimoto, R. M., editors, Proceedings of the 2006 Winter Simulation
Conference, pages 453–458.
Sangal, N., Jordan, E., and Sinha, V. (2005). Using dependency models to manage complex software
architecture. ACM Sigplan Notices.
Santibáñez, P., Begen, M., and Atkins, D. (2007). Surgical block scheduling in a system of hospitals:
an application to resource and wait list management in a British Columbia health authority. Health
Care Management Science, 10(3):269–282.
Schoemaker, P. (1991). When and how to use scenario planning: A heuristic approach with illustration. Journal of forecasting, 10(6):549–564.
Schoemaker, P. J. H. (1995). Scenario planning: A tool for strategic thinking. Journal of Product
Innovation Management, 12(4):355–356.
Spyropoulos, C. D. (2000). AI planning and scheduling in the medical hospital environment. Artificial
intelligence in medicine, 20(2):101–11.
Stahl, J. E., Roberts, M. S., and Gazelle, S. (2003). Optimizing management and financial performance of the teaching ambulatory care clinic. Journal of general internal medicine, 18(4):266–74.
Standridge, C. R. (1999). A tutorial on simulation in health case: applications and issues. In P. A.
Farrington, Nembhurd, H. B., Sturrock, D., and W.Evans, G., editors, Proceedings of the I999 Winter
Simulation Conference, pages 49–55.
Stewart, T. and Scott, L. (1995). A scenario-based framework for Multi-criteria Decision Analysis in
Water Resources Planning. Water Resources Research, 31(11):2835–2843.
Stewart, T. J. (2005). Dealing with Uncertainties in MCDA. In Figueira, J., Greco, S., and Ehrgott,
M., editors, Multiple criteria decision analysis: state of the art surveys, volume 78, pages 445–470.
Kluwer Academic Publishers.
Su, S. (2003). Managing a mixed-registration-type appointment system in outpatient clinics. International Journal of Medical Informatics, 70(1):31–40.
Tevis, R. E. (2010). Creating the future: Goal-oriented Scenario Planning. Futures, 42(4):337–344.
Tietje, O. (2005). Identification of a small reliable and efficient set of consistent scenarios. European
Journal of Operational Research, 162(2):418–432.
101
van Merode, G. G., Hasman, A., Derks, J., Goldschmidt, H. M., Schoenmaker, B., and Oosten, M.
(1995). Decision support for clinical laboratory capacity planning. International journal of BioMedical Computing, 38(1):75–87.
Varum, C. A. and Melo, C. (2010). Directions in scenario planning literature: A review of the past
decades. Futures, 42(4):355–369.
Venable, J. M., Ma, Q. L., Ginter, P. M., and Duncan, W. J. (1993). The use of scenario analysis in
local public health departments: alternative futures for strategic planning. Public Health Reports,
108(6):701–10.
Vicente, A. G., Castrejón, A. S., Delgado, C. M., García, V. P., Solís, S. R., Romera, M. C., Marina,
S. R., Rubio, M. T., and Muñoz, M. P. (2007). Patient satisfaction as quality indicator in a Nuclear
Medicine Department. Revista Española de Medicina Nuclear (English Edition), 26(3):146–152.
Visser, M. P. and Chermack, T. J. (2009). Perceptions of the relationship between scenario planning
and firm performance: A qualitative study. Futures, 41(9):581–592.
Vissers, J. and Beech, R. (2005). Health Operation Managment: Patient flow logistics in health care.
Routledge, Oxon.
Wagner, M., West, C., and Guo, M. (2004). Outpatient Clinic Scheduling - A Simulation Approach.
In Ingalls, R. G., Rossetti, M. D., Smith, J. S., and Peters, B. A., editors, Proceedings of the 2004
Winter Simulation Conference, volume 2, pages 1981–1987. Ieee.
Wang, L. (2009). An Agent-based Simulation for Workflow in Emergency Department. In Proceedings
of the 2009 IEEE Systems and Information, pages 19–23, Charlottesville, VA, USA. IEEE.
Webb, A. (2003). Introduction to Biomedical Imaging. John Wiley & Sons.
Whitacre, J., Abbass, H., Sarker, R., Bender, A., and Baker, S. (2008). Strategic positioning in tactical
scenario planning. In Proceedings of the 10th annual conference on Genetic and evolutionary
computation, pages 1081–1088. ACM.
Wijewickrama, A. and Takakuwa, S. (2005). Simulation analysis of appointment scheduling in an
outpatient department of internal medicine. In Kuhl, M. E., Steiger, N. M., Armstrong, F. B., and
Joines, J. A., editors, Proceedings of the 2005 Winter Simulation Conference, number 1952, pages
2264–2273.
Wijewickrama, A. and Takakuwa, S. (2008). Outpatient appointment schduling in a multi facility system. In Proceedings of the 40th Conference on Winter Simulation, number 1996, pages 1563–1571.
Winter Simulation Conference.
Williams, P., Tai, G., and Lei, Y. (2009). Simulation based analysis of patient arrival to health care
systems and evaluation of an operations improvement scheme. Annals of Operations Research,
178(1):263–279.
102
Wittenberg, A. (2009). Emerging Risks: Strategic Decision-Making in the Face of Uncertainty. Technical report, Finantial Times Research and Oliver Wyman.
Wollenberg, E., Edmunds, D., and Buck, L. (2000). Using scenarios to make decisions about the
future: anticipatory learning for the adaptive co-management of community forests. Landscape and
Urban Planning, 47(1-2):65–77.
Woude, D. V., Damgaard, G., Hegge, M. J., Soholt, D., and Bunkers, S. S. (2003). The Unfolding:
Scenario Planning in Nursing. Nursing Science Quarterly, 16(1):27–35.
Wright, G., Cairns, G., and Goodwin, P. (2009). Teaching scenario planning: Lessons from practice
in academe and business. European Journal of Operational Research, 194(1):323–335.
Wright, G., Vanderheijden, K., Burt, G., Bradfield, R., and Cairns, G. (2008). Scenario planning interventions in organizations: An analysis of the causes of success and failure. Futures, 40(3):218–236.
Xie, Y. and Xie, L. (2008). Application of System Dynamics to Enterprise Financial Scenario Planning.
2008 4th International Conference on Wireless Communications, Networking and Mobile Computing, pages 1–5.
Yu, T.-L., Goldberg, D. E., Sastry, K., Lima, C. F., and Pelikan, M. (2009). Dependency structure
matrix, genetic algorithms, and effective recombination. Evolutionary computation, 17(4):595–626.
Zaki, A. A. S., Cheng, H. H. K., and Parker, B. B. R. (1997). A simulation model for the analysis and
management of an emergency service system. Socio-Economic Planning Sciences, 31(3):173–
189.
103
104
A
Literature review in the scheduling
problem in health care units
A-1
A-2
Table A.1: Table of Literature in the Scheduling Problem in Health Care Units
Table of Literature in the Scheduling Problem
Reference
Context
Problem
Methodology
Results
Bailey [1954]
Generic Medical Care
Facilities
Queueing in inpatient, outpatient care and Appointment
System for a Clinic Session
Statistical Theory
of Queues using
Monte-Carlo type
investigation
Simple variations in the number of beds may largely reduce the waiting-lists in inpatient
care. Waiting time in outpatient care can be mathematical predicted under intervals according with the average demand and available supply. The number of patients set in an
appointment block is directly correlated with the average waiting-time and indirectly correlated with the consultant average idle period in a clinical session.
Katz [1969]
Generic outpatients departments of hospitals
Appointment systems performance
DES
A simulator that enables a user to evaluate the effectiveness of an alternative appointment
systems in a given clinical environment.
Kolesar [1970]
Generic Medical Care
Facilities
Hospital Services Admission
Scheduling
Linear
ming
Program-
Linear Programming Markovian decision model is presented as an alternative to both analytic queuing and computer simulation, allowing a greater flexibility than the first, with more
efficiency than the second.
Rising et al. [1973]
A university health service outpatient clinic
Daily arrival patterns of patients and scheduling policy.
Monte Carlo simulation model
Alternative decision rules for scheduling appointment periods during the day lead to an increase patient throughput and physician utilization. Subsequent real-world results demonstrated the validity of the models predictions.
Lev [1976]
Diagnostic Radiology
Department at Temple
University
Management systems
scheduling techniques
Data Analysis
The scheduling techniques, and improved utilization of available equipment contribute to
a better service to patients rather than providing more technicians and orderlies are available, in the studied case.
Johannes
and
Wyskida [1978]
Clinical
arMedicine
Nucle-
Scheduling
patients
and
clinical instruments for each
physician requested Nuclear
Medicine study
Computerized
heuristic model
Heuristic showed to be able to provide a good basic schedule for use in Clinical Nuclear
Medicine.
Charnetski [1984]
Hospital
suites
operating
Scheduling operating room
surgical procedures with early
and late completion penalty
costs
Mathematical
model
and
a
two-stage
Monte
Carlo programming
model
Solutions provided capacity/utilization ranges for effective scheduling to either minimize or
equalize the two types of costs.
and
continued on next page
continued from previous page
Table of Literature in the Scheduling Problem
Methodology
Results
Reference
Context
Problem
Goitein [1990]
Massachusetts General
Hospital Boston
Patients consultations
pointment
Ho and Lau [1992]
Scheduling
appointments for medical clinic
outpatients
Klassen
and
Rohleder [1996]
Monte Carlo simulation
Patients’ average waiting time and physician’s idle time per patient
Performance in waiting and
idle times in different scheduling rules
DES
A simple procedure for identifying the best scheduling rule for given environmentalparameter values
Family practice outpatient clinic
Medical outpatient appointment
DES
It was possible to improve considerably on some of the "best" rules found in the existing
literature, by using multiple performance measures. The "best" decisions depend on the
goals of the particular clinic as well as the environment it encounters. However, good
or best results were obtained in all cases that clients with large service time standard
deviations are scheduled toward the end of the appointment session.
Merode et al. [1996]
Facilities for clinical laboratories
Determining the performance
of planning rules given the
equipment and staffing of the
clinical laboratory and the demand for laboratory services
DES
Rules which are considered effective in industry perform not so well as several of the
alternative rules investigated in the experiments.
Hashimoto and Bell
[1996]
Internal Medicine Clinic
Evaluate patients spent time
in clinical steps.
DES
Changes in the number of staff and their performance have an effect in the time spent by
patients.
Podgorelec
Kokol [1997]
and
Small specialized therapy studios
Scheduling patients with different physical therapy needs
to a limited number of therapeutic devices and a limited
number of therapists
Optimization using
Machine
Learning and Genetic
Algorithm
New method for patient scheduling under highly constrained conditions using effective and
low computing resources consumptions, adequate for very complex problems.
Hannebauer
Müller [2001]
and
Medical Diagnostic Unit
Medical appointment scheduling
Distributed
constraint optimization
problem
System produces an optimized diagnostic unit calendar.
Harper and Gamlin
[2003]
Ear, Nose and Throat
Outpatient Department
Effects in the clinic of various
appointment schedules
DES
Identification of a number of critical factors that influence patient waiting times and of alternative appointment schedules that improve service without the need for extra resources.
Su [2003]
Outpatient Clinics
Analyze several scheduling
solutions
DES
Setting the appropriate arrival time interval for preregistered patients had significantly impact in the queuing problems in outpatient services.
Cayirli et al. [2006]
Outpatient Clinics
Scheduling
care visits
DES
Patient sequencing has a greater effect on ambulatory care performance than the choice of
an appointment rule, and that panel characteristics such as walk-ins, no-shows, punctuality
and overall session volume, influence the effectiveness of appointment systems.
of
ap-
ambulatory
A-3
continued on next page
A-4
continued from previous page
Reference
Context
Problem
Table of Literature in the Scheduling Problem
Methodology
Results
Denton
[2006a]
et
al.
Mayo
Clinic
Rochester, MN
in
Outpatient surgery scheduling
Monte-Carlo simulation model
Model can be used to evaluate multiple competing criteria for different staffing scenarios,
and a simple scheduling heuristic based on the scheduling of the bottleneck (surgery)
activity can lead to simultaneous improvements in expected patient waiting time and overtime.
Denton
[2006b]
et
al.
Mayo
Clinic
Rochester, MN
in
Outpatient surgery scheduling
Two-stage stochastic
programming
model
A simple sequencing rule based on surgery duration variance can be used to generate
substantial reductions in total surgeon and outpatient surgery team waiting, idling and
overtime costs.
Coelli et al. [2007]
Brazilian Cancer Institute, Rio de Janeiro,
Brazil
Mammography Clinic performance
DES
The exam repeat rates and equipment maintenance scheduling simulations indicated that
a large impact over patient waiting time would appear in the smaller capacity configurations. DES showed to be a useful tool for defining optimal operating conditions for the
studied clinics, indicating the most adequate capacity configurations and equipment maintenance schedules.
Santibáñez et al.
[2007]
Hospitals in a British
Columbia Health Authority
Schedule surgical blocks for
each specialty
Mixed integer programming model
Result showed that, without increasing post-surgical resources hospitals, is possible to
handle more cases by scheduling specialties differently.
Chern et al. [2008]
Two Large Hospitals in
Taiwan
Hospital health examination
scheduling problem
Binary integer programming
model
using a heuristic
algorithm
Proposed algorithm showed to be very efficient in solving the presented problem in its
specific complexity and constrains.
Wijewickrama and
Takakuwa [2008]
Large outpatient ward in
Nagoya university hospital
Evaluation of developed appointment systems form combinations of existing literature
rules
DES
Combined appointment systems rules lead to design most effectively than they work alone
in the performance of service waiting/idle time.
Patrick and Puterman [2008]
Generic
Surgery
Outpatient
Optimize the scheduling of
patients with multiple priorities
Markov
decision
processes,
linear
programming and
simulation
Shows how queuing theory provides managers with insights into the causes for excessive
wait times and the relation- ship between wait times and capacity.
Muthuraman
and
Lawley [2008]
Wishard Primary Care
Clinic of Indianapolis,
Indiana
Stochastic
Overbooking
Model for Outpatient Clinical
Scheduling with No-Shows
Multi-objective optimization
Results provided a natural stopping criterion for the over booking scheduling policy studied.
continued on next page
continued from previous page
Table of Literature in the Scheduling Problem
Methodology
Results
Reference
Context
Problem
Klassen and Yoogalingam [2009]
Outpatient Clinics
Improving Performance in
Outpatient
Appointment
Services
Optimization
DES
Billiau et al. [2010]
Generic
radiotherapy
department
Radiotherapy Scheduling
Dynamic
Distributed Constraint
Optimisation Problem
A scalable solution to provide a scheduling system which significantly improved hospital
efficiency.
Conforti
[2010]
al.
Generic
radiotherapy
department
Radiotherapy
Scheduling
Linear
Programming Optimization
The developed model can be used to increase the efficiency of patient treatment delivery,
since it is possible to reduce the waiting time from the therapeutic decision until the first
radiation treatment.
al.
Outpatient department
of general hospitals
Outpatients
appointment
scheduling with multi-doctor
sharing resources
DES
Results show that, under multiple-doctor and resource-sharing environment, collection of
the seemingly optimal appointment rules for individual doctors does not lead to optimal
performance for the system.
Min and Yih [2010]
Generic
Surgery
Optimal surgery schedule of
elective surgery patients with
uncertain surgery operations
and deterministic demand
Stochastic
mization
opti-
Obtained an optimal surgery schedule with respect to minimizing the total cost of patient
costs and overtime costs.
Castro and Petrovic
[2011]
Nottingham City Hospital
Radiotherapy
scheduling
pre-treatment
Optimization Multiobjective Model
Multi-objective problem can be solved as separated in single-objective optimisation problems with hierarchical objectives.
Gocgun
[2011]
Harborview
Center
Medical
Multi-category
patient
scheduling
decisions
in
computed tomography
Finite-horizon
Markov
decision
process (MDP)
Comparative study of an optimal policy with several intuitive, heuristic decision rules under
different scenarios. Sensitivity analyses were performed to evaluate the impact of specific
parameters on model outcomes.
Outpatient department
of general hospitals
Appointment scheduling problem
Robust optimization
framework
Average cost of the robust schedule is within 25% of the average cost of considered
stochastic optimal schedule.
Johansson
[2010]
Mittal and
[2011]
et
et
et
al.
Stiller
Outpatient
treatment
with
Integration of analytical and simulation method.
A-5
A-6
B
Atomedical problem analysis
B-1
B-2
I.1!
E.3!
Scheduling!
Plan!
E.1!
W.1!
Patient!
Looking for !
Exam!
Attendance!
waiting!
F.1!
Schedule
Exam!
R.9!
Emergency!
Patient!
W.2!
Waiting!
for!
Exam!
day!
E.2!
Schedule!
Patient!
Arrive!
Reception!
Staff!
W.3!
F.2!
Waiting for!
Exam!
Start!
Check-In!
W.5!
F.4!
Need
Preparation?!
!
No!
Yes!
F.8!
F.7!
Vacancy!
Waiting!
Image
Acquisition!
Image
Processing!
!
Need new
images?!
!
Yes!
F.5!
R.1!
Reception!
Staff!
R.2!
Patient
Preparation!
Reception!
Staff!
Pre-Exam !
Procedure!
R.5!
Nuclear
Medicine
Technicians!
Image
Acquisition
Equipment!
F.6!
R.3!
I.2!
Nuclear
Medicine
Technicians!
Daily
Radiopharm
aceutical!
Preparation!
Patient!
Departure!
F.11!
Exam!
Report!
Waiting!
Medical!
Report!
Delivery!
E.5!
Medical!
Reporting!
R.7!
Image
Processing
Equipment!
R.4!
No!
W.6!
F.10!
R.6!
W.4!
E.4!
F.9!
Exam !
Report!
R.8!
Nuclear
Medicine !
Doctor!
Radiopharmac
eutical!
Diagram'Legend:'
Management(Interven,on(
F.#!Process(Flow(
Management(
Staff !
Management!
I.3!
I.3!
Radioactive
Material!
Purchasing!
Equipment/
Facilities
Investment!
Process(or(Task(
I.#! Interven,on(
R.#!Resources(
Buffer(or(Queue((
Decision(or(Evalua,on(
Resources(
Input=Output(
External(
E.#!Interven,on((((
W.#!Pa,ent(Wai,ng(
Pa,ent(Flow(
Resources(Flow(
Influence(or(Effect(
Figure B.1: Atomedical general examination process flow chart. Management interventions (I.#) are those appointed by the unit manager as their possible interventions on the
system.
Table B.1: Atomedical Problem Variables and Analysis Results. Each variable is classified according the results of the used tools regarding the following dimensions: Importance/Impact, Influence, Dependence and Knowledge/Control. This support final classification made by unit managers, identifying the key variables, and classsifying them as:
strategy, scenario or signpost. The exclusion of variables due to corresponding to rare events is also expressed in the final classification.
Atomedical Problem Variables and Analysis Results
#
Name
1
2
3
4
5
6
7
8
9
10
11
Number of Administrative Staff
Schedule - Number of Unit Staff
Schedule - Unit Staff Working Hours
Schedule - Extra Working Hours of Unit Staff
Reception Staff Workload
NM Technicians Workload
NM Doctor Workload
Patients Scheduling
Patients Arriving Delay
Staff Assiduity
Lack of Prerequisites fulfillment by patients
12 Exams not performed due patient
13 NM Technicians Experience
14
15
16
17
18
19
20
Equipment Malfunction
Equipment Repairs
Frequency of Equipment Maintenance
Number of Equipments
Equipment Calibration
Equipment Workload
Image Processing Equipment Performance
Description
Atomedical Operations - People
Administrative Staff needed to support Atomedical Operations
Number of staff allocated to each unit task in each moment
Working hours assign to each unit staff
Extra working hours to perform all the day exams
Reception staff time allocated to tasks and idle time
NM Technicians time allocated to tasks and idle time
NM Doctors time allocated to tasks and idle time
Schedule for acceptance of patients to examinations
Time of patient arrive after appointment
Unexpected lack of staff member in unit
Number of patients not following prerequisites to exam in situation unknown by
staff
Number of patients not performing exam due not following the prerequisites or
not showing up (considering only common exams)
Level of NM Technicians Experience
Atomedical Operations - Equipment
Existence of not detected equipment errors or malfunctions
Time of equipment stoppage due to repair by outside service
Frequency of equipment maintenance by outside service
Number of existing equipments
Frequency of equipment calibration by NM Technician
In use and idle time of equipments
Time of image processing equipment to produce quality images
Atomedical Operations - Materials/Products
rol
act
ontion
C
/Imp
e
/
e
c
e
t
c
n
en dg ca
ce
orta uen end wle ssifi
Imp Infl Dep Kno Cla
0
1
1
1
1
1
1
1
1
1
1
0
0
0
0
0
0
0
1
0
1
0
1
1
1
1
1
1
1
1
0
0
0
1
1
1
0
0
0
0
1
0
0
1
None
Strategy
Strategy
Signpost
Signpost
Signpost
Signpost
Strategy
None (Rare)
None (Rare)
None (Rare)
1
0
1
0
None (Rare)
0
1
0
1
None
1
1
1
1
1
1
1
1
1
1
1
1
1
1
0
0
0
0
0
1
0
0
0
1
1
1
0
1
Scenario
Scenario
Strategy
Strategy
Strategy
Signpost
Strategy
continued on next page
B-3
B-4
continued from previous page
Atomedical Problem Variables and Analysis Results
#
Name
Description
21
22
23
24
25
26
27
28
29
30
31
32
33
34
35
36
37
38
Technetium Generator Availability
Technetium Generator Cost
Technetium Generator Delivery Frequency
Technetium Generator Delivery Cost
Other Radionuclides Availability
Other Radionuclides Cost
Other Radionuclides Delivery Frequency
Other Radionuclides Delivery Cost
"Cold Kits" Availability
"Cold Kits" Cost
"Cold Kits"s Delivery Frequency
"Cold Kits" Delivery Cost
Quantity of Technetium Generators bought
Quantity of other radionuclides bought
Quantity of "Cold Kits" bought
Unused Technetium
Unused radionuclides
Unused "Cold Kits"
39
40
41
42
43
44
45
46
Used product in each exam/treatment
Product spoiled during preparation
Image Retake
Priority Reports
Exam Reporting Duration
Report Complexity
Exam duration
Patient Real Activity - Biologic Reaction
Availability of the Technetium Generator in supplier
Cost of the Technetium Generator
Delivery frequency of the Technetium Generator at Atomedical
Delivery Costs of the Technetium Generator at Atomedical
Availability of other radionuclides in supplier
Cost of other radionuclides
Delivery frequency of other radionuclides at Atomedical
Delivery Costs of other radionuclides at Atomedical
Availability of "Cold Kits" in supplier
Cost of "Cold Kits"
Delivery frequency of other "Cold Kits" at Atomedical
Delivery Costs of "Cold Kits" at Atomedical
Quantity of Technetium Generators bought in each delivery
Quantity of other radionuclides bought in each delivery
Quantity of "Cold Kits" bought in each delivery
Unused technetium due to decay
Unused radioactive products due to decay
Unused "Cold Kits" due to end of life time
Atomedical Operations - Methods and Procedures
Administrated product to achieve needed activity level
Spoiled product during radiopharmaceutical compounds preparations
Number of performed new image acquisition
Number of produced urgent reports
Duration of exam reporting performed by NM Doctor
Number of reports with the need second opinion or deeper study and analysis
Time of staff and equipment occupancy of an exam
Number of significant variations in the activity during the exam due to biologic
unexpected interaction of administrated compounds
Number of significant variations in activity due staff error in preparation or
administration
47 Patient Real Activity - Staff error
rol
act
ontion
mp
I
C
/
e
/
e
c
e
nc ce
en dg cat
orta uen end wle ssifi
Imp Infl Dep Kno Cla
1
1
1
0
1
1
1
0
1
1
1
0
1
1
1
1
1
1
1
0
0
0
1
0
0
0
1
0
0
0
0
0
0
0
0
0
0
0
0
0
0
0
0
0
0
0
0
0
1
1
1
0
0
0
0
0
1
0
0
0
0
0
0
0
0
0
1
1
1
0
0
0
Scenario
Scenario
Strategy
None
Scenario
Scenario
Strategy
None
Scenario
Scenario
None
None
Signpost
None
Signpost
Signpost
None
Signpost
1
1
1
1
1
1
1
0
0
1
0
0
0
0
1
0
0
0
0
0
0
0
0
0
1
0
0
0
0
0
1
0
Strategy
None (Rare)
Signpost
Scenario
Scenario
Scenario
Strategy
None
1
0
0
0
None (Rare)
continued on next page
continued from previous page
Atomedical Problem Variables and Analysis Results
#
Name
48 Schedule Availability
49 Duration of Equipment Calibration
50 Duration of Radiopharmaceutical Compounds
Preparation
51 Number of Examinations
52
53
54
55
Number of Competitors
Price of Competitors Service
Quality of Competitors Service
Atomedical Unit Reputation
56 Emergency Patients
57 Number of Agreements
58 Number of Patients per Exam
59 Price of Exams in Agreement
60 Number of asked exams in National Health
Care System
61 Price of exams of National Health Care System
62 Number of standalone exams
63
64
65
66
Atomedical Service Quality
Atomedical Exam Quality
Patient Waiting Time in Unit
Atomedical Operations Costs
Description
Waiting time to appointment after intend dates of examination
Duration of equipment calibration performed by NM Technician
Duration of Radiopharmaceutical compounds preparation performed by
NM Technician
Number of Examinations Performed in a period
Atomedical Unit Environment
Number of competitors in the region
Number of Competitors with lower service price
Number of Competitors with higher service quality
Level of Atomedical reputation among doctors for recommending to new
patients
Number of Patients without previous appointment or in urgent need of
examination
Number of people included in price agreements (outside national health care
system)
Number of incoming patients at Atomedical in each exam
Established price for exams in new agreements
General number of patients asked to perform a nuclear medicine exam
(including subsystems)
Price of the exams payed by National Health Care System
Number of exams from patients fully paying the exam at Atomedical
Atomedical Performance
Level of quality of service to patients
Level of quality of exam reports
Delay regarding expected patient time in unit
General costs of Atomedical unit operations
rol
act
ontion
mp
I
C
/
e
/
e
c
e
t
nc ce
en dg ca
orta uen end wle ssifi
Imp Infl Dep Kno Cla
1
0
1
1
1
0
1
0
0
0
0
1
Signpost
None
None
1
1
1
0
Signpost
1
1
1
1
1
1
0
1
0
0
0
0
0
0
1
0
Scenario
Scenario
Strategy
Scenario
1
0
0
0
Scenario
1
1
1
0
Scenario
1
1
1
1
0
1
0
1
0
0
1
0
Scenario
Strategy
Scenario
1
1
0
0
0
1
0
0
Scenario
Scenario
1
1
1
1
1
0
0
0
1
1
1
1
1
1
0
0
Strategy
Strategy
Signpost
Signpost
B-5
B-6
Baixar