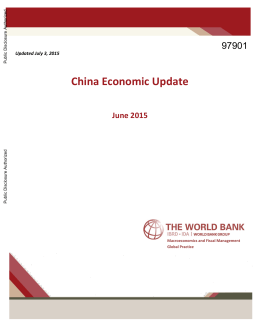
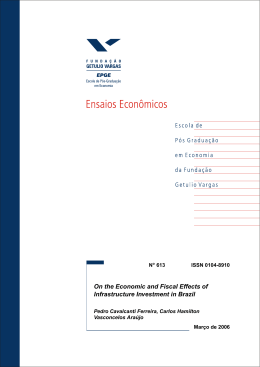
The Global Workforce Crisis $10 Trillion at Risk The Boston Consulting Group (BCG) is a global management consulting firm and the world’s leading advisor on business strategy. We partner with clients from the private, public, and not-forprofit sectors in all regions to identify their highest-value opportunities, address their most critical challenges, and transform their enterprises. Our customized approach combines deep insight into the dynamics of companies and markets with close collaboration at all levels of the client organization. This ensures that our clients achieve sustainable competitive advantage, build more capable organizations, and secure lasting results. Founded in 1963, BCG is a private company with 81 offices in 45 countries. For more information, please visit bcg.com. The Global Workforce Crisis $10 Trillion at Risk Rainer Strack Jens Baier Matthew Marchingo Shailesh Sharda June 2014 | The Boston Consulting Group Contents 3 Introduction 4 The Hard Facts: Acute Shortages, Unrelenting Surpluses 8 A mixed outlook A Contrasting Supply Picture Highlights by Region 1 6The Global Impact 2 0 Appendix 2 3 For Further Reading 2 4 Note to the Reader 2 | The Global Workforce Crisis Introduction In 1494, an Italian monk named Luca Pacioli published an overview of the mathematics of his time. His 36-chapter work described what has since become standard knowledge among the world’s finance and business professionals and a building block of balance sheet accounting: double-entry bookkeeping. And since the advent of this method, invested capital has been the pillar of every enterprise, government, and economy. Even today, in the wake of the global financial crisis and amid a spreading debt crisis, invested capital remains the core and the promise of economies everywhere. But a much bigger crisis is yet to come—one that strikes at the very purpose of economies but is scarcely noted, let alone managed: the crisis in human capital. E very economy’s ability to compete depends on a steady supply of human capital and talent. When that supply is inadequate, imbalances result, creating serious threats not only to the economy but also to social and political stability and future development. This impact, moreover, extends beyond borders. Over the past few years, we have examined workforce supply-anddemand dynamics in 25 major economies (including the G20) through 2030.1 Today, these countries collectively account for more than 2 billion economically active people, or around 65 percent of the world’s population—and more than 80 percent of total world GDP. This report highlights the impending labor shortages and surpluses and their implications for future growth. Trends across the 25 economies we studied are alarming: an equilibrium in supply and demand is rapidly becoming the exception, not the norm. Between 2020 and 2030, we project significant worldwide labor-force imbalances—shortfalls, in particular. One significant implication is the potential aggregate value of GDP squandered, because either these nations cannot fill the jobs available or they cannot create enough jobs for the workers they have. This represents a stunning $10 trillion— around 60 percent of U.S. GDP and more than 10 percent of total world GDP (according to the latest available 2013 figures). This report, the first of a series on this topic, summarizes the findings of The Boston Consulting Group’s extensive research on global talent risk and outlines basic solutions to mitigate these imbalances. The series as a whole will describe the consequences of labor imbalances for businesses and governments and offer further remedies to help mitigate them. Note 1. See Stimulating Economies through Fostering Talent Mobility, a report by the World Economic Forum in collaboration with The Boston Consulting Group, March 2010; and Global Talent Risk: Seven Responses, a report by the World Economic Forum in collaboration with BCG, January 2011. The Boston Consulting Group | 3 The Hard Facts Acute Shortages, Unrelenting Surpluses D emographic risk is one of the most insidious of all megatrends threatening the global economy, but its impact throughout the world is neither simultaneous nor uniform. For our research, we performed simulations on 25 major economies to quantify the extent of labor shortages and surpluses for 2020 and 2030. Overall, by 2020, many countries will still be experiencing a surplus. By 2030, however, this surplus will have turned into a massive shortfall. These are some of the crippling labor shortages and chronic labor surpluses that the world faces: •• Germany will see a shortage of up to 2.4 million workers by 2020 and 10 million by 2030. •• China’s surplus of 55.2 million to 75.3 million workers in 2020 could reverse sharply, turning into a shortage of up to 24.5 million people by 2030. •• South Africa’s labor surplus of 6.5 million to 7.8 million people by 2020 will hold relatively steady—between 6.2 million to 9.2 million by 2030. •• The U.S., with a surplus of between 17.1 million and 22 million people in 2020, will still face a surplus—at minimum 7.4 million—by 2030. To quantify these shortages and surpluses, we calculated annual labor supply and demand until 2030. Let’s look first at labor supply. •• Brazil will have a shortage of up to 8.5 million workers in 2020; by 2030, that figure could increase nearly fivefold to 40.9 million people. •• Italy will experience a surplus of 2 million workers in 2020, but by 2030, it might face a labor deficit of up to 0.9 million. The Labor Supply Forecast. We found that the labor supply is shrinking in Germany, Poland, Russia, and Japan—and will continue to shrink until 2020. From 2020 to 2030, workforce contraction will accelerate. Europe will be severely affected. And for the first time, South Korea and China will experience a decline. Everywhere else, the labor supply will still expand. (See Exhibit 1.) But labor supply is only one side of the coin. •• Canada’s labor surplus of between 700,000 and 1.1 million people in 2020 will become a deficit of up to 2.3 million by 2030. (To understand how we calculated supply and demand, see the sidebar “Methodology, Assumptions, and Definitions.”) 4 | The Global Workforce Crisis Exhibit 1 | The Labor Supply Forecast Africa Asia-Pacific Americas Europe Labor supply, 2012 (millions) Labor supply annual growth rate, 2012–2020 (%) Labor supply annual growth rate, 2020–2030 (%) –0.04 0.34 29 France 42 Germany 25 Italy 9 Netherlands 18 Poland 23 Spain 5 Sweden 4 Switzerland 32 United Kingdom 19 Argentina 103 Brazil 19 Canada 51 Mexico 159 United States 12 Australia 807 China 481 India 1.52 1.26 120 Indonesia 1.56 1.24 66 Japan 76 Russia 10 Saudi Arabia 24 South Korea 27 Turkey 28 Egypt 18 South Africa –1.21 –0.40 –0.89 0.07 –0.51 0.25 –0.75 –0.41 –0.62 –0.05 0.33 0.52 0.82 0.38 0.50 0.08 1.34 0.82 1.26 0.50 0.75 0.20 2.01 1.19 0.72 0.39 0.81 1.03 –0.32 0.05 –0.61 –0.36 –0.58 –0.81 2.49 1.16 –0.24 0.70 1.39 0.74 1.95 1.40 1.55 0.84 Sources: UN Population Division database; ILO LABORSTA database; BCG analysis. Note: Figures for 2020 and 2030 assume the same participation rate by sex and age groups. The labor supply is the forecast of the total population (age 15 and over, divided into five-year age groups) times the labor force participation rate (per five-year age group). The Boston Consulting Group | 5 Methodology, Assumptions, and Definitions To identify global labor gaps and surpluses, we compared the supply and demand of labor in 25 developing and emerging economies through the year 2030. In our analysis, we looked at four key components and took a quantitative view of workforce shortages and surpluses. Labor Supply. The labor supply includes the economically active population, or all people who are providing labor to produce goods and services during a given time period. We were interested in how many people each country will have in its labor force, taking into account birth rates, immigration trends, and labor force participation for specific demographic groups. To calculate this number, we relied on the forecasts of population growth and labor force participation from the UN and one of its agencies, the International Labor Organization (ILO).1 We sought a source that was not only highly credible but also sufficiently global in order to obtain the utmost consistency and comparability across the selected countries. Every country we analyzed is a member of the UN, and all UN data agencies, including the ILO, coordinate directly with each country’s economic agency to obtain data and projections. Since people born in 2014 will enter the labor market in 2029 at the earliest, at age 15, the predictions are fairly reliable— barring, of course, changes in immigration or workforce participation rates. Labor Demand. We used a simple identity to calculate labor demand. (See the exhibit below.) To know what labor demand will be Methodology 1 Simulate workforce supply How many people will be in the labor force by 2030? • Forecast of total population • Labor force participation rate per age cluster 2 Simulate workforce demand How many people will we need in the labor force in 2030, assuming the following: • We have the same GDP growth in the future as we have had in the past 10- and 20-year periods • We have the same labor-productivity improvements in the future as we have had in the past 10- and 20-year periods Demand GDP = GDP × People employed People employed People employed = 3 GDP GDP People employed Growth Labor productivity Identify the gaps and surpluses 20-year labor demand 10-year labor demand Labor supply 4 Develop measures and interventions • Raise the retirement age • Change immigration policies • Bring more women into the workforce • Launch education and training initiatives Source: BCG analysis. Note: The workforce includes people age 15 and older; age groups were analyzed in five-year clusters. “People employed” means total employment, including full-time, part-time, and self-employed people. We used the following identity: GDP = GDP divided by people employed times people employed. 6 | The Global Workforce Crisis in a given year, we need to know what GDP and labor productivity will be in that year. Of course, nobody knows these numbers, and forecasts are highly speculative. However, we can calculate two scenarios. If a country aims for the same GDP and labor-productivity growth over the next 10 or 20 years as it has had in the past 10 or 20 years, we can directly calculate the number of people it will need to generate this growth. To illustrate, let’s take the example of the U.S. Over the past 20 years, average annual real GDP growth (CAGR) was 2.6 percent, and annual labor productivity grew on average by 1.6 percent.2 Suppose the U.S. aspires to have the same growth rate in the future as it has had in the past. We would divide GDP by labor productivity to calculate how many people it will need in its labor force. Using historical GDP and labor productivity growth rates from the Economist Intelligence Unit, we calculated annual GDP and labor productivity growth rates over the past 10- and 20-year periods (2003 through 2012 and 1993 through 2012) for every country we studied. Using these historical growth rates, we extrapolated the labor force each country would need in order to keep GDP and productivity growth for 2020 and 2030 at their historical levels. We did not use forecast numbers because forecasts take various factors into account, including the forecast labor supply. Because we explicitly looked at the labor supply, we needed GDP figures that were not yet constrained by any changes in labor supply numbers. Using historic averages allowed us to treat both variables independently. Surpluses and Gaps. By subtracting demand from supply, we calculated labor force surpluses and shortfalls by year (2020 and 2030) and by country, for each of the two GDP- and productivity-growth scenarios. Measures and Interventions. We analyzed the impact of changing certain key variables that directly influence the labor supply, such as immigration rates and workforce participation rates for specific demographic groups. This might include delaying the retirement age or increasing the share of women in the labor force. We also analyzed the effects of changing variables affecting labor demand. What would happen, for instance, if productivity were raised as a result of educational initiatives? Then we extrapolated the effects on the supply-and-demand curves. A Quantitative View. In this report, our analysis takes a purely quantitative perspective of aggregate workforces. It does not consider employability and job qualifications. When supply-and-demand numbers are broken down by education levels and job families, as we will do in subsequent reports, balances will likely change— revealing more significant shortages and surpluses than the averages here suggest. Notes 1. The latest available labor-participation-rate forecasts from the ILO run only through 2020. We kept this number constant through 2030. 2. In this report, all GDP figures (including growth rates) are real (inflation-corrected) GDP, not nominal. The Boston Consulting Group | 7 A mixed outlook T he outlook for the 25 economies we studied is mixed, which is not surprising. These regions have diverse economic prospects and varied labor and family policies. The countries currently enjoying strong growth could see that growth halt abruptly if labor supply cannot keep pace with demand. Of the four BRIC countries (Brazil, India, Russia, and China), for instance, only India is safe from an impending shortfall. And countries with labor surpluses and persistently weak or no economic growth face a gloomy outlook as those surpluses threaten to spiral out of control. percent—that is, the 10-year annual growth rate. In the second, we assumed annual real GDP growth at 1.3 percent and productivity at 0.9 percent (the 20-year annual growth rate from 1993 through 2012). (For a table of average GDP growth and productivity rates for all countries and both periods, see the Appendix, Exhibit 1.) Germany will not achieve its historical GDP growth rates unless it takes action soon. A Contrasting Supply Picture The situations in Germany and the U.S. provide an example of the extreme differences in labor supply. A Shortage in Germany. We calculated that Germany’s labor supply will shrink from roughly 43 million people today to 37 million in 2030. (See Exhibit 2.) We compared this supply picture with two labor-demand scenarios: the first assumes that labor productivity and targeted GDP will continue at the same rate of growth in the future as in the past 10 years; the second assumes that labor productivity and targeted GDP will match that of the past 20 years. In the first, we assumed annual real GDP growth at 1.2 percent and productivity growth at 0.6 8 | The Global Workforce Crisis In each case, the supply of Germany’s labor in 2030 falls short of demand by 8.4 million to 10 million people. The supply and demand curves will intersect—in effect, signaling full employment—as early as 2015. (Economists generally consider full employment to include a base level of natural unemployment, which, for industrialized countries, hovers between 4 and 6 percent historically. But there is no generally accepted percentage; it depends on the economy and on the economist.) In our analysis, we assumed that an unemployment rate lower than 5 percent already indicates a possible shortage of labor. With this built-in level of unemployment, it becomes clear that the talent deficit in Germany is already at hand. Indeed, today there Exhibit 2 | How Labor Imbalances Differ: Germany Versus the U.S. Labor supply versus demand Labor supply versus demand Germany U.S. Millions of people Millions of people 52 180 170 48 160 150 44 140 40 130 36 120 2015 Labor supply 2020 2025 2030 10-year labor demand 2015 2020 2025 2030 20-year labor demand Sources: UN Population Division database; International Labor Organization LABORSTA database; Economist Intelligence Unit country data; BCG analysis. Note: The labor supply is the forecast of the total population (age 15 and over, divided into five-year age groups) times the labor force participation rate (per five-year age group). Labor demand is defined as the number of people required to be employed in order to produce a desired level of economic output (GDP) based on a given output per person (labor productivity). Twenty-year demand is the number of people needed in order to maintain the same growth rates either country experienced over the past 20 years; ten-year demand is the number needed based on the ten-year growth rate. are shortages not only of engineers and IT professionals but also of positions in many other fields. What will the increasingly dramatic shortage mean? Quite simply, Germany will not achieve its historical GDP growth rates unless it takes action in one or more of the following four ways: •• Ramping up productivity through technological investment and innovation, education initiatives, and other efforts •• Increasing the labor force participation rate of women and the elderly •• Changing immigration policy •• Increasing the number of hours each person works per year (An additional important strategy—achieving a higher birthrate—would have little effect until 2030, since children born in 2014 will not enter the labor market until 2029 at the earliest. Beyond 2030, however, its impact would be significant.) A Surplus in the U.S. The surplus in the U.S. presents a starkly contrasting picture. Again, we modeled labor supply and demand using the same two sets of assumptions: GDP and productivity growth rates for the past 10 and 20 years. In each scenario, the supply of labor in 2030 will exceed demand. In the best case (the 20-year demand scenario), supply will exceed demand by at least 7.4 million people. Both scenarios clearly show a diminishing labor surplus until 2030. On the basis of assumptions of the past 20 years, however, the most probable scenario shows a surplus of 4 percent. The U.S. must find ways to better utilize its workforce as well as increase its economic activity—for example, by repatriating much of the manufacturing it outsourced in recent decades—or it will continue to experience relatively high unemployment. Better workforce utilization would mean improvements in training and education and would also include incentives for individuals and businesses to produce workers with skills and education that better match what is needed. (Many experts today blame poor workforce utilization on a growing mismatch between the educational qualifications of college graduThe Boston Consulting Group | 9 The Economic Effects of Labor Shortages and Surpluses While a labor surplus invariably attracts more attention, a shortage is just as problematic. The shortage of labor hampers economic growth. It creates wage inflation, leaves vacancies open, and impedes business formation and development. Ultimately, it threatens a country’s competitiveness. A labor surplus is equally unhealthy but for different reasons. On an individual level, long-term unemployment ates and labor force needs.) More generally, the U.S. must do a better job of encouraging entrepreneurialism. Highlights by Region In many developed economies, demographic decline—falling birth rates and an aging population—translates into negative labor growth. In the developing world, rapid growth has created an ever-increasing demand for labor. But many emerging economies are also reaching the final phase of their demographic peak. All economies with favorable demographics—developed and developing—risk high unemployment if they fail to push their growth targets. (See the sidebar “The Economic Effects of Labor Shortages and Surpluses.”) China and India. These long-term stars of the emerging world are among the nations with the world’s highest sustained GDP growth for the past 20 years (10.1 percent for China and 6.7 percent for India). Both countries have robust exports, a vast population, a rapidly rising middle class, and infrastructure needs. Both have instituted significant market reforms in recent years to open their economies to foreign trade and competition. But their labor-force trends reveal important differences. (See Exhibit 3.) China will be hard hit as a consequence of its one-child-per-family policy, which has been in effect since 1979. This policy has helped make the world’s most populous country also its most rapidly aging. Recent proposals to 10 | The Global Workforce Crisis can lead to the attrition of skills, in turn reducing employability. On a national level, high unemployment reduces the tax base and raises the cost of social services and the risk of social instability. In the aggregate, surpluses further reduce an economy’s competitiveness and attractiveness to investors. ease this policy, if implemented, will have only limited impact over the next decade.1 By contrast, India’s demand for labor will not exceed supply until 2030, giving the country enormous headroom for further growth—assuming its existing workforce is utilized more effectively. India’s supply-demand balance will also depend on how much of the workforce transitions from the nation’s huge “shadow” economy into its formal economy. (See the sidebar “What the Official Unemployment Numbers Don’t Show.”) India’s labor demand will not exceed supply until 2030, leaving plenty of room for growth. Which of the two countries commands the leading position in the East will depend largely on how policymakers address fundamental questions relating to the labor market. Australia and Japan. Thanks to its commodity-rich economy, Australia was able to continue growing through the end of the first decade of the twenty-first century—successfully insulating itself from the global downturn. If it continues on this trajectory and maintains its GDP growth of above 3.0 percent, Australia will likely experience a severe labor shortage by 2030. By contrast, Japan’s outlook is for continued slow—poten- Exhibit 3 | Labor Supply Versus Demand in the Asia-Pacific Region China Australia South Korea Millions of people Millions of people Millions of people 880 18 34 840 16 32 800 14 760 12 720 10 2020 2030 30 28 26 2020 India 2030 24 2020 Japan Russia Millions of people Millions of people Millions of people 700 70 600 65 90 80 500 60 400 55 2020 Labor supply 2030 10-year labor demand 2030 70 60 50 40 2020 2030 2020 2030 20-year labor demand Sources: UN Population Division database; International Labor Organization LABORSTA database; Economist Intelligence Unit country data; BCG analysis. Note: The labor supply is the forecast of the total population (age 15 and over, divided into five-year age groups) times the labor force participation rate (per five-year age group). Labor demand is defined as the number of people required to be employed in order to produce a desired level of economic output (GDP) based on a given output per person (labor productivity). Twenty-year demand is the number of people needed in order to maintain the same growth rates either country experienced over the past 20 years; ten-year demand is the number needed based on the ten-year growth rate. tially negative—growth. However, with an aging workforce, Japan’s supply-demand gap will narrow. If growth picks up to 10- or 20-year GDP and productivity levels, Japan’s labor surplus may reverse to a shortage through 2030. (See the sidebar “Japan’s Never-Ending Workforce Challenges.”) South Korea and Russia. Of all the Asian economies analyzed, South Korea faces the most significant labor shortages. If its 20-year historic GDP and productivity averages persist, it will suffer the secondgreatest shortfall of the 25 countries. Due to rapidly aging society, South Korea is expected to have one of the oldest populations of the OECD countries by 2040 (second only to Japan), and it has little latitude left to address this shortfall by increasing the number of working hours per employee. Of the 25 economies, it has the largest number of employees working more than 2,000 hours per year.2 Similarly, Russia faces significant shortfalls in the 10-year scenario—a more realistic picture than the 20-year scenario. Russia had negative GDP growth in the 1990s. It is not likely that the country will have the same growth in the future as in the 20-year scenario—which considers all years from 1993 to 2000, considerably bringing down the overall average. Italy and the UK. The labor picture is very mixed throughout Europe, and Italy and the UK offer two good examples. (See Exhibit 4.) These nations have comparably sized working populations: 25 million economically active 15- to 64-year-olds in Italy (out of a total of 40 million in that age range) and 31 million in the UK (out of a total of 41 million in that age range). Both countries—Italy in particular—suffer from high unemployment. Longer term, Italy and the UK face completely different workforce challenges. Italy’s demographic woes—the country is Europe’s The Boston Consulting Group | 11 What the Official Unemployment Numbers Don’t Show In some cases, the surpluses we calculated exceed official unemployment rates. Because of their political and economic sensitivity, unemployment rates are sometimes defined by governments in ways that can minimize unemployment’s actual magnitude. Inevitably, there are inconsistencies in these definitions from country to country, which means comparisons might not always be reliable. For that reason, we cross-checked official data against a variety of sources whenever possible. Of the six unemployment measures used by the U.S. Department of Labor, the one commonly reported in the press (U-1) counts only those unemployed who are still collecting benefits and who have sought work in the past month—not the longer-term unemployed. The broadest unemployment measure (U-6) has hovered around 14 percent since late 2012 and mid-2013, versus the 8 percent rate that is generally reported.1 On the flip side are people employed in the “shadow” economy—not only the black market but also legitimate, cash-only busi- most rapidly aging society—translate into a labor shortage by 2030 in the 10- and 20-year growth scenarios. The UK, however, grapples with chronic unemployment as a result of an expanding labor supply and inadequate economic growth.3 France and Spain. France’s demographic structure is much healthier than neighboring Germany’s. Yet depending on its GDP and productivity growth, France may well suffer relatively high unemployment over a longer period. Much of its unemployment troubles stem from stringent employee protections that stifle job creation and workforce flexibility. In the 20-year growth scenario, however, even France faces a talent scarcity by 2030. Conversely, Spain was among the hardest hit by the global financial and euro crisis. Next to South Africa and Saudi Arabia, it suffers 12 | The Global Workforce Crisis nesses with job numbers that don’t show up in official labor surveys. India may be the most dramatic example of this phenomenon, with its numerous small businesses that employ fewer than ten people. A 2010 World Bank study calculated that India’s shadow economy represents roughly one-fifth of the nation’s official GDP, and the Indian government’s 2013 economic survey estimates that such informal employment accounts for as much as 85 percent of overall employment.2 Notes 1. Alternative Measures of Labor Underutilization for States, 2012 Annual Averages, Bureau of Labor Statistics, U.S. Department of Labor; http://www.bls. gov/lau/stalt.htm. This report retrieved third-quarter 2013 figures. 2. F. Schneider, A. Buehn, and C. E. Montenegro, Shadow Economies All over the World: New Estimates for 162 Countries from 1999 to 2007, Policy Research Working Paper 5356, World Bank Development Research Group, July 2010. See also Economic Survey 2012–2013, Ministry of Finance, Government of India, 2013. http://indiabudget.nic.in/ noted in report Seizing the Demographic Dividend, p. 46. the highest relative labor surplus of the 25 economies we analyzed. Using either of the two growth scenarios, Spain’s labor surplus will remain high through 2020. Switzerland and Poland. While Switzerland’s demographic situation is frequently overshadowed by that of its European peers, the country nonetheless faces severe shortages. Today, its own economically active population cannot match the demand for workers. In 2012, 263,000 workers from neighboring countries were commuting to Switzerland daily to work.4 By 2030, this number could be significantly higher as a result of the growing workforce gap. Poland’s story stands out because it was the only EU country to avoid recession during the 2009 downturn. It has benefited from more than 20 years of economic liberalization and, Exhibit 4 | Labor Supply Versus Demand in Europe France Italy Switzerland Millions of people Millions of people Millions of people 28 32 7 30 6 28 5 26 24 22 20 2020 2030 26 2020 United Kingdom 2030 4 2020 Spain Poland Millions of people Millions of people Millions of people 36 30 24 22 34 20 20 32 18 10 30 28 2030 16 2020 Labor supply 2030 0 10-year labor demand 2020 2030 14 2020 2030 20-year labor demand Sources: UN Population Division database; International Labor Organization LABORSTA database; Economist Intelligence Unit country data; BCG analysis. Note: The labor supply is the forecast of the total population (age 15 and over, divided into five-year age groups) times the labor force participation rate (per five-year age group). Labor demand is defined as the number of people required to be employed in order to produce a desired level of economic output (GDP) based on a given output per person (labor productivity). Twenty-year demand is the number of people needed in order to maintain the same growth rates either country experienced over the past 20 years; ten-year demand is the number needed based on the ten-year growth rate. since 2004, membership in the European Union. If GDP and labor productivity growth rates remain at five- or ten-year levels, however, Poland may face a severe labor shortage of up to 24 percent by 2030. Latin America and South Africa. In these emerging economies, rapid economic growth and policy changes, combined with underlying social and infrastructure challenges, present wide-ranging prospects even within the same country. (See Exhibit 5.) In Argentina, for example, shifting monetary and fiscal policies have put the country through numerous economic ups and downs since the global financial crisis. An influx of immigrants (Europeans fleeing the euro crisis and returning South Americans), along with a young population, threatens to keep unemployment high through 2020 and 2030. (The ten-year growth scenario, however, presents a different picture, since it includes the country’s recovery following a deep economic crisis that began in 2001.) By contrast, Brazil faces surging shortages, regardless of scenario. The world’s seventh-largest economy was among the first emerging markets to recover from the global financial crisis. Slowing population growth and an aging population are rapidly altering the nation’s demographic makeup. Much of Brazil’s working-age population is underqualified as a result of gaps in the nation’s education system. And while Mexico’s supply-and-demand gaps are not nearly as wide as those of other Latin The Boston Consulting Group | 13 Japan’s Never-Ending Workforce Challenges Division, net immigration rose from about 212,000 from 1980 through 1985 to roughly 270,000 from 2005 through 2010. But in between, it fluctuated wildly—from around 630,000 from 1985 through 1990 and 451,000 from 1990 through 1995. Migration hasn’t followed any clear trend over the past 30 years. Around 1995, Japan saw its working-age population begin to decline. By the start of the current millennium, even with a slowing economy, Japan faced the same problem that Germany (along with many mature economies) faces today and that South Korea (and other economies) will face tomorrow: a shrinking workforce. A look at the six key drivers of labor supply and demand and their impact on Japan in recent decades illuminates the challenges inherent in addressing workforce imbalances: •• •• •• •• Birth Rate. Japan’s total fertility rate (total births per woman) has declined from 1.7 to 1.4 over roughly the past 20 years (1988 through 2008).1 (From 2005 through 2010, it fell to 1.3, as shown in the Appendix, Exhibit 2). Japan has not implemented policies that encourage population growth. Fewer children today, of course, mean a smaller pool of workers in the future. Labor Force Participation Rates. From 1990 through 2012, the overall participation of the working-age population in the active labor force increased slightly, from 70 to 74 percent. Similarly, the participation rate of working women ages 15 through 64 increased from 57 to 64 percent. Thus, Japan faces favorable developments in labor force participation. Retirement Age. For many years, Japan’s official retirement age was 60. The government is phasing in a higher retirement age of 65. (For men, the phase-in ended in 2013; for women, it runs from 2006 through 2018).2 Because many retirees work part-time, however, the actual retirement age has been closer to 70. Thus, the nation has benefited from this lever formally and informally. Immigration. The government responded by loosening restrictions on highly skilled foreign workers.3 According to estimates from the UN Population 14 | The Global Workforce Crisis •• Working Hours per Year. The average number of hours that each individual worked each year fell from more than 1,965 hours in 1992 to 1,728 hours in 2011. That trend has only worsened the nation’s labor-supply situation. •• Labor Productivity. Japan’s labor-productivity growth rate has increased only slightly—less than 1 percent over the past 20 years. Has a labor shortage constrained Japan’s economic growth? There is no doubt that these six factors have contributed significantly to Japan’s decline over the last decades—from around 4 percent annual average GDP growth in the 1980s to less than 1 percent from 2003 through 2012. To be sure, activating these levers can be difficult, given the complex dynamics of policy, politics, and individual choice. But these are all direct means of alleviating labor force shortages, and countries must be as proactive as they can be. If countries such as Germany and South Korea make no attempt to activate these six levers, they might experience the same economic decline that Japan has. Notes 1. ILO and World Development Indicators, The World Bank. 2. From Pensions at a Glance 2013: Retirement-Income Systems in OECD and G20 Countries. See http://www. oecd.org/els/OECD-PensionsAtAGlance-2013Highlights-Japan.pdf. 3. Vera Mackie, “Managing borders and managing bodies in contemporary Japan,” Journal of the Asia Pacific Economy, February 2010. http://www.academia. edu/606362/Managing_Borders_and_Managing_ Bodies_in Contemporary_Japan. Exhibit 5 | Labor Supply Versus Demand in Latin America and South Africa Argentina Mexico Millions of people Millions of people 30 80 70 25 60 20 50 15 2020 2030 40 Brazil 2020 2030 South Africa Millions of people Millions of people 180 25 160 20 140 15 120 100 2020 Labor supply 2030 10-year labor demand 10 2020 2030 20-year labor demand Sources: UN Population Division database; International Labor Organization LABORSTA database; Economist Intelligence Unit country data; BCG analysis. Note: The labor supply is the forecast of the total population (age 15 and over, divided into five-year age groups) times the labor force participation rate (per five-year age group). Labor demand is defined as the number of people required to be employed in order to produce a desired level of economic output (GDP) based on a given output per person (labor productivity). Twenty-year demand is the number of people needed in order to maintain the same growth rates either country experienced over the past 20 years; ten-year demand is the number needed based on the ten-year growth rate. American economies, our projections show different outcomes for Mexico over different periods. Because of the nation’s dependency on exports, outdated labor laws, high poverty rates, and education system in need of improvement, labor surpluses are likely through 2020. After 2030, however, shortfalls are probable. South Africa’s growth as an emerging economy has masked serious workforce challenges. Its protracted double-digit relative labor surplus puts it in the ranks of the highest-unemployment economies through 2020. By 2030, based on the 20-year GDP and labor-productivity growth-rate assumptions, it will be the highest-unemployment economy with the greatest surplus (39.2 percent). The country’s 50 percent poverty rate, infrastructure needs, and large deficits represent significant challenges to growth. Notes 1. “China to ease one-child policy,” Xinhua News Agency, November 15, 2013; http://news.xinhuanet. com/english/photo/2013-11/16/c_132892920.htm. 2. According to “2013 Statistics on the Aged,” from Statistics Korea, an official government website, retrieved on December 3, 2013 (http://kostat.go.kr/portal/english/ news/1/23/2/index.board), nearly one-third of the population will be 65 or over. According to ILO and World Development Indicators by The World Bank, South Korea reached 2,090 hours per worker in 2011. 3. Figures for the UK and Italy are from World Population Prospect: The 2010 Revision, UN Population Division, 2010. 4. Data for 2012 in the Cross-border Commuter Statistics (CCS) comes from the Swiss Federal Statistical Office. The Boston Consulting Group | 15 The Global Impact I n 2020, we see a mixed labor picture. By 2030, however, most countries will face labor shortages. (See Exhibit 6.) Surpluses of between 0 and 5 percent represent de facto shortages (natural unemployment), in which job openings are already difficult to fill. What do these shortages and surpluses mean to the world economy? What aggregate impact could they have by the year 2030? The answer can be represented by an equation. The impact that comes from a surplus (what a country could produce if it created enough jobs) plus the impact that comes from a shortage (what a country cannot produce because it does not have enough people to fill the available jobs or does not have the required productivity increase) equal total impact—that is, the total potential economic loss that results from the supply-and-demand mismatch. We begin by taking the labor gap figure for each country—the number of people constituting the shortage or surplus—and multiplying it by the labor productivity (per worker) average. (We ran calculations using the two sets of averages but this report is based on the 20-year assumptions—presumably the most reliable numbers since they cover the longest term.) The resulting number is the dollar value of GDP not created. Adding all of the country results together, we get the total GDP not created as a result of these labor gaps. In the 20-year productivity scenario, we 16 | The Global Workforce Crisis calculated $10 trillion of lost GDP. Addressing labor force imbalances will clearly have a huge economic effect. Clearly there is no one solution. Each situation calls for a focused set of interventions. Our aim here, however, is not to dissect the underlying causes of workforce imbalances or to elaborate on recommendations. It is simply to quantify these imbalances today and over the coming years and to draw attention to their severity and imminence. Their effects on individual countries, as well as on regional economies and the global economy, cannot be taken lightly. Clearly there is no one solution, neither for the specific problems of labor shortage and labor surplus nor for the particular type of economy, whether developed or developing. We believe that each situation calls for a focused set of interventions. Many cases will require activating a combination of levers. (See the sidebar “Closing the Gap: How Germany Could Mitigate Its Labor Shortage.”) Mitigating a Labor Shortage. A shortfall in available labor renders economies unable to Scenarios based on 10-year and 20-year compound annual growth of gross domestic product and labor productivity Exhibit 6 | Labor Shortages and Surpluses Are Projected Worldwide Africa Asia-Pacific Americas Europe Labor shortage or surplus in 2020 (percentage of labor supply) Labor shortage or surplus in 2030 (percentage of labor supply) Scenario 1 (10-year growth rate) Scenario 2 (20-year growth rate) France 8 6 5 –1 Germany –6 –4 –27 –23 Italy 8 8 –4 –4 Netherlands 14 10 5 –7 Poland –1 5 –24 –10 Spain 24 17 16 –3 Sweden 7 9 4 8 Switzerland –9 –5 –19 –10 United Kingdom 8 6 3 –1 Argentina 3 24 –23 30 Brazil –7 –7 –34 –33 Canada 5 3 –6 –11 Mexico 10 6 4 –8 United States 13 10 11 4 Australia –3 –2 –18 –16 China 9 7 3 –3 India 8 6 4 1 Indonesia 3 5 –3 0 Japan 3 3 –2 –2 Russia –5 11 –24 15 Saudi Arabia 16 30 –19 20 South Korea –2 –6 –16 –26 Turkey 7 8 0 4 Egypt 7 9 –5 0 South Africa 30 36 26 39 Surplus De facto shortage (surplus of 0%–5%) Scenario 2 Scenario 1 (10-year growth rate) (20-year growth rate) Shortage Sources: UN Population Division database; International Labor Organization LABORSTA database; Economist Intelligence Unit country data; BCG analysis. Note: Surplus or shortage = labor supply – labor demand for 2020 and 2030. Scenarios are based on the 10-year and 20-year compound annual growth rate (CAGR) of GDP and labor productivity. For Russia, the 10-year scenario is much more realistic than the 20-year scenario. Poland’s labor-productivity CAGR is from 1996 through 2012, Argentina’s is from 2003 through 2012, Mexico’s is from 2001 through 2012, Russia’s is from 1995 through 2012, Saudi Arabia’s is from 2000 through 2012, and South Africa’s is from 2001 through 2012. The Boston Consulting Group | 17 Closing the Gap How Germany Could Mitigate Its Labor Shortage To further illustrate the magnitude of global labor-force risks, let’s consider what it would take for Germany to close the serious labor gap we project it will have by 2030. (See the exhibit below.) •• Boost the net intake of immigrants from 369,000 to 460,000 each year through 2030 and ensure that the labor force participation rate of immigrants is at least as high as that of nationals. Although this increase appears relatively modest, it’s worth noting that until recently, the net immigration number was considerably smaller. In 2011, only 128,000 people immigrated to Germany. In 2012, Germany experienced a dramatic increase in immigration from high-unemployment EU countries such as Spain, Greece, Portugal, and Italy—the highest levels of immigration since 1995. •• Boost labor productivity growth from 0.9 to 1.15 percent. Assuming a target GDP growth rate of 1.3 percent (the 20-year average annual rate), Germany would need to do all of the following to close the gap: •• Increase the workforce participation rate of workers age 65 and over from the current 4.1 percent level to 10 percent. •• Increase the participation rate of working-age women from 71 to 80 percent. The official participation rate does not distinguish between part-time and full-time jobs. Many women in Germany work part-time, which makes the overall participation rate high. So another lever for closing the labor gap would be to convert more women from part-time to full-time employment. Calculating these measures is easy; putting them into action is generally not. Workforce Supply-and-Demand Drivers Could Mitigate Germany’s Projected Shortfall Drivers to close the gap Labor gap in 2030 Current level Needed level Expected GDP growth 1.3% Expected productivity growth 0.87% Labor shortfall Structural unemployment Total labor shortfall –8.39 million people (–23%) Workforce supply drivers 5% –10.2 million people (–28%) Workforce demand drivers Participation rate of workers more than 65 years old 4.1% 10% Participation rate for working women 15 to 64 years old 71.1% 80% Net immigration per year 369,000 460,000 0.87% 1.15% Labor productivity growth rate Sources: Federal Statistical Office of Germany; UN Population Division database; International Labor Organization (ILO) LABORSTA database; Economist Intelligence Unit country data; BCG analysis. Note: Expected GDP and productivity growth are based on the last 20 years’ CAGR. Labor shortfall is calculated using the 20-year scenario. Structural unemployment results from the economy’s inability to fully match the supply and demand of skills; 5 percent is assumed. For participation rates for 2030, we assumed similar ILO projections as for 2020. Current level of immigration is for 2012. The needed level of immigration for 2030 assumes that the participation rate of immigrants is similar to that of nationals. The labor productivity growth rate is based on the last 20 years’ CAGR. 18 | The Global Workforce Crisis meet their growth targets. To tackle the problem—and sustain economic growth— four fundamental actions can be taken: •• Boost productivity through capital investment in infrastructure, innovation, technology, and social and training programs in order to help underqualified and less-educated working-age people improve their employability. •• Increase the participation rate by encouraging women to take part in the labor force, raising the retirement age, promoting jobs for the elderly, and increasing yearly working-hour totals. •• Increase immigration and mobility by easing immigration norms, cultivating the cross-border talent pool, and taking advantage of technology for virtual collaboration and mobility. By 2030, most of the 25 economies in our study will face shortfalls. Thus, increasing talent mobility can be regarded as only a limited solution. •• Encourage higher birth rates, which are ultimately essential for sustaining economic growth and healthy demographic ratios. However, the impact of this action has a time delay of at least 15 years. Minimizing a Labor Surplus. A surplus means unemployment. The most straightforward solution for unemployment is, of course, economic growth. There are many possible strategies for boosting GDP growth. From a workforce perspective, however, a labor surplus can be reduced by better utilizing the existing workforce. The following are some of the approaches that are available: •• Vocational Training and Job Qualification Programs. These government- and business-sponsored programs include training for specific skills that are in demand, as well as engaging in better supply-demand job mapping and improving the way skills and job criteria are identified. •• Education Programs. These include broadbased skill-development programs that make people more employable, such as programs that improve language or communication skills. These programs help more working-age people move into active and full-time work. •• Reducing Shadow Employment. It is crucial to incorporate a broader part of the workforce into the formal economy. This involves simplifying labor regulation and taxation in order to encourage more small employers to get workers on the books, as well as reforming income and wage tax policies so people will consider net take-home pay attractive. These general suggestions are only a start. There are many more strategies for reducing unemployment through growth, workforce levers, or a combination of the two. Whether by legislation and regulation, economic incentives, or even social pressures, solutions to labor force imbalances will need to come from many quarters—government, business, educational and other institutions, and civil society. The first step in solving imbalances, though, is fostering awareness about the magnitude and the imminence of the problem. F or this report, we examined aggregate national workforces, identifying major global and local imbalances. In subsequent reports, we will break down these numbers by education levels and job families, which will further emphasize the severity of global labor problems. A country may appear to have a perfect overall balance of supply and demand, but after decomposing the numbers, we might find that it, in fact, has a surplus of 1 million people with a primary education but a shortfall of 1 million with a secondary education. This kind of de-averaging reveals the crucial challenge ahead for governments and businesses. Both will need far more sophisticated tools to analyze supply and demand, issues that we will explore in our forthcoming reports. The Boston Consulting Group | 19 Appendix Exhibit 1 shows the data underlying our labor-force-demand projections for all of the countries we studied: growth rates for annual GDP and labor productivity over the past 10and 20-year periods. These were based on the growth rates for historical GDP and labor productivity (obtained from the Economist Intelligence Unit). Using these historical rates, we extrapolated the labor force each country would need in order to keep GDP and productivity growth in 2020 and 2030 at their historical levels. 20 | The Global Workforce Crisis Exhibit 2 compares five key labor-force-supply indicators across the 25 countries. These are the total fertility rates, labor force participation rates for women, official retirement ages (for men and women), effective retirement ages (for men and women), and average number of hours worked per week at the primary source of employment. Because all of these indicators, depending on the country, may be policy driven, they can serve as levers that will affect labor supply and demand. Exhibit 1 | GDP and Productivity Growth Rates, by Country GDP (Annual growth rate, %) 2003–2012 1993–2012 2003–2012 1993–2012 France 1.0 1.5 0.7 0.9 Germany 1.2 1.3 0.6 0.9 –0.1 0.8 –0.4 0.5 Netherlands 1.1 2.0 0.6 0.8 Poland 4.3 4.4 2.8 3.7 Spain 1.3 2.2 0.9 0.7 Sweden 2.2 2.5 1.6 2.1 Switzerland 1.9 1.6 0.5 0.8 United Kingdom 1.3 2.4 0.8 1.6 Argentina 7.1 3.8 3.8 3.8 Brazil 3.6 3.2 0.8 0.5 Canada 1.9 2.7 0.5 1.1 Mexico 2.5 2.6 0.6 0.0 United States 1.8 2.6 1.2 1.6 Australia 3.0 3.5 0.8 1.4 China 10.4 10.1 10.1 9.4 India 7.7 6.7 5.9 4.7 Indonesia 5.7 4.6 3.7 2.8 Japan 0.8 0.6 0.9 0.7 Russia 4.6 1.8 3.8 3.1 Saudi Arabia 6.7 4.0 1.9 1.5 South Korea 3.6 4.9 2.5 3.3 Turkey 5.0 4.0 3.5 2.8 Egypt 4.7 4.3 1.8 1.8 South Africa 3.5 3.1 2.1 2.8 Asia-Pacific Americas Europe Italy Africa Labor productivity (Annual growth rate, %)1 Sources: Economist Intelligence Unit country data, actual and estimates; BCG analysis. Note: Poland’s labor-productivity CAGR is from 1996 through 2012, Argentina’s is from 2003 through 2012, Mexico’s is from 2001 through 2012, Russia’s is from 1995 through 2012, Saudi Arabia’s is from 2000 through 2012, and South Africa’s is from 2001 through 2012. 1 GDP contribution per person employed. The Boston Consulting Group | 21 Exhibit 2 | Benchmarking of Worldwide Labor Force Africa Asia-Pacific Americas Europe Total Labor force fertil- participation ity rate, rate for 2005– women, 20101 2012 (%)2 Official retirement age, 20113 Effective retirement age, 2006–20114 Average number of hours worked per week, 20115 (ages 15–64) Men Women Men Women Men Women France 2.0 66.3 60 60 59.1 59.5 41.0 34.7 Germany 1.4 72.1 65 (67) 65 (67) 61.9 61.4 39.9 30.1 Italy 1.4 51.8 65 60 60.8 59.2 40.5 33.1 Netherlands 1.7 73.4 65 65 63.6 62.0 35.7 24.5 Poland 1.3 59.3 65 60 61.5 59.4 42.4 38.2 Spain 1.4 67.4 65 65 62.3 63.4 41.1 35.2 Sweden 1.9 78.0 65 65 66.3 64.4 38.4 34.3 Switzerland 1.5 76.8 65 64 65.5 64.1 40.4 29.1 United Kingdom 1.8 69.8 65 (66) 60.7 (66) 63.6 62.3 41.0 31.2 Argentina 2.3 55.2 65 60 NA NA NA NA Brazil 1.9 65.2 65 60 70.7 64.0 NA NA Canada 1.7 74.4 65 65 63.8 62.5 39.8 33.9 Mexico 2.4 46.5 65 65 71.5 70.1 46.3 38.3 United States 2.0 66.8 66 (67) 66 (67) 65.2 64.8 40.56 35.96 Australia 1.9 70.8 65 (67) 64 (67) 65.2 62.9 40.5 30.8 China 1.6 75.0 60 50/553 66.85 62.05 NA NA India 2.7 30.3 58 58 NA NA NA NA Indonesia 2.1 53.5 55 55 NA NA NA NA Japan 1.3 63.5 64 (65) 62 (65) 69.3 66.7 NA NA Russia 1.4 68.9 60 55 62.5 59.6 39.37 36.97 Saudi Arabia 3.0 19.1 60/554 55 NA NA NA NA South Korea 1.3 54.7 60 (65) 60 (65) 71.4 69.9 46.7 41.7 Turkey 2.2 31.6 60 (65) 58 (65) 63.5 70.4 51.9 41.4 Egypt 3.0 25.8 NA NA NA NA NA NA South Africa 2.6 47.9 60 60 64.3 62.7 NA NA 1 1 2 1 1 2 Sources: UN Population Division database; ILO Key Indicators of the Labor Market database; Organization for Economic Cooperation and Development database; BCG analysis. Note: The total fertility rate is the average number of children per woman. The labor force participation rate is the proportion of the population that is economically active. Retirement ages in parentheses indicate a planned increase to this age within the next two decades. The effective retirement age is the average age at exit from the labor force. The number of hours worked is the average weekly hours spent at a primary job. NA = not available. 1 Workers can retire at age 60 with 40 years of contributing to social security. 2 Men can retire after 35 years of contributing to social security; women after 30 years. 3 The normal pension age for women is 50 in blue-collar jobs, 55 in white-collar jobs. 4 Men can retire at age 55 if they have spent at least 120 months in arduous or unhealthy work. 5 Based on 2005–2010 data. 6 ILO data for February 2013. 7 ILO data for September 2012. 22 | The Global Workforce Crisis for further reading The Boston Consulting Group publishes many reports and articles that may be of interest to management teams. Recent examples include the publications listed here. Creating People Advantage 2013: Lifting HR Practices to the Next Level When Growth Outstrips Talent: Five Strategies for Emerging Markets Corporate Universities: An Engine for Human Capital Global Talent Risk: Seven Responses A report by The Boston Consulting Group, October 2013 A Focus by The Boston Consulting Group, July 2013 An article by The Boston Consulting Group, April 2012 A report by The Boston Consulting Group and the World Economic Forum, January 2011 Managing Demographic Risk An article by The Boston Consulting Group that first appeared in the Havard Business Review, February 2008 The Boston Consulting Group | 23 note to the reader About the Authors Rainer Strack is a senior partner and managing director in the Düsseldorf office of The Boston Consulting Group and the Europe and Africa leader of the firm’s People & Organization practice, global topic coleader of HR, and coleader of Creating People Advantage research. Jens Baier is a partner and managing director in the firm’s Düsseldorf office and a core member of the Energy, Industrial Goods, and People & Organization practices. Matthew Marchingo is a project leader in BCG’s New York office. Shailesh Sharda is a consultant in the firm’s Singapore office. Acknowledgments The authors would like to offer their sincere thanks to BCG colleagues, including Christian Adler, Jacqueline Betz, Christian Barnhausen, HansPaul Bürkner, Susanne Dyrchs, Natalie Groh, Claus Hermannstädter, Philipp Kolo, June Limberis, Christian Orglmeister, Christian Peuker, Cleo Race, and Gordian Rättich for contributing their insights and for helping draft this report. They would also like to acknowledge Jan Koch for her writing assistance, as well as Katherine Andrews, Gary Callahan, Sarah Davis, Oliver Dost, Kim Friedman, Abigail Garland, and Sara Strassenreiter for their contributions to the report’s editing, design, and production. For Further Contact For further information about this report, please contact one of the authors. Rainer Strack Senior Partner and Managing Director BCG Düsseldorf +49 2 11 30 11 30 [email protected] Jens Baier Partner and Managing Director BCG Düsseldorf +49 2 11 30 11 30 [email protected] Matthew Marchingo Project Leader BCG New York +1 212 446 2800 [email protected] Shailesh Sharda Consultant BCG Singapore +65 6429 2500 [email protected] 24 | The Global Workforce Crisis © The Boston Consulting Group, Inc. 2014. All rights reserved. For information or permission to reprint, please contact BCG at: E-mail: [email protected] Fax: +1 617 850 3901, attention BCG/Permissions Mail: BCG/Permissions The Boston Consulting Group, Inc. One Beacon Street Boston, MA 02108 USA To find the latest BCG content and register to receive e-alerts on this topic or others, please visit bcgperspectives.com. Follow bcg.perspectives on Facebook and Twitter. 6/14 Abu Dhabi Amsterdam Athens Atlanta Auckland Bangkok Barcelona Beijing Berlin Bogotá Boston Brussels Budapest Buenos Aires Calgary Canberra Casablanca Chennai Chicago Cologne Copenhagen Dallas Detroit Dubai Düsseldorf Frankfurt Geneva Hamburg Helsinki Ho Chi Minh City Hong Kong Houston Istanbul Jakarta Johannesburg Kiev Kuala Lumpur Lisbon London Los Angeles Luanda Madrid Melbourne Mexico City Miami Milan Minneapolis Monterrey Montréal Moscow Mumbai bcg.com | bcgperspectives.com Munich Nagoya New Delhi New Jersey New York Oslo Paris Perth Philadelphia Prague Rio de Janeiro Rome San Francisco Santiago São Paulo Seattle Seoul Shanghai Singapore Stockholm Stuttgart Sydney Taipei Tel Aviv Tokyo Toronto Vienna Warsaw Washington Zurich
Download