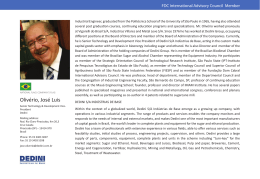
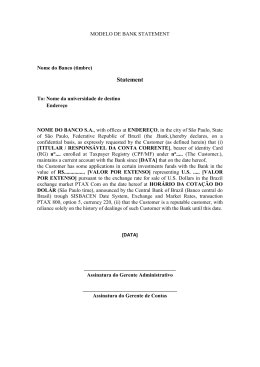
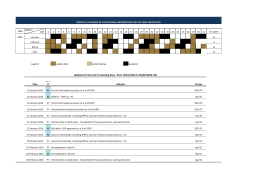
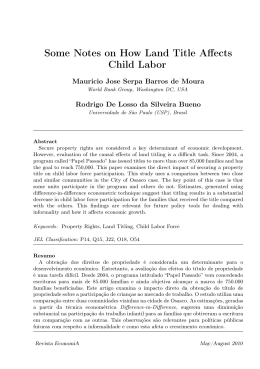
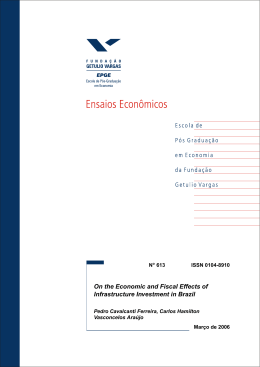
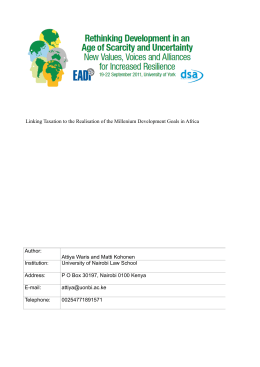
S E P T E M B E R 2 012
m c k i n s e y
g l o b a l
i n s t i t u t e
Unlocking the potential of
emerging-market cities
Richard Dobbs, Jaana Remes, and Fabian Schaer
Most companies still take a national or regional view when
allocating resources for global growth. They should shift their
focus to fast-growing cities.
A massive wave of urbanization is propelling growth across the
emerging world. This urbanization wave is shifting the world’s
economic balance toward the east and south at unprecedented speed
and scale. It will create an over-four-billion-strong global “consumer class” by 2025, up from around one billion in 1990. And nearly
two billion will be in emerging-market cities. These cities will inject
nearly $25 trillion into the global economy through a combination of
consumption and investment in physical capital. This is a very
significant shot in the arm for a global economy that continues to
suffer from pockets of acute fragility.
Yet few business leaders focus on the importance of cities when
establishing growth priorities. In a recent survey, we found that fewer
than one in five executives makes location decisions at the city
(rather than country) level. Few executives expected this approach to
change over the next five years, and more than 60 percent regarded
cities as “an irrelevant unit of strategic planning.”1 As these new
1“McKinsey Global Survey results: Relocating for growth” was conducted in February
2012. The survey received responses from 2,962 executives, representing the full range
of regions, industries, and company sizes. To adjust for differences in response rates, we
weighted the data by the contribution of each respondent’s nation to global GDP.
$30 trillion decathlon compendium
Urban World
Exhibit
1 of 3
2
Exhibit 1
Approximately 440 emerging-market cities are poised to deliver close
to half of global GDP growth.
Cities’ contribution to global GDP and GDP growth1
Emerging-market cities
443 cities in the City 6002
Other large cities
Small cities and rural areas
Other large cities
Small cities and rural areas
Developed-market cities
157 cities in the City 6002
Global GDP, 2010, %
Global GDP growth, 2010–25, %
100% = $63 trillion (real exchange rate3)
100% = $50 trillion (real exchange rate4)
18
36
City 600
Other
12
17
6
12
16
4
5
City 600
Other
47
13
14
12,600+ cities, including large cities as well as smaller cities and rural areas.
2The top 600 cities by their contribution to global GDP growth 2010–25.
3Reflects market exchange rate.
4Prediction based on differences in per capita GDP growth rates of countries relative to the growth of US per capita GDP.
Source: McKinsey Global Institute Cityscope 2.0
urban-growth zones flourish, there’s a cost to companies that lack a
clear view of the emerging landscape—chiefly in the potential for
resource misallocation.
Shifting investment away from established markets to more promising
areas can be difficult, as our colleagues have shown in separate
research.2 Budgets are often “sticky” because companies lock into
current rather than future opportunities. And many middle-tier
emerging-market cities, however attractive, may be unfamiliar. Take
Foshan, Porto Alegre, and Surat—cities that are unlikely to be
high on the priority lists of global executives, though each has more
than four million inhabitants, fast growth, and a vibrant base
of consumers. Indeed, each of these cities will contribute more to
global growth than Madrid, Milan, or Zurich.
And they are far from isolated examples. Our research indicates that
440 emerging-market cities, very few of them “megacities,” will
2See Stephen Hall, Dan Lovallo, and Reinier Musters, “How to put your money where your
strategy is,” mckinseyquarterly.com, March 2012.
$30 trillion decathlon compendium
Urban World
Exhibit 2 of 3
3
Exhibit 2
A city-specific lens can reveal urban areas with the highest growth
potential in a given market.
Top cities by growth in given market, 2010–25
Emerging region
Developed region
Elderly
higher-income
consumers1
(aged
65+)
Rank
Young
entry-level
consumers2
(aged 14 or under)
Consumer
spending on
laundry
care products3
Demand for
Municipal water
commercial floor demand
space4
1
Shanghai
Lagos
São Paulo
New York
Mumbai
2
Beijing
Dar es Salaam
Beijing
Beijing
Delhi
3
Tokyo
Dhaka
Rio de Janeiro
Shanghai
Shanghai
4
Tianjin
Ouagadougou
Shanghai
Los Angeles
Guangzhou
5
Mumbai
Khartoum
Mexico City
Tokyo
Beijing
6
São Paulo
Ghaziabad
Moscow
Washington, DC
Buenos Aires
7
Osaka
Sanaa
Bangkok
Dallas
Kolkata
8
Chongqing
Nairobi
Istanbul
São Paulo
Khartoum
9
Delhi
Luanda
Manila
Guangzhou
Dhaka
10
Nanjing
Baghdad
Johannesburg
Chicago
Istanbul
1
With household income >$20,000 at purchasing-power parity.
With household income of $7,500–$20,000 at purchasing-power parity.
3
Based on city-level market-demand-growth model.
4
Includes replacement floor space.
2
Source: McKinsey Global Institute analysis
account for close to half of expected global GDP growth between 2010
and 2025 (Exhibit 1). Crafting and implementing strategies that
emphasize such cities will require new attention from senior leaders,
new organizational structures that take account of urban rather
than just regional or national markets, and potentially difficult choices
about which activities to scale back elsewhere to free up resources
for new thrusts.
Companies that adopt such a strategic approach may gain earlymover benefits. For some, developing better insights into demographic
and income trends—such as an understanding of the urban areas
where the population of older, wealthier consumers is growing most
rapidly—will be sufficient. Others may need to dig deeper, learning
the market dynamics of specific products in target cities. To illustrate
the different panoramas of opportunity that appear when companies use a city-specific lens, we looked at five business sectors, each
with different demand profiles. We then ranked cities with the
highest growth potential for each of the sectors (Exhibit 2). Among
the takeaways:
4
•Companies marketing health care products to seniors would find
Shanghai and Beijing topping the list of cities with growing
populations of older consumers whose incomes are sufficiently high
(above $20,000 on a purchasing-power-parity basis) to afford
these products. Tokyo and Osaka are the only developed-world cities
among the top ten—a sign that well-off, aging consumers no
longer are found exclusively in developed markets.
•Baby food is at the other end of the age spectrum. Combining
income and demographic data—in particular, the numbers of households with young children—we found that cities in Africa offer
great potential. More than half of the top ten cities enjoying rapid
growth in the number of children3 who live in households with
incomes from $7,500 to $20,000 (on a purchasing-power-parity
basis) are in Africa.
•São Paulo, Beijing, Rio de Janeiro, and Shanghai rank highest in a
targeted analysis of market growth for laundry products. In fact,
over the next decade, São Paulo will experience more growth in the
sale of detergents and related cleaning products than the national
markets of France or Malaysia will. That’s just a small shard in the
global-consumption mosaic for emerging cities. We project that
urban consumers in developing countries will spend an additional
$14 trillion annually by 2025.
•By 2025, cities worldwide will need to spend at least $10 trillion more
per year on physical capital—everything from office towers to
new port facilities—than they do today. In building construction,
the new floor space required will be equivalent to 85 percent
of today’s entire residential and commercial building stock; 40 percent of that growth will be in Chinese cities.
•Urban water-related infrastructure, another pressing need, will
require $480 billion in global investment by 2025, with 80 percent
of that flowing to emerging-market cities. Mumbai and Delhi will
be the leaders in that spending.
In addition to supporting geographic priority-setting, a city-level view
can help companies sharpen their marketing strategies. Product
adoption rates often are tied to local preferences that can vary across
different cities within the same country—preferences that marketers
3Individuals aged 14 and under qualify as children for the purposes of this analysis.
Q 4 2012
Urban World
Exhibit 3 of 3
5
Exhibit 3
Awareness of cities’ different spending patterns across products
can sharpen a company’s marketing focus.
Example: average yogurt consumption per household in 2010, by cities in China1;
index: consumption in Hefei households with incomes <$13,700 = 1.02
For every unit of
yogurt consumed by
lower-income
Hefei households . . .
. . . other households consumed more
(sometimes significantly more).
+2.7
+1.7
+1.2
+1.1
1.0
+0.1
Hefei
Jinhua
+0.3
Lianyungang Wuhan
Households with 2010 annual
incomes <$13,700
+0.2
Hefei
Jinhua
Lianyungang Wuhan3
Households with 2010 annual
incomes >$33,600
1 With 2010 populations between 1.1 million (Lianyungang) and 9.7 million (Wuhan).
2Income levels adjusted for purchasing-power parity (PPP); $1 at PPP = 3.9 renminbi.
3For households earning >$51,900, since data for households earning $33,600–$51,900 not available.
Source: 2010 McKinsey survey of 15,000 Chinese consumers; McKinsey Global Institute analysis
may miss when they follow the time-honored approach of plotting
adoption curves that trace purchases by levels of household income and
by product types within categories. Yogurt consumption shows the
types of variations that a national view might not pick up: we found,
even after adjusting for income levels, that typical households in
Wuhan spent significantly more on yogurt than their counterparts in
three comparable Chinese cities did (Exhibit 3). Awareness of different spending patterns by city across products should give companies
a better basis for allocating marketing and distribution resources.
As the locus of global economic activity shifts to developing nations,
companies should be aware of the growth dynamic that’s playing
out in cities. Leaders who give their strategies an urban dimension
could find themselves positioned to allocate investments more
effectively and to seize more readily the many opportunities at hand.
Richard Dobbs is a director of the McKinsey Global Institute (MGI) and a director
in McKinsey’s Seoul office; Jaana Remes is a senior fellow at MGI and is based
in the San Francisco office; Fabian Schaer is a consultant in the Zurich office.
Copyright © 2012 McKinsey & Company. All rights reserved.
Download