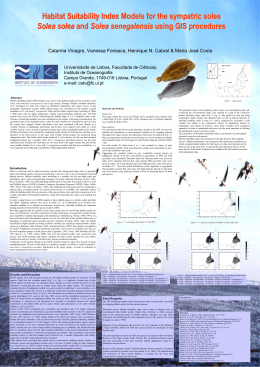
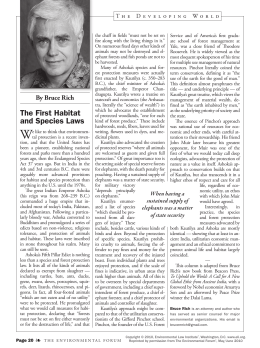
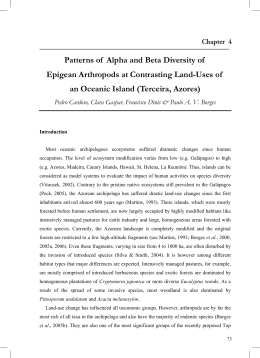
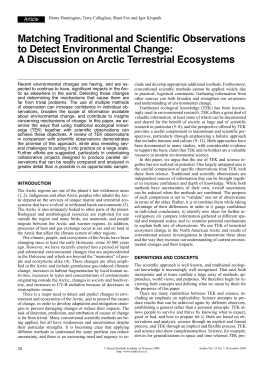
Oecologia (2013) 172:1007–1016
DOI 10.1007/s00442-012-2549-8
POPULATION ECOLOGY - ORIGINAL RESEARCH
The effect of snow cover on lemming population cycles
in the Canadian High Arctic
Frédéric Bilodeau • Gilles Gauthier
Dominique Berteaux
•
Received: 14 August 2012 / Accepted: 23 November 2012 / Published online: 12 December 2012
Ó Springer-Verlag Berlin Heidelberg 2012
Abstract Rising temperatures and changes in the precipitation regime will have a strong impact on the quality
of the snow cover in the Arctic. A snow cover of good
quality protecting lemmings from cold temperatures and
predators is thought to be an important factor for maintaining the cyclic dynamic of their populations in the
tundra. We examined if the characteristics of annual fluctuations (amplitude and shape of phases) in brown lemming (Lemmus trimucronatus) density could be determined
by snow depth, snow density, sub-nivean temperature and
persistence of snow. Using an 18-year time series of brown
lemming abundance on Bylot Island in the Canadian Arctic, we tested if snow variables could explain the residual
variation between the observed lemming density and the
one predicted by models where cyclicity had been
accounted for. Our analysis provides support for the
hypothesis that snow cover can affect the amplitude and
possibly also the periodicity of lemming population cycles
in the High Arctic. Summer abundance of brown lemmings
was higher following winters with a deep snow cover and a
low-density snow pack near the ground but was unaffected
by the date of establishment or melting and duration of the
Communicated by Janne Sundell.
F. Bilodeau (&) G. Gauthier
Département de Biologie and Centre d’Études Nordiques,
Pavillon Vachon, Université Laval, 1045 Avenues de la
Médecine, Québec City, QC G1V 0A6, Canada
e-mail: [email protected]
D. Berteaux
Chaire de Recherche du Canada en Conservation des
Écosystèmes Nordiques and Centre d’Études Nordiques,
Université du Québec à Rimouski, 300 allée des Ursulines,
Rimouski, QC G5L 3A1, Canada
snow cover. Two snow variables showed a temporal trend;
mean winter snow depth tended to increase and date of
establishment of the hiemal threshold occurred earlier over
time. These temporal trends, which should be favourable to
lemmings, may explain why healthy population cycles
have apparently been maintained at our study site contrary
to other Arctic sites.
Keywords Brown lemming Population fluctuations Small mammals Snow density Snow depth
Introduction
Small mammal population cycles have fascinated ecologists for decades and a large number of studies have tried
to explain their high prevalence in northern environments
(Stenseth and Ims 1993; Korpimäki and Krebs 1996;
Stenseth 1999; Hanski et al. 2001; Turchin et al. 2000;
Oksanen et al. 2001; Gilg et al. 2003; Korpimäki et al.
2005; Pitelka and Batzli 2007; Krebs 2011). In recent
years, population cycles in Fennoscandia and some parts
of Greenland have faded out and climatic factors, especially snow cover, have been hypothesized to explain this
(Hörnfeldt 2004; Hörnfeldt et al. 2005; Ims et al. 2008;
Kausrud et al. 2008; Gilg et al. 2009; Ims et al. 2011).
During the arctic winter, which can last up to 8 months,
these rodents remain active and even reproduce under the
snow (MacLean et al. 1974; Sittler 1995; Duchesne et al.
2011). Variations in characteristics of snow cover can
affect quality, and thus selection, of winter habitat (Reid
et al. 2012). This in turn can influence survival, especially
of young born during winter, and possibly reproduction
(Yoccoz and Ims 1999; Aars and Ims 2002). Snow cover
can also affect demography by reducing food availability,
123
1008
for instance during episodes of ground icing, or by limiting predator access to small mammals (Ims and Fuglei
2005; Kausrud et al. 2008; Gilg et al. 2009; Duchesne
et al. 2011).
A snow pack of good quality for small mammals
should have several characteristics. First, it should favour
the formation of a low-density depth hoar and of a subnivean space at its base, which facilitate tunnelling and air
circulation, and provide room for small mammals to live
and feed (McKay and Adam 1981; Marchand 1996; Sanecki et al. 2006). Second, it should insulate small
mammals from extreme air temperature variations and
protect them from the coldest meteorological events
(Pomeroy and Brun 2001; Duchesne et al. 2011; Reid
et al. 2012). The thermal insulation provided by a snow
layer is proportional to its depth but inversely proportional
to its density (Berry 1981; Marchand 1982). Thermal
insulation levels off when snow depth reaches 20–30 cm
(depending on snow density), a depth referred to as the
‘‘hiemal threshold’’ (Pruitt 1970). Third, it should prevent
ground icing due to rain or melting (Korslund and Steen
2006). This effect is maximized when a deep snowpack
forms early in fall (Bergsten et al. 2001; Rixen et al.
2004). Fourth, it should persist long enough for the above
effects to occur throughout the cold season.
Snow cover itself is unlikely to cause cyclic fluctuations of small mammal populations, but its high quality is
believed to be an essential condition for periodic population outbreaks of arctic rodents like lemmings (MacLean et al. 1974; Ims et al. 2008; Kausrud et al. 2008).
Therefore, snow cover could influence several aspects of
these fluctuations, such as the stationarity of cycles (i.e.
the stability of their period length), the amplitude of
peaks, or the shape of individual increase–decrease phases. For instance, food or predator abundance may provide the conditions for a peak to occur, but a snow cover
of poor quality may decrease its amplitude or delay its
occurrence (Gilg et al. 2009). However, very few studies
have tried to relate the different characteristics of the
snow cover to those of small mammal fluctuations
(Kausrud et al. 2008). We addressed this gap using an
18-year record of fluctuations in brown lemming (Lemmus trimucronatus) abundance at a Canadian high Arctic
site where population cycles are still occurring (Gruyer
et al. 2008). We tested the general hypothesis that a snow
cover of high quality and high persistence has a positive
effect on the amplitude of lemming cycles. More specifically, we examined if the characteristics of annual
fluctuations (amplitude and shape of phases) in lemming
density were affected by snow depth, snow pack density,
temperature of the sub-nivean space, duration of the snow
cover and dates at which it became established and
disappeared.
123
Oecologia (2013) 172:1007–1016
Materials and methods
Study area
The study was conducted on the south plain of Bylot
Island, Sirmilik National Park, Nunavut Territory, Canada
(73°080 N, 80°000 W). The main study area (70 km2) consists of tundra polygons, thaw lakes and ponds forming
wetlands at the bottom of a valley and is surrounded by
drier mesic habitat in the upland areas and nearby slopes
and hills. Wet areas are dominated by sedges (Carex
aquatilis, Eriophorum sheuchzeri) and graminoids
(Dupontia fisheri and Pleuropogon sabinei) and mesic
areas mainly by forbs (Saxifraga spp., Potentilla spp.,
Ranunculus spp.), graminoids (Arctagrostis latifolia,
Alopecurus alpinus, Poa spp., Luzula spp.), shrubs (Salix
spp., Dryas integrifolia, Cassiope tetragona) and mosses
(Duclos 2002; Duchesne et al. 2011). The average air
temperature from October to June is -23.4 ± 0.4 °C and
the average snow depth at the end of winter is 31.3 cm
(Cadieux et al. 2008).
Two species of small mammals live in the study area,
the brown and the collared lemming (Dicrostonyx groenlandicus). Although both species tend to fluctuate synchronously, only the brown lemming shows clear, large
amplitude multiannual population cycles at our study site
(Gruyer et al. 2008). Collared lemming populations are low
in most years and maximum population size is always an
order of magnitude lower than that of the brown lemming.
For these reasons, this study focuses only on brown lemmings. In summer, brown lemmings prefer wet habitat but
can also be abundant in mesic habitats (Batzli and Jung
1980; Morris et al. 2000, 2011; Ale et al. 2011). During
winter, they usually prefer mesic habitat, probably because
its topography is, unlike that of flat wetlands, more conducive to the accumulation of a deep snow cover in snow
drifts (Batzli et al. 1983; Pitelka and Batzli 1993; Sittler
1995; Duchesne et al. 2011). Their main predators are the
snowy owl (Bubo scandiaca), long-tailed jaeger (Stercorarius longicaudus), rough-legged hawk (Buteo lagopus),
glaucous gull (Larus hyperboreus), arctic fox (Vulpes
lagopus) and ermine (Mustela erminea). The latter two
mammals are the only winter predators.
Lemming densities
We trapped brown and collared lemmings using snap traps
from 1994 to 2011 to obtain an index of abundance of each
species. Trapping was conducted annually at the end of
July on two sites simultaneously, one in wet habitat using
four 240-m long parallel transects 100 m apart and the
other in mesic habitat (since 1995) using two 500-m long
parallel transects. We used Museum special traps baited
Oecologia (2013) 172:1007–1016
with oat and peanut butter. Each transect consisted of 17
(wet) to 34 (mesic) stations spaced by 15 m. Until 2006,
each station had one trap set near burrows or runways
(when possible) within a 2-m radius and trapping lasted
10 days (for more details see Gruyer et al. 2008). From
2007 onward, we set three traps per station and trapping
lasted 3 or 4 days. Both methods yielded similar results (G.
Gauthier, unpublished data). The total number of trapnights varied between 500 (1994–2006) and 720–960
(2007–2011) at each site, depending on year.
From 2004 to 2011, live trapping was also conducted to
obtain accurate estimates of brown lemming densities with
capture-mark-recapture methods. Live trapping was conducted in mid-July for 3 or 4 consecutive days on two grids,
one in the wet and one in the mesic habitat. Trapping grids
were 10.9 ha and consisted of 144 traps spaced every 30 m
and laid out in a Cartesian plane of 12 rows and columns.
Longworth live traps were baited with apple and were
checked every 12 h (see Gruyer et al. 2010). Lemming
populations during trapping sessions were considered
closed for the analysis. The number of individuals trapped
annually varied from two to 187, and the recapture rate was
relatively high. All density estimates were carried out in
DENSITY 4.4 (http://www.otago.ac.nz/density) using Efford’s maximum likelihood spatial model (Efford et al.
2004; Borchers and Efford 2008; see also Krebs et al. 2011).
Because snap trapping provides only an index of abundance, we used the more precise density estimate obtained
by live trapping. We transformed the abundance index for
years prior to 2004 into density estimates using results
from the linear relationship between live trapping and snap
trapping data from 2004 to 2011, using each trapping grid
as a sampling unit (F1,13 = 65.2, P \ 0.001, R2 = 0.82).
Snow cover
An automated weather station installed at our field site
provided the following hourly, year-round data since 1993:
air (2 m above ground) and ground (2 cm below ground)
temperatures, air humidity, wind velocity and direction,
incoming and reflected radiation, and snow depth (since
2001). To fill in periods when information was missing
(primarily snow depth prior to 2001; occasionally other
variables due to sensor breakdown), we retrieved data from
the Pond Inlet airport weather station situated at 80 km
from our site (for snow depth in April and May 1994, we
had to use data from the Nanisivik weather station situated
150 km from our site). All climatic data including snow
depth were recorded daily at those weather stations. Following Dickey et al. (2008), we used linear models to relate
the data from our weather station to those from Pond Inlet
(or Nanisivik) during periods of overlap. Strong relationships were found for most variables (e.g. daily snow depth
1009
values: F1,464 = 959.2, P \ 0.001, R2 = 0.67 for Pond
Inlet; F1,719 = 139.5, P \ 0.001 R2 = 0.14 for Nanisivik).
We used these relationships to predict missing values in
our weather data. For winter 2009–2010, no snow depth
data were available from any weather station; mean winter
snow depth had to be estimated from a relationship
between mean snow depth determined at our weather station and that obtained from our snow-melt transects in
early spring during years of overlap (F1,7 = 4.04,
P = 0.084, R2 = 0.37). Since 1995, snow depth has been
measured manually every other day from ca. 1 to 20 June
on 50 stations along two 250-m transects located 100 m
apart. This information was also used to determine the
timing of snow melt (i.e. when snow had completely
disappeared).
Prior to snow melt, we dug snow pits at 60 random
locations throughout our study site in 2010 (19–30 May)
and 2011 (19–26 May). At each site, a temperature logger
(I-button) had been set at ground level the previous fall to
record sub-nivean temperatures at 5-h intervals during
winter. We measured snow depth, the number of recognizable layers and their respective thickness, hardness,
density, snow grain size and type, following the protocol
developed by M. Bernier and Y. Gauthier (personal communication) and the snow classification by Fierz et al.
(2009). We also measured the temperature gradient of each
snow profile by taking from five to six measurements at
varying depth.
We modelled the snow conditions with the SNOWPACK software using our meteorological data as input
variables (see Bartelt and Lehning 2002; Lehning et al.
2002a, b for detailed information and methods). This
allowed us to estimate the evolution of the snowpack on a
daily basis throughout the winter and especially to estimate
snow density at ground level, a key parameter that we
could not directly measure during winter. We used the data
from our snow profiles made in May 2011 to test
SNOWPACK predictions for density of the ground-level
snow layer. The weighted-average of snow density of the
bottom 5 cm estimated from the snow profiles was 281.2
kg m-3 (95 % confidence interval: 267.6–294.7 kg m-3).
The SNOWPACK estimate for that layer on the same dates
(278.8 kg m-3) was very close and well within the confidence interval, which suggests that SNOWPACK performed well.
We could not estimate snow density with SNOWPACK
for winter 2009–2010 due to lack of daily snow depth data.
As a substitute, we used the average snow density measured at ground level in our snow pits that year
(146.8 kg m-3). Density measured before the onset of
snowmelt should be representative of the mean winter
density because major changes in density usually do not
occur prior to that (McKay and Gray 1981).
123
1010
Oecologia (2013) 172:1007–1016
Statistical analyses
Our premise was that snow cover did not generate the
lemming cycle but could modulate some of its parameters.
Therefore, we worked in three steps to examine if some
descriptive variables of snow cover explained variations in
the amplitude and periodicity of annual fluctuations in
lemming density: we generated cycles using three different
models, we extracted residuals from the relations between
these modelled cycles and our observed annual lemming
densities, we regressed the obtained residuals with the
snow variables that we thought could affect lemming
populations. We reasoned that these analytical steps would
allow us to assess directly the effects of individual snow
cover variables on lemming abundance while removing the
potential effects of the other (unknown) variables generating the cycles.
Generation of cycles
completely melted, and duration (in days) of the snow
cover. We also added year as a continuous variable in our
model to test for any temporal trend in population densities. We tested for multicollinearity among snow variables.
Duration of snow cover and time of snow establishment
were highly correlated (r = -0.87, t = -7.09, df = 16,
P \ 0.001) and these two variables were thus never used in
the same model. Correlations among the remaining independent variables (all, B0.61) were considered acceptable
(Grewal et al. 2004).
To avoid model saturation due to our relatively short
time series (17 and 18 years according to habitat), a
maximum of three variables were used at the same time in
each model. All models were compared using second-order
Akaike’s information criterion adjusted for small sample
size (AICc) and AICc weight (Burnham and Anderson
2002). All analyses were conducted in R 2.11 (R Development Core Team 2010). Mean values are presented with
SE throughout.
We first generated a sinusoidal model with a 4-year periodicity, the average periodicity of brown lemming cycles at
our site (Gruyer et al. 2008) using the following equation:
Results
xt ¼ 2 sinð2tpÞ
Lemming cycles
ð1Þ
where xt stands for the ln (brown lemming summer density ? 0.01) in year t.
We then modelled the observed lemming cycle by
adjusting first- and second-order autoregressive models
(Stenseth et al. 1996; Stenseth 1999) using the following
equations:
xt ¼ b0 þ b1 xt1 þ et
ð2Þ
xt ¼ b0 þ b1 xt1 þ b2 xt2 þ et ;
ð3Þ
where b0 is the coefficient of the intercept, b1 and b2
represent the first- and second-order autoregressive coefficients and et is the error term.
Extraction of residuals
To obtain residuals, we calculated the differences between
the annual densities predicted by the three above models
ð^xt Þ and our annual observed values of lemming densities.
Regression of residuals with snow variables
We used seven variables descriptive of snow cover: mean
daily snow depth, mean daily density of the bottom 5 cm of
the snow pack, mean daily temperature of the sub-nivean
space, date at which the snow cover became established,
date at which the hiemal threshold (defined as 20 cm snow
depth; Pruitt 1970) was reached, date when snow had
123
Throughout the study period, brown lemmings showed a
fairly regular population cycle (Fig. 1) of high amplitude
with peaks occurring every 3–4 years. During peak years,
densities reached up to 41.4 lemmings ha-1 in the wet grid
and 20.4 lemmings ha-1 in the mesic grid. During the low
phases, densities were as low as 0.07 lemmings ha-1 in
both habitats. Based on the mean densities for peak and
low years obtained with live trapping, this represents
37-fold and 94-fold variations in the wet and mesic grids,
respectively.
Snow variables
Most of the seven snow variables examined showed
moderate to large fluctuations over the 18-year period
(coefficient of variation ranging from 3.9 to 27.8 %) and
only two of them showed a temporal trend (Fig. 2). Mean
winter snow depth tended to increase (F1,16 = 4.31,
P = 0.054) and date of establishment of the hiemal
threshold occurred earlier over time (F1,16 = 8.69,
P = 0.009). These trends are consistent with those reported
elsewhere in the Arctic (SWIPA 2011).
Modelling of cycles
Whereas the sinusoidal approach always generated a cycle
and thus allowed extraction of residuals between the
Oecologia (2013) 172:1007–1016
Fig. 1 Time series of summer brown lemming densities (no. ha-1) in
the mesic and wet grid from 1994 to 2011. Error bars represent SE
(only available for the period where data were from live trapping)
generated cycle and the observed values, the same was not
necessarily true with the autoregressive approach. Only the
first-order autoregressive model yielded a discernible cyclic pattern of fluctuations in the mesic grid, though the fit
was not as good as with the sinusoidal model. None of the
autoregressive (i.e. first- and second-order) models yielded
a cycle in the wet grid, and thus the effect of snow variables was not tested on those residuals.
1011
(a)
(b)
(C)
(d)
(e)
(f)
(g)
Effect of snow variables on lemming abundance
Mesic habitat
Model selection for residuals of brown lemming summer
density from the sinusoidal model indicated that some snow
variables affected lemming density in the mesic grid
(Table 1). One variable appeared most influential, mean
winter snow depth (cumulative AICc weight across models = 0.99). Models including ground temperature and
mean winter density of the bottom snow layer were close
competitors (DAICc = 0.61 and 0.94, respectively). However, across models snow density had more weight than
ground temperature (cumulative AICc weight = 0.32 and
0.22, respectively). Snow depth was positively related to
lemming densities (F1,15 = 6.83, P = 0.020, R2 = 0.31;
b = 28.2 ± 10.8; Fig. 3) whereas snow density was negatively related (F1,15 = 4.58, P = 0.049, R2 = 0.23; b =
-0.017 ± 0.008; Fig. 3). There was a positive, though nonsignificant, trend between lemming density and ground
temperature (F1,15 = 2.56, P = 0.131, R2 = 0.15;
b = 0.44 ± 0.28). Adding snow depth and density to the
sinusoidal model improved its fit with the observed data
(Fig. 4). For instance, the model with snow variables predicted well the low lemming density observed in summer
Fig. 2 Time series of mean density of the bottom 5 cm of the snow
pack over the winter (a; black circles), mean daily snow depth over
the winter (b; white squares), date at which the snow cover became
established (c; black crosses), date of establishment of the hiemal
threshold (d; upward black triangles), date when snow has completely melted (e; grey diamonds), duration of the snow cover (f;
downward white triangles), and mean daily temperature of the subnivean space over the winter (g; black stars), from winter 1993–1994
to 2010–2011 on Bylot Island, Nunavut. Solid lines represent
temporal trends (P B 0.05)
1999 and the increase that started in 2010 and lead to a peak
in 2011, 3 years after the previous peak instead of 4 years as
in the preceding ones. This suggests that snow characteristics may not only affect the amplitude of lemming fluctuations but possibly also their periodicity. However, the
sharp 2005 decline remained unpredicted.
The same analysis based on the residuals from the firstorder autoregressive model also suggested that brown
lemming density was affected by mean snow depth
123
1012
Oecologia (2013) 172:1007–1016
Table 1 Model selection for the effect of snow variables on residuals
of summer brown lemming density in the mesic habitat from the
sinusoidal model
DAICc
Rank
Model
AICc weight
K
1
Depth
0.00
0.22
1
2
Depth ? Temp
0.61
0.16
2
3
4
Depth ? Dens
Depth ? Snowperiod
0.94
1.84
0.14
0.09
2
2
5
Depth ? Snowdate
2.12
0.08
2
6
Depth ? Dens ? Snowperiod
2.21
0.07
3
7
Depth ? Dens ? Temp
2.60
0.06
3
8
Depth ? Dens ? Snowdate
2.85
0.05
3
9
Depth ? Hiemal
3.45
0.04
2
10
Depth ? Melt
3.49
0.04
2
11
Depth ? Year
3.49
0.04
2
12
Null
6.27
0.01
0
AICc Akaike’s information criterion adjusted for small sample size,
K number of parameters, Depth mean daily snow depth over the
winter, Temp mean daily temperature of the sub-nivean space over the
winter, Dens mean snow density of the bottom 5 cm of the snow pack
over the winter, Snowperiod length of the snowperiod, Snowdate date
at which the snow cover became established, Hiemal date of establishment of the hiemal threshold, Melt date when snow has completely melted, Year continuous variable (temporal trend)
(cumulative AICc weight = 0.76; Table 2) as it was positively related to it (F1,15 = 4.68, P = 0.047, R2 = 0.24;
b = 26.5 ± 12.3). Even though ground temperature and
snow density in the bottom layer were not retained in the
model selections, lemming density also showed a positive
trend with ground temperature (F1,15 = 2.43, P = 0.140,
R2 = 0.14; b = 0.47 ± 0.30) and a negative one with
snow density (F1,15 = 2.45, P = 0.139, R2 = 0.14; b =
-0.014 ± 0.009).
Fig. 3 Plot of the residuals of
brown lemming summer density
[ln(density ? 0.01)] from the
sinusoidal model in relation to
the mean daily snow depth
(a) and the mean density of the
bottom 5 cm of the snowpack
(b) from 1995 to 2011. Solid
line is the regression line and
dashed lines show 95 %
confidence interval
123
(a)
Wet habitat
In the wet grid, model selection for residuals of brown
lemming summer density from the sinusoidal model indicated that the null model was preferred (Table 3). Although
a model with density of the bottom snow layer was a close
competitor (DAICc = 0.32), overall the evidence for this
effect was moderate (cumulative AICc weight = 0.42).
There was a weak trend for a negative relationship between
lemming abundance and snow density (F1,16 = 2.48,
P = 0.135, R2 = 0.13; b = -0.012 ± 0.008). Adding
snow density to the sinusoidal model slightly improved the
fit of the model to the observed data as the low abundance
in 1995, as well as the high abundance in 2010 were better
predicted (Fig. 5).
Discussion
The logic of our approach was to remove analytically the
cyclicity in lemming population fluctuations in order to
better assess the effect of snow parameters on their abundance. This approach is analogous to detrending a time
series before evaluating the effects of covariates (Votier
et al. 2009). Autoregressive models were not always successful in generating cyclic oscillations with our data.
Nonetheless, it is reassuring to find that, whether we
detrended the data with a sinusoidal or an autoregressive
model, the effect of snow variables on residual variations
in lemming abundance remained qualitatively the same.
This suggests that our analysis was not highly sensitive to
the model used to control for the cyclic pattern of
fluctuations.
Our analysis provides support for the hypothesis that
winter snow cover can affect the amplitude and even
(b)
Oecologia (2013) 172:1007–1016
1013
Table 3 Model selection for the effect of snow variables on residuals
of summer brown lemming density in the wet habitat from the
sinusoidal model
Fig. 4 Time series of brown lemming summer densities (no. ha-1) in
the mesic grid from 1995 to 2011. Observed values (Observed),
values predicted from the sinusoidal model (Predicted) and values
predicted from the sinusoidal model with snow depth and snow
density (Predicted ? Snow) are shown
Rank
Model
DAICc
AICc weight
K
1
Null
0.00
0.22
0
2
Dens
0.32
0.19
1
3
4
Depth
Depth ? Hiemal
2.02
2.16
0.08
0.08
1
2
2
5
Dens ? Hiemal
2.23
0.07
6
Temp
2.67
0.06
1
7
Depth ? Dens
2.92
0.05
2
8
Depth ? Year
2.96
0.05
2
9
Dens ? Temp
3.15
0.05
2
10
Depth ? Snowperiod
3.81
0.03
2
See Table 1 for abbreviations and definition of variables
Table 2 Model selection for the effect of snow variables on residuals
of summer brown lemming density in the mesic habitat from the firstorder autoregressive model
DAICc
Rank
Model
AICc weight
K
1
Depth
0.00
0.27
1
2
Depth ? Temp
1.12
0.15
2
3
4
Null
Temp
2.17
2.60
0.09
0.07
0
1
5
Depth ? Snowdate
2.88
0.06
2
6
Depth ? Dens
2.92
0.06
2
7
Depth ? Snowperiod
3.00
0.06
2
8
Depth ? Hiemal
3.02
0.06
2
9
Depth ? Melt
3.42
0.05
2
10
Depth ? Year
3.48
0.05
2
See Table 1 for abbreviations and definition of variables
Fig. 5 Time series of brown lemming summer densities (no. ha-1) in
the wet grid from 1994 to 2011. Observed values (Observed), values
predicted from the sinusoidal model (Predicted) and values predicted
from the sinusoidal model with snow density (Predicted ? Snow) are
shown
possibly the periodicity of lemming population cycles in
the High Arctic. Based on the relationships presented in
Fig. 3, a twofold increase in snow depth could increase
summer density of brown lemmings by a factor of 17 in
mesic habitat whereas a twofold increase in snow density
could decrease their density by a factor of 27. Evidence for
an effect of snow cover in the wet habitat was weaker, with
only a possible negative effect of snow density on brown
lemming abundance. Although brown lemmings tend to
prefer wet habitats in summer, when our trapping occurred,
they can use both habitats (Morris et al. 2000; Gruyer et al.
2010) and during winter they actually tend to avoid wet
habitats where snow accumulation is shallower (Duchesne
et al. 2011). If brown lemmings concentrate in wet habitat
during the summer, especially when densities are low, this
may distort the amplitude locally, and possibly weaken our
ability to detect an effect of snow cover. However, considering that the mesic habitat composes the majority of the
landscape of our study area (85 %), patterns observed in
this habitat may be more representative of the population at
large.
Depth is a key component of the snow cover, influencing most other snow-related parameters (Pomeroy and
Brun 2001). For instance, greater snow depth will permit
higher sub-nivean temperatures and lower snow layers will
be less subject to compaction (by wind for example) and
thus have lower densities. Higher sub-nivean temperatures
will reduce the physiological stress that lemmings undergo
during winter (Chappell 1980; Casey 1981). As deeper
snow will provide a more favourable thermal environment
123
1014
(Duchesne et al. 2011; Reid et al. 2012) and potentially
reduced predation (Duchesne et al. 2011), survival should
be higher. Although we found only weak positive trends of
sub-nivean temperature on density, ground temperature
was not measured in the areas of deepest snow but at
standard weather stations. When snow accumulation is
high, this measurement bias could have a disproportional
effect in areas conducive to high snow accumulation (i.e.
depressions) and thus lead to an improvement in sub-nivean temperature in areas of deepest snow. Lemming winter
habitat selection is also greatly influenced by topography,
with preferred habitat being under greater snow depth
(Sittler 1995; Duchesne et al. 2011; Reid et al. 2012).
Deeper snow could also improve winter reproduction, a
condition believed to be essential for summer outbreaks in
lemmings (Ims and Fuglei 2005; Ims et al. 2011). By
providing a better thermal environment, it could enhance
winter survival of young after weaning. In contrast, Bilodeau et al. (2012) found no effect of experimentally
increased snow on reproductive effort based on proportion
of winter nests with reproduction. However, they could not
measure other parameters such as litter size or early survival of weaned young.
Snow density is a difficult parameter to monitor in the
field throughout the winter and this is why we had to resort
to a modelling approach (SNOWPACK) based on weather
data collected at the study site. SNOWPACK has been
validated in multiple studies (Lundy et al. 2001; Hirashima
et al. 2004; Nishimura et al. 2005; Rasmus et al. 2007) and
improved over the years (Schweizer et al. 2006) although it
has been mostly used in alpine environments to forecast
avalanche risks. In the one year where we could validate
the predictions of the model with field density measurements, predicted and observed values were in good
agreement, but more validations of this model under arctic
conditions are desirable.
Snow density at the base of the snowpack is important
for lemmings because this is where they live during the
winter. A dense, hard snow pack may be less conducive to
the formation of a sub-nivean space and less suitable for
digging and tunnelling (Sanecki et al. 2006). Lemmings
may need to expend more energy to dig in dense snow or,
in the worst case, dense snow could prevent them from
moving to new or better feeding sites, thereby reducing
food availability. Both situations could lead to increased
winter mortality, and thus it was not surprising to find that
dense snow had a negative effect on lemming abundance.
Contrary to what Gilg et al. (2009) found in Greenland,
temporal variations in the establishment, duration or
melting of the snow cover did not seem to play any major
role in modulating lemming abundance even though we
found a significant temporal trend in the hiemal threshold
date, which is now reached earlier in fall than in the past.
123
Oecologia (2013) 172:1007–1016
Because our study site is located in the High Arctic where
the winter is very long (*8 months), inter-annual variability in winter length is perhaps too low to have significant effects. To modulate peaks, reproduction and survival
of young under the snow may be more important than adult
survival (Aars and Ims 2002). Therefore, what happens in
fall (i.e. faster establishment of the hiemal threshold) could
be less important, especially if reproduction occurs mostly
in late winter or early spring. Unfortunately, we have no
information on timing of reproduction under the snow.
At our study site, temperature has increased, mostly in
fall and somewhat in summer, but not in winter (Gauthier
et al. 2011), which remains very cold. At other sites where
annual temperature is warmer and where small mammal
cycles have collapsed, such as East Greenland and Fennoscandia, researchers have linked the latter phenomenon
with climatic changes that occurred mostly in winter, such
as freeze–thaw cycles, freezing rain and ground-icing
events (Hörnfeldt 2004; Hörnfeldt et al. 2005; Kausrud
et al. 2008). Winter ground-icing events in the Canadian
High Arctic are relatively rare and no ice was found at the
bottom of the snow profiles that we dug. Furthermore, as
the SNOWPACK model provides estimates of the density
of every snow layer, it can help in detecting the occurrence
of icing events. No such events were detected based on the
long-term climatic record at our study site.
The temporal trend towards greater snow depth that we
detected, which should have a positive effect on lemming
population growth based on our results, and the faster
establishment of the hiemal threshold, may both result from
the recent increase in fall air temperature (Gauthier et al.
2011; SWIPA 2011). Indeed, higher temperatures may
have increased air humidity, which in turn may have
accentuated precipitation. In this context, it is not surprising that lemming cycles have not collapsed in our region of
the Arctic.
Although our analysis provided some insights on the
role of snow cover in brown lemming population dynamics, it was somewhat limited by the climatic data available.
A first problem is that those data came from standard
weather stations, which may not always accurately represent conditions experienced by lemmings in their microhabitat. A second problem was that some of the variables
that we used were not directly measured but had to be
indirectly derived (e.g. snow density). A third problem is
that several measurements were taken at a single site (e.g.
sub-nivean temperature, snow depth) and thus did not take
into account spatial variability. More accurate field measurements of snow properties and of its persistence taken
during the entire course of the winter and in the different
habitats occupied by lemmings would be important to
validate and strengthen our findings. However, accessing
study sites in winter, particularly in the Canadian Arctic, is
Oecologia (2013) 172:1007–1016
logistically difficult and very costly. Improvements in
automated recording systems could alleviate some of these
problems. For instance, systems recently developed to
automatically record snow conductivity and density (Morin
et al. 2010) could vastly improve our abilities to monitor
changes in the thermal properties of the snow over the
winter. Nonetheless, finding the most relevant climatic
variables at the scale experienced by small mammals will
remain a challenge.
Acknowledgments We thank D. Sarrazin for maintaining our
weather stations, M. C. Cadieux and I. Laurion for their help in
processing the meteorological data and M. Bernier and Y. Gauthier
for help with field methods and material for snow pits. We also thank
M. Desnoyers and E. Soininen for help in digging the snow pits and
the numerous field assistants that have trapped lemmings over the
years at our site. The research relied on the logistic assistance of the
staff of the Polar Continental Shelf Program (PCSP, Natural
Resources Canada) and of Sirmilik National Parks, Nunavut. The
research was funded by the Natural Sciences and Engineering
Research Council of Canada, the Canadian federal government’s
International Polar Year program (project MD-021) and the Northern
Student Training Program, both administered by Indian and Northern
Affairs Canada, the Canadian Network of Centres of Excellence
ArcticNet, PCSP and the Fonds Richard-Bernard of the department of
biology of Université Laval.
References
Aars J, Ims RA (2002) Intrinsic and climatic determinants of
population demography: the winter dynamics of tundra voles.
Ecology 83:3449–3456
Ale SB, Morris DW, Dupuch A, Moore DE (2011) Habitat selection
and the scale of ghostly coexistence among Arctic rodents. Oikos
120:1191–1200
Bartelt PB, Lehning M (2002) A physical SNOWPACK model for
avalanche warning services. Part I: numerical Model. Cold Reg
Sci Technol 35:123–145
Batzli GO, Jung HJG (1980) Nutritional ecology of microtine rodents:
resource utilization near Atkasook, Alaska. Arct Alp Res
12:483–499
Batzli GO, Pitelka FA, Cameron GN (1983) Habitat use by lemmings
near Barrow, Alaska. Holarctic Ecol 6:255–262
Bergsten U, Goulet F, Lundmark T, Löfvenius MO (2001) Frost
heaving in a boreal soil in relation to soil scarification and snow
cover. Can J For Res 31:1084–1092
Berry MO (1981) Snow and climate. In: Gray DM, Male DH (eds)
Handbook of snow: principles, processes, management and use.
Pergamon, Willowdale, pp 32–59
Bilodeau F, Reid DG, Gauthier G, Krebs CJ, Berteaux D, Kenney AJ
(2012) Demographic response of tundra small mammals to a
snow fencing experiment. Oikos. doi:10.1111/j.1600-0706.2012.
00220.x
Borchers DL, Efford MG (2008) Spatially explicit maximum
likelihood methods for capture-recapture studies. Biometrics
64:377–385
Burnham KP, Anderson DR (2002) Model selection and multimodel
inference: a practical information-theoretic approach, 2nd edn.
Springer, New York
Cadieux MC, Gauthier G, Gagnon C, Bêty J, Berteaux D, Lévesque E
(2008) Monitoring the environmental and ecological impacts of
climate change on Bylot Island, Sirmilik National Park.
1015
Unpublished report, Centre d’études nordiques, Université
Laval, Québec
Casey TM (1981) Nest insulation: energy savings to brown lemmings
using a winter nest. Oecologia 50:199–204
Chappell MA (1980) Thermal energetic and thermoregulatory costs of
small arctic mammals. J Mammal 61:278–291
Dickey MH, Gauthier G, Cadieux MC (2008) Climatic effects on the
breeding phenology and reproductive success of an arcticnesting goose species. Global Change Biol 14:1973–1985
Duchesne D, Gauthier G, Berteaux D (2011) Habitat selection,
reproduction and predation of wintering lemmings in the Arctic.
Oecologia 167:967–980
Duclos I (2002) Milieux mésiques et secs de l’ı̂le Bylot, Nunavut
(Canada): caractérisation et utilisation par la grande oie des
neiges. M.Sc. thesis, Department of Chemistry and Biology,
Université du Québec à Trois-Rivière, Québec
Efford MG, Dawson DK, Robbins CS (2004) DENSITY: software for
analysing capture-recapture data from passive detector arrays.
Anim Biodivers Conserv 27:217–228
Fierz C, Armstrong RL, Durand Y, Etchevers P, Greene E, McClung
DM, Nishimura K, Satyawali PK, Sokratov SA (2009) The
international classification for seasonal snow on the ground.
IHP-VII technical documents in hydrology no. 83, IACS contribution no. 1. UNESCO-IHP, Paris
Gauthier G, Berteaux D, Bêty J, Tarroux A, Therrien JF, McKinnon
L, Legagneux P, Cadieux MC (2011) The tundra food web of
Bylot Island in a changing climate and the role of exchanges
between ecosystems. Ecoscience 18:223–235
Gilg O, Hanski I, Sittler B (2003) Cyclic dynamics in a simple
vertebrate predator-prey community. Science 302:866–869
Gilg O, Sittler B, Hanski I (2009) Climate change and cyclic predatorprey population dynamics in the high Arctic. Global Change Biol
15:2634–2652
Grewal R, Cote JA, Baumgartner H (2004) Multicollinearity and
measurement error in structural equation models: implications
for theory testing. Market Sci 23:519–529
Gruyer N, Gauthier G, Berteaux D (2008) Cyclic dynamics of
sympatric lemming populations on Bylot Island, Nunavut,
Canada. Can J Zool 86:910–917
Gruyer N, Gauthier G, Berteaux D (2010) Demography of two
lemming species on Bylot Island, Nunavut, Canada. Polar Biol
33:725–736
Hanski I, Henttonen H, Korpimäki E, Oksanen L, Turchin P (2001)
Small-rodent dynamics and predation. Ecology 82:1505–1520
Hirashima H, Nishimura K, Baba E, Hachikubo A, Lehning M (2004)
SNOWPACK model simulations for snow in Hokkaido, Japan.
Ann Glaciol 38:123–129
Hörnfeldt B (2004) Long-term decline in numbers of cyclic voles in
boreal Sweden: analysis and presentation of hypotheses. Oikos
107:376–392
Hörnfeldt B, Hipkiss T, Eklund U (2005) Fading out of vole and
predator cycles? Proc R Soc Lond B 272:2045–2049
Ims RA, Fuglei E (2005) Trophic interaction cycles in tundra ecosystems
and the impact of climate change. Bioscience 55:311–322
Ims RA, Henden J-A, Killengreen ST (2008) Collapsing population
cycles. Trends Ecol Evol 23:79–86
Ims RA, Yoccoz NG, Killengreen ST (2011) Determinants of
lemming outbreaks. Proc Natl Acad Sci 108:1970–1974
Kausrud KL, Mysterud A, Steen H, Vik JO, Østbye E, Cazelles B,
Framstad E, Eikeset AM, Mysterud I, Solhøy T, Stenseth NC (2008)
Linking climate change to lemming cycles. Nature 456:93–97
Korpimäki E, Krebs CJ (1996) Predation and population cycles of
small mammals. Bioscience 46:754–764
Korpimäki E, Oksanen L, Oksanen T, Klemola T, Norrdahl K, Banks
PB (2005) Vole cycles and predation in temperate and boreal
zones of Europe. J Anim Ecol 74:1150–1159
123
1016
Korslund L, Steen H (2006) Small rodent winter survival: snow
conditions limit access to food resources. J Anim Ecol
75:156–166
Krebs CJ (2011) Of lemmings and snowshoe hares: the ecology of
northern Canada. Proc R Soc Lond B 278:481–489
Krebs CJ, Reid D, Kenney AJ, Gilbert S (2011) Fluctuations in
lemming populations in north Yukon, Canada, 2007–2010. Can J
Zool 89:297–306
Lehning M, Bartelt PB, Brown RL, Fierz C, Satyawali P (2002a) A
physical SNOWPACK model for the Swiss Avalanche Warning
Services. Part II: snow microstructure. Cold Reg Sci Technol
35:147–167
Lehning M, Bartelt PB, Brown RL, Fierz C, Satyawali P (2002b) A
physical SNOWPACK model for the Swiss Avalanche Warning
Services. Part III: meteorological boundary conditions, thin layer
formulation and evaluation. Cold Reg Sci Technol 35:169–184
Lundy CC, Brown RL, Adams EE, Birkeland KW, Lehning M (2001)
A statistical validation of the snowpack model in a Montana
climate. Cold Reg Sci Technol 33:237–246
MacLean SF, Fitzgerald BM, Pitelka FA (1974) Population cycles in
arctic lemmings: winter reproduction and predation by weasels.
Arct Alp Res 6:1–12
Marchand PJ (1982) An index for evaluating the temperature stability
of a subnivean environment. J Wildl Manage 46:518–520
Marchand PJ (1996) Life in the cold: an introduction to winter
ecology. University Press of New England, Hanover
McKay GA, Adam WP (1981) Snow and living things. In: Gray DM,
Male DH (eds) Handbook of snow: principles, processes,
management and use. Pergamon, Willowdale, pp 3–31
McKay GA, Gray DM (1981) The distribution of snowcover. In: Gray
DM, Male DH (eds) Handbook of snow: principles, processes,
management and use. Pergamon, Willowdale, pp 153–190
Morin S, Domine F, Arnaud L, Picard G (2010) In situ monitoring of
the time evolution of the effective thermal conductivity of snow.
Cold Reg Sci Technol 64:73–80
Morris DW, Davidson DL, Krebs CJ (2000) Measuring the ghost of
competition: insights from density-dependent habitat selection
on the co-existence and dynamics of lemmings. Evol Ecol Res
2:41–67
Morris DW, Moore DE, Ale SB, Dupuch A (2011) Forecasting
ecological and evolutionary strategies to global change: an
example from habitat selection by lemmings. Global change Biol
17:1266–1276
Nishimura K, Baba E, Hirashima H, Lehning M (2005) Application of
the snow cover model SNOWPACK to snow avalanche warning
in Niseko, Japan. Cold Reg Sci Technol 43:62–70
Oksanen T, Oksanen L, Schneider M, Aunapuu M (2001) Regulation,
cycles and stability in northern carnivore-herbivore systems:
back to first principles. Oikos 94:101–117
Pitelka FA, Batzli GO (1993) Distribution, abundance and habitat use
by lemmings on the north slope of Alaska. In: Stenseth NC, Ims
123
Oecologia (2013) 172:1007–1016
RA (eds) The biology of lemmings. Linnean Society of London,
Academic Press, London, pp 213–236
Pitelka FA, Batzli GO (2007) Population cycles of lemmings near
Barrow, Alaska: a historical review. Acta Theriol 52:323–336
Pomeroy JW, Brun E (2001) Physical properties of snow. In: Jones
HE, Pomeroy JW, Walker DA, Hoham RW (eds) Snow ecology:
and interdisciplinary examination of snow-covered ecosystems.
Cambridge University Press, Cambridge, pp 45–126
Pruitt WO (1970) Some ecological aspects of snow. In: Ecology of
the subarctic regions. UNESCO, Paris, pp 83–100
Rasmus S, Grönholm T, Lehning M, Rasmus K, Kulmala M (2007)
Validation of the SNOWPACK model in five different snow
zones in Finland. Boreal Environ Res 12:467–488
Reid DG, Bilodeau F, Krebs CJ et al (2012) Lemming winter habitat
choice: a snow-fencing experiment. Oecologia 168:935–946
Rixen C, Haeberli W, Stoeckli V (2004) Ground temperatures under
ski pistes with artificial and natural snow. Arct Antarct Alp Res
36:419–427
Sanecki GM, Green K, Wood H, Lindenmayer D (2006) The
characteristics and classification of Australian snow cover: an
ecological perspective. Arct Antarct Alp Res 38:429–435
Schweizer J, Bellaire S, Fierz C, Lehning M, Pielmeier C (2006)
Evaluating and improving the stability predictions of the snow
cover model SNOWPACK. Cold Reg Sci Technol 46:52–59
Sittler B (1995) Response of stoats (Mustela erminea) to a fluctuating
lemming (Dicrostonyx groenlandicus) population in North East
Greenland: preliminary results from a long-term study. Ann Zool
Fenn 32:79–92
Stenseth NC (1999) Population cycles in voles and lemmings: density
dependence and phase dependence in a stochastic world. Oikos
87:427–461
Stenseth NC, Ims RA (1993) Population dynamics of lemmings :
temporal and spatial variation—an introduction. In: Stenseth NC,
Ims RA (eds) The biology of lemmings. Linnean Society of
London, Academic Press, London, pp 61–96
Stenseth NC, Bjørnstad ON, Falck W (1996) Is spacing behaviour
coupled with predation causing the microtine density cycle? A
synthesis of current process-oriented and pattern-oriented studies. Proc R Soc Lond B 263:1423–1435
SWIPA (2011) Executive summary. Snow, water, ice and permafrost
in the Arctic. http://www.amap.no/swipa/
Turchin P, Oksanen L, Ekerholm P, Oksanen T, Henttonen H (2000)
Are lemmings prey or predators? Nature 405:562–565
Votier S, Hatchwell B, Mears M, Birkhead T (2009) Changes in the
timing of egg-laying of a colonial seabird in relation to
population size and environmental conditions. Mar Ecol Prog
Ser 393:225–233
Yoccoz NG, Ims RA (1999) Demography of small mammals in cold
regions: the importance of environmental variability. Ecol Bull
47:137–144
Download