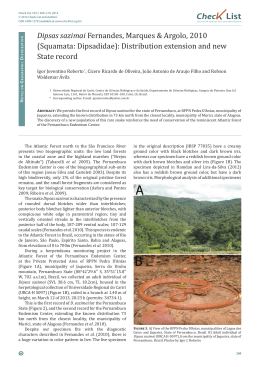
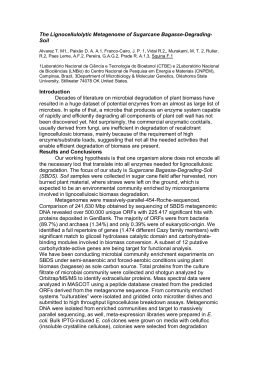
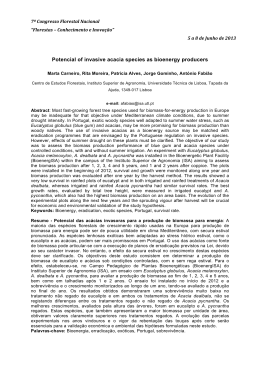
VIII Seminário de Atualização em Sensoriamento Remoto e Sistemas de Informações Geográficas Aplicados à Engenharia Florestal
MAPPING BOREAL FOREST BIOMASS WITH IMAGERY FROM
POLARIMETRIC AND SEMI-POLARIMETRIC SAR SENSORS
MAPEAMENTO DA BIOMASSA FLORESTAL BOREAL COM IMAGENS DOS
SENSORES SAR POLARIMÉTRICOS E SEMI-POLARIMÉTRICOS
Yrjo Rauste, Anne Lonnqvist, Heikki Ahola
VTT Technical Research Centre of Finland, P.O. Box 1000, FIN-02044 VTT, Finland
e-mail: [email protected]
ABSTRACT
Data from ALOS/Palsar and TerraSAR-X were used to estimate forest biomass in Boreal forest zone in Finland. In the
study site in Heinavesi (forest biomass between 0 and 255 tons/ha), the HH-polarised component of dual-polarised
ALOS/Palsar produced biomass estimation accuracies (RMSE) between 35 and 42 tons/ha. In the Kuortane site
(biomass 0…188 tons/ha) the RMSE varied between 25 and 28 tons/ha. Since only two winter-time scenes from
TerraSAR-X were available, TerraSAR-X results were very preliminary. The phase of the HH-VV cross-coherence
produced the highest biomass-correlations among the TerraSAR-X derived features. This produced a biomass
estimation accuracy (RMSE) of 49 tons/ha in the Heinavesi study site.
Key words: Forest biomass; SAR; polarimetry.
RESUMO
Dados do ALOS/Palsar e TerraSAR-X foram usados para estimar a biomassa florestal na região florestal boreal da
Finlândia. Na área de estudos em Heinavesi (biomassa florestal entre 0 e 255 ton/hectares), a componente polarizadaHH de polarização dupla do ALOS/Palsar resultou a estimativa da precisão da biomassa (RMSE) entre 35 e 42
tons/hectares. Na área de Kuortane (biomassa florestal entre 0 e 188 ton/hectare) o RMSE variou entre 25 e 28
ton/hectare. Uma vez que apenas duas cenas de inverno do TerraSAR-X estavam disponíveis, os resultados obtidos
foram muito preliminares. A fase do HH-VV produziu as maiores correlações de biomassa entre os dados derivados da
TerraSAR-X. Isto resultou em uma estimativa de precisão (RMSE) de 49 toneladas/hectare na área de estudo Heinavesi.
Palavras-chaves: biomassa florestal, Sar, polarimetria
INTRODUCTION
Forest biomass is a most important variable for climatic studies and for forest industries. Many studies have
been conducted to estimate forest biomass using remote sensing techniques in the optical domain (e.g.
HAME et al., 1997) and using radar (e.g. LE TOAN et al., 1992, DOBSON et al., 1992, RAUSTE 2006 and
many papers referred therein). Studies (e.g. RAUSTE et al., 1994) conducted using the Airsar sensor of JPL
or other multi-frequency instruments suggest that the highest correlations with forest biomass are obtained
using P band data (wavelength 63 cm). The current choice of frequencies from satellite sensors is limited to
X (wavelength 3 cm), C (wavelength 6 cm), and L (wavelength 23 cm) bands.
Studies with polarimetric SAR, like the Airsar of JPL, also suggest that a fully polarimetric sensor enhances
the potential to map forest biomass. The new polarimetric generation SAR satellites (ALOS/Palsar in 2006,
TerraSAR-X in 2007, and Radarsat-2 in 2007) have created new opportunities to study and map forest
biomass using space-borne sensors.
Measuring forest biomass on ground is a difficult and labour intensive task. Datasets of forest biomass for large
area are difficult to find. In boreal forest, most of forest biomass is in tree stems. The total forest biomass is
closely linked to forest stem volume. Based on regression analyses of biomass measurements and stem volume
data (HAME et al., 1992), forest biomass can be estimated from boreal-forest stem volume data:
596
VIII Seminário de Atualização em Sensoriamento Remoto e Sistemas de Informações Geográficas Aplicados à Engenharia Florestal
B = 0.6 V
(1)
where V is forest stem volume (m3/ha) and B is dry biomass (tons/ha).
STUDY SITES AND DATA
Study sites were located in western and eastern Finland (Figure 1). The primary study site in Heinavesi
(centre coordinates 62º17’ north, 28º east) in eastern Finland consists of forest owned by UPM Ltd., who
also supplied the forest inventory ground data. From a large number of forest stands, a subset of large stands
(2 ha or larger) were selected for forest biomass studies. The main tree species are spruce (Picea abies), pine
(Pinus sylvestris), and birch (Betula pendula and Betula pubescens). The average forest biomass was 66
tons/ha (variation from 0 to 255 tons/ha). The stem volume measurements are expected to be accurate (in
terms of root mean square error) to about 20 percent. The derivation of forest biomass using equation (1)
does not significantly reduce the accuracy of the ground data. The site is gently hilly (elevation 82…139 m
above sea level). The dominant soil type is till or glacial drift.
Finland
Russia
Kuortane
Norway
Sweden
Heinavesi
Estonia
Latvia
Figure 1. Location of study sites in Finland (left) and a ground photo from a pine stand with a biomass of 93
tons/ha.
Figura 1. Localização das áreas de estudo na Finlândia (esquerda) e fotografia terrestre de um povoamento
de pinus com biomassa de 93 tonelada/hectare.
A secondary study site in Kuortane (centre coordinates 62º49’ north, 23º32’ east) in western Finland consists
of forest owned by a large number of private owners. The forest inventory ground data was supplied by the
forest planning organisation “Etela-Pohjanmaan metsakeskus”. The forest biomass varies between 0 and 188
tons/ha (average 57 tons/ha). The main tree species are the same as in the Heinavesi site. The soil is also here
mostly till, but large areas of sandy soils also exist. The elevation varies between 80 and 130 m above sea
level.
A digital elevation model (DEM) was purchased from Land Survey of Finland. The grid spacing of the DEM
was 25 m, which was then interpolated (using cubic spline interpolation) to 12.5 m for ortho-rectification of
ALOS/Palsar data and to 6.25 m for ortho-rectification of TerraSAR-X data.
597
VIII Seminário de Atualização em Sensoriamento Remoto e Sistemas de Informações Geográficas Aplicados à Engenharia Florestal
Table 1 summarises the SAR data that were available in the Heinavesi study site. Meteorological data are
from Kuopio airport about 87 km from the study site. ALOS/Palsar data were in the so called level 1.1
format (single look complex). TerraSAR-X data were also SLC products.
Table 1. ALOS/Palsar and TerraSAR-X data in the Heinavesi study site.
Tabela 1. Dados do ALOS/Palsar e TerraSAR-X referentes à área de estudos em Heinavesi.
Sensor
Mode
Polarisations
Incidence
Date
Temp.
angle (deg)
(º C)
ALOS/Palsar Dual
HH,HV
39
2007-06-12
14
ALOS/Palsar Dual
HH,HV
39
2007-07-28
14
ALOS/Palsar Dual
HH,HV
39
2007-09-12
10
ALOS/Palsar Polarimetric HH,HV,VH,VV 24
2007-10-30
8
TerraSAR-X SpotLight
HH,VV
54
2008-02-05
-6
TerraSAR-X StripMap
HH,HV
42
2008-03-30
-1
1
rain had stopped half an hour before acquisition
2
light snowing had stopped 4 hours before acquisition
Rain
R
R
R1
R
S2
-
The Kuortane site was used to verify results from the Heinavesi site. The ALOS/Palsar data available in the
Kuortane site are listed in Table 2. Meteorological data are from Kauhava airport about 42 km from the study
site.
Table 2. ALOS/Palsar data in the Kuortane study site.
Tabela 2. Dados do ALOS/Palsar referentes à área de estudos em Kuortane.
Mode
Polarisations
Incidence
Date
angle (deg)
Polarimetric
HH,HV,VH,VV
24
2006-11-11
Polarimetric
HH,HV,VH,VV
24
2007-03-29
Polarimetric
HH,HV,VH,VV
24
2007-05-14
Dual
HH,HV
39
2007-06-27
Dual
HH,HV
39
2008-08-12
Dual
HH,HV
39
2008-09-27
3
rain had stopped one and half hours before acquisition
Temp.
(º C)
0
6
11
12
19
4
Rain
R
R
R
R3
-
METHODOLOGY
All SAR data were ortho-rectified using a DEM. Ground control points (GCPs) were used in orthorectification via a block adjustment process. The time-series of dual-polarised ALOS/Palsar scenes were also
co-registered using tie-points (based on image correlation) in connection with the block adjustment. The
ortho-rectification took as a starting point the geo-location data from image auxiliary files. These geolocation data were then revised by a 3-parameter geometric model (translations in northing and easting and
rotation) in connection with block adjustment. The polarimetric ALOS/Palsar data were ortho-rectified in
Stokes matrix format (RAUSTE et al., 2007). Before rectification, the SAR data were pre-averaged: dualpolarised ALOS/Palsar data over 5 lines by 1 columns, polarimetric ALOS/Palsar data over a 3-by-1 window,
and TerraSAR-X data over a 5-by-5 window. Co-polarised cross-correlation was computed over the same
averaging window:
γ = <SHH SVV*>/sqrt(<SHH SHH*><SVV SVV*>)
(2)
where SHH = HH-polarised scattering matrix element and SVV = VV-polarised scattering matrix element.
Angle brackets <…> indicate averaging over the window, and * indicates complex conjugate.
Linear regression models and correlation coefficient were used to evaluate performance in forest biomass
mapping. Root mean square error (RMSE) was also used:
RMSE = sqrt(<(mi – ei)2>)
(3)
598
VIII Seminário de Atualização em Sensoriamento Remoto e Sistemas de Informações Geográficas Aplicados à Engenharia Florestal
where mi is the measured biomass of forest stand i and ei is the estimated biomass of stand i. Angle brackets
<…> indicate averaging over all stands. The RMSE statistics were computed using the “leave one out cross
validation” method: when estimating the error of stand i, the regression model is computed using all other
stands; the final RMSE figure is averaged over all stands.
Before regression analysis, radar data were averaged per forest stand. Averaging was done in power form.
Square root was taken of the average to maintain the amplitude format of the data. Stand boundaries were
taken from forest inventory GIS systems. A raster map of stands was generated using the stand boundaries.
The stand mask was eroded by one pixel to reduce the influence of neighbouring stands on the stand-wise
radar data.
RESULTS
Forest biomass was estimated using equation (1) for all stands. To reduce the effects of variation due to soil
type, all stands that had less than 1 ton/ha were left out from analysis. This left 104 stands in the Heinavesi
Palsar dataset, 103 in the Heinavesi TerraSAR-X dataset, and 129 in the Kuortane Palsar dataset. Table 3
shows the correlation coefficient r and residual mean square error (RMSE) for ALOS/Palsar data in the
Heinavesi study site. Figure 2 shows the corresponding scatter diagrams between forest biomass and
ALOS/Palsar amplitude data.
Table 3. Correlation coefficient (r) and residual mean square error (RMSE) between ALOS/Palsar
amplitude data and forest biomass in the Heinavesi study site.
Tabela 3. Coeficiente de correlação ( r) e erro quadrático médio residual (RMSE) entre a amplitude de dados
ALOS/Palsar e a biomassa florestal na área de estudos em Heinavesi.
Scene
2007-06-12
2007-06-12
2007-07-28
2007-07-28
2007-09-12
2007-09-12
2007-10-30/Pol
2007-10-30/Pol
All of above
Polarisation
HH
HV
HH
HV
HH
HV
HH
HV
All
r
0.66
0.59
0.71
0.60
0.78
0.67
0.47
0.64
0.84
Palsar/Heinavesi, HH Amplitude as a Function of Forest Biomass
RMSE (tons/ha)
42.4
45.6
39.6
44.9
35.0
41.5
49.9
43.1
33.0
Palsar/Heinavesi, HV Amplitude as a Function of Forest Biomass
12000
-5
2500
-8
2007-06-12, r = 0.66
2007-07-28, r = 0.71
2007-09-12, r = 0.78
2007-10-30/Pol, r = 0.47
-9
0
50
100
150
Biomass (tons/ha)
200
250
10000
-15
-16
8000
-17
2007-06-12, r = 0.59
2007-07-28, r = 0.60
2007-09-12, r = 0.67
2007-10-30/Pol, r = 0.64
-18
2000
-19
0
50
100
150
200
250
Biomass (tons/ha)
Figure 2. Stand-wise Palsar amplitude data in Heinavesi study site: left HH, right HV.
Figura 2. Amplitude dos dados “stand-wise” na área de estudos em Heinavesi: esquerda HH, direita HV.
599
HV amplitude (DN)
-7
o
(dB)
σHV
o
(dB)
σHH
-6
HH amplitude (DN)
-14
3000
VIII Seminário de Atualização em Sensoriamento Remoto e Sistemas de Informações Geográficas Aplicados à Engenharia Florestal
As can be seen in Figure 2, the relation between L-band amplitude and forest biomass saturates around 100
tons/ha. Of the two polarisations of the Palsar dual-polarised mode, the HH polarisation is slightly more
robust against the saturation, which is shown as a slightly higher correlation coefficient and smaller biomass
estimation error than in HV polarisation. If restricted to the range below saturation point (0…100 tons/ha),
HV polarisation would give more accurate biomass estimates. The HH polarisation from the only
polarimetric scene of the Heinavesi site performs worse than the HH polarisation from the dual-polarised
scenes. This is most likely due to steeper incidence angle in polarimetric mode (24 degrees) compared to the
dual-polarised mode (39 degrees).
Table 4. Correlation coefficient (r) and residual mean square error (RMSE) between ALOS/Palsar
amplitude data and forest biomass in the Kuortane study site.
Tabela 4. Coeficiente de correlação ( r) e erro quadrático médio residual (RMSE) entre a amplitude de dados
ALOS/Palsar e a biomassa florestal na área de estudos em Kuortane.
Scene
Polarisation
r
RMSE (tons/ha)
2006-11-11
HH
0.23
41.5
2006-11-11
HV
0.70
30.3
2006-11-11
VV
0.09
42.4
2006-11-11
Circular co-pol
0.71
29.7
2007-03-29
HH
0.03
42.6
2007-03-29
HV
0.70
30.4
2007-03-29
VV
0.37
39.5
2007-03-29
Circular co-pol
0.68
31.2
2007-05-14
HH
0.27
40.9
2007-05-14
HV
0.76
27.1
2007-05-14
VV
0.09
42.5
2007-05-14
Circular co-pol
0.72
29.2
2007-06-27
HH
0.74
28.3
2007-06-27
HV
0.80
25.0
2008-08-12
HH
0.78
26.2
2008-08-12
HV
0.78
26.4
2008-09-27
HH
0.80
25.3
2008-09-27
HV
0.79
25.6
All of above
All
0.89
21.9
The biomass estimation results of the Heinavesi study site were verified with data from the Kuortane site
(Table 4). As the biomass level in Kuortane was lower the saturation had less influence on the biomass
estimation results. As in the Heinavesi site, co-polarised (HH and VV) data from polarimetric scenes
(incidence angle 24 degrees) produced low correlations. Cross-polarised data produced high correlations and
low RMSE values. As suggested by a study using polarisation synthesis (RAUSTE et al, 2008), circular copolarisation performed approximately as well as the cross-polarised data.
Since TerraSAR-X data distribution in the TerraSAR-X AO projects started in January 2008, TerraSAR-X
data were available only from winter period. Based on previous studies (e.g. RAUSTE 2006), summer data
are expected to perform better than winter data in forest biomass estimation.
Table 5able 5 shows the correlation coefficient and RMSE data for the two TerraSAR-X scenes of the
Heinavesi study site. Figure 3 shows a scatter diagram for amplitude data. Unlike in ALOS/Palsar data
(Table 3) the correlation between forest biomass and SAR amplitude is negative in TerraSAR-X amplitude
data (Table 5). The negative correlation can be connected with soil and canopy moisture content in these
winter-time scenes with high incidence angle (54 and 42 degrees). The magnitude of correlation coefficient
is also lower than in ALOS/Palsar data, which is most likely due to the shorter wavelength of TerraSAR-X.
600
VIII Seminário de Atualização em Sensoriamento Remoto e Sistemas de Informações Geográficas Aplicados à Engenharia Florestal
Table 5. Correlation coefficient (r) and residual mean square error (RMSE) between TerraSAR-X data and
forest biomass in the Heinavesi study site.
Tabela 5. Coeficiente de correlação ( r) e erro quadrático médio residual (RMSE) entre os dados TerraSAR-X
e a biomassa florestal na área de estudos em Heinavesi.
Scene
2008-02-05
2008-02-05
2008-02-05
2008-02-05
2008-03-30
2008-03-30
All of above
Polarisation
HH
VV
Coherence magnitude
Coherence phase
HH
HV
All
r
-0.59
-0.51
0.15
0.61
-0.49
-0.35
0.71
X-Band Amplitude in Heinavesi as a Function of Forest Biomass
RMSE (tons/ha)
50.8
54.2
62.3
49.4
54.8
59.2
46.3
X-band Amplitude in Heinavesi as a Function of Forest Biomass
-10
1200
-11
o
σHH
(dB)
σ o (dB)
1300
Amplitude (DN*10)
1400
-9
-7
-14
-8
-15
-9
-16
1100
HH/TerraSAR-X, r = -0.59
VV/TerraSAR-X, r = -0.51
0
50
100
150
Biomass (tons/ha)
200
250
1000
HH/TerraSAR-X, r = -0.49
HV/TerraSAR-X, r = -0.35
-10
0
50
100
-17
150
200
250
Biomass (tons/ha)
Figure 3. Stand-wise TerraSAR-X amplitude data as a function of forest biomass in Heinavesi study site: left
SpotLight scene of 2008-02-05, right StripMap scene of 2008-03-30.
Figura 3. Amplitude dos dados “stand-wise” TerraSAR-X como uma função da biomassa florestal na área de
estudos em Heinavesi: esquerda cena SpotLight de 5 de fevereiro de 2008, diretita HH, direita cena
StripMap de 30 de março de 2008.
The level of HH backscatter in the 2008-02-05 scene is almost 2 dB lower than in the 2008-03-30 scene
(Figure 3). This difference is most likely due to the low temperature (-6 ºC) during the February acquisition –
the forest canopy components and ground were firmly frozen during the acquisition. On 2008-03-30, the
temperature fluctuated around 0 ºC, and there was more liquid water in the components of forest canopy and
in the soil.
Figure 4 shows a scatter diagram between forest biomass and the HH-VV cross-coherence data of scene
2008-02-05. The correlation between coherence magnitude and biomass is low and positive. This is unlike in
repeat-pass interferometry, where small wind-induced changes in the positions of twigs and branches
between image acquisitions produce negative correlation between coherence magnitude and biomass. In the
case of (single-scene) cross-coherence between HH and VV polarisations, there are no such positional
changes.
601
o
(dB)
σHV
1500
VIII Seminário de Atualização em Sensoriamento Remoto e Sistemas de Informações Geográficas Aplicados à Engenharia Florestal
X/HH-VV Coherence in Heinavesi as a Function of Forest Biomass
HH-VV Coherence Magnitude
-50
-60
-70
0.50
-80
-90
HH-VV coherence magnitude, r = 0.15
HH-VV coherence phase, r = 0.61
0.45
0
50
100
150
200
-100
HH-VV Coherence Phase (degrees)
-40
0.55
250
Biomass (tons/ha)
Figure 4. HH-VV coherence magnitude and phase in TerraSAR-X data in the Heinavesi study site as a
function of forest biomass.
Figura 4. Magnitude de coerência entre o HH-VV e a fase dos dados na área de estudos em Heinavesi como
uma função da biomassa florestal.
The phase of the HH-VV cross-coherence is more correlated with forest biomass. One reason for this
correlation can be the changing proportion of the so called double-bounce component (reflected from ground
to tree stems or vice versa) in HH polarisation. As the double-bounce component travels a longer distance
than a single-bounce scattering from twigs and branches, the phase of HH polarisation (and the phase
difference between HH and VV polarisations) changes as the proportion of double-bounce component
decreases with increasing biomass (and increasing attenuation by the forest canopy). The phase of HH-VV
cross-coherence essentially measures the HH-VV difference of the backscattered signal. The fairly high
correlation between the phase of HH-VV cross-coherence and forest biomass was only observed in
TerraSAR-X data. In the polarimetric ALOS/Palsar scene of 2008-10-30, the phase of HH-VV crosscoherence was uncorrelated with forest biomass.
The correlation of TerraSAR-X amplitude data and forest biomass seems to be fairly low in winter-time
scenes. Despite this, clear-cut areas can be detected in visual analysis because boundaries between open
areas and high forest can be seen due to the cast shadows produced by the forest edge. The high spatial
resolution of TerraSAR-X facilitates this type of visual interpretation.
DISCUSSION
ALOS/Palsar data can be used for mapping boreal forest biomass for wide areas if the accuracy requirements
are not very high and if high-biomass forests do not occupy large areas in the area to be mapped. This latter
condition is true in the northern part of the boreal forest zone close to the arctic bush land and tundra zones.
Both dual-polarised and fully polarimetric scenes can be used, but polarimetric data may cause difficulties
due to the narrower image swath and holes in image coverage.
TerraSAR-X results are very preliminary because only two winter-time scenes were used in the study.
Despite the high frequency of X-band data, TerraSAR-X data with high incidence angles of over 40 degrees
were correlated to forest biomass. The highest correlations were found between the phase of co-polarised
cross-coherence and forest biomass. TerraSAR-X data with a high spatial resolution seem well suited for
mapping of clear-cut areas using visual interpretation.
602
VIII Seminário de Atualização em Sensoriamento Remoto e Sistemas de Informações Geográficas Aplicados à Engenharia Florestal
ACKNOWLEDGEMENTS
TEKES (Finnish Funding Agency for Technology and Innovation) is acknowledged for funding project
NewSAR. JAXA and ESA are acknowledged for supplying ALOS/Palsar data (in ALOS/Aden AO project
ESA-3557) and DLR for supplying TerraSAR-X data (in TerraSAR-X AO project LAN0032). UPM Ltd. is
acknowledged for supplying the forest inventory ground data of the Heinavesi site and Etela-Pohjanmaan
Metsakeskus for supplying the forest inventory ground data of the Kuortane site.
REFERENCES
DOBSON, C. et al. 1992. Dependence of radar backscatter on coniferous forest biomass, IEEE Transactions
on Geoscience and Remote Sensing, v. 30, n. 2, p. 412-415.
HAME, T. et al. 1992. Estimation of carbon storage in boreal forest using remote sensing data, Pilot study, in
The Finnish Programme on Climate Change, Progress report, edited by M. Kanninen and P. Anttila,
Publications of the Academy of Finland 2/92, Helsinki, Finland, p. 250-255.
HAME, T. et al. 1997. A methodology for the estimation of biomass of conifer-dominated boreal forest
using NOAA AVHRR data, International Journal of Remote Sensing, v. 18, n. 15, p. 3211-3243.
RAUSTE, Y. et al. 1994. Radar-based forest biomass estimation, International Journal of Remote Sensing, v.
15, n. 14, p. 2797-2808.
RAUSTE, Y. 2006. Techniques for wide-area mapping of forest biomass using radar, VTT Publications
591/2005, available at: http://www.vtt.fi/inf/pdf, 184 p.
RAUSTE, Y. et al. 2007. Ortho-rectification and terrain correction of polarimetric SAR data applied in the
ALOS/Palsar context. In: Proceedings of IGARSS-2007, Barcelona, Spain, 23.-27.7.2007, IEEE 2008, p.
1618 - 1621.
RAUSTE, Y. et al. 2008. Polarimetric L-band radar in forest stem volume mapping – The role of linear and
Circular polarizations, submitted to Remote Sensing of Environment.
LE TOAN, T. et al. 1992. Relating forest biomass to SAR data, IEEE Transactions on Geoscience and
Remote Sensing, v. 30, n. 2, p. 403-411
603
Download